Review
. 2021 Sep;12(9):1526-1539.
doi: 10.1111/jdi.13576. Epub 2021 Jun 16.

β-Cell failure in diabetes: Common susceptibility and mechanisms shared between type 1 and type 2 diabetes

Affiliations
Review

β-Cell failure in diabetes: Common susceptibility and mechanisms shared between type 1 and type 2 diabetes

Hiroshi Ikegami et al. J Diabetes Investig. 2021 Sep.

Abstract

Diabetes mellitus is etiologically classified into type 1, type 2 and other types of diabetes. Despite distinct etiologies and pathogenesis of these subtypes, many studies have suggested the presence of shared susceptibilities and underlying mechanisms in β-cell failure among different types of diabetes. Understanding these susceptibilities and mechanisms can help in the development of therapeutic strategies regardless of the diabetes subtype. In this review, we discuss recent evidence indicating the shared genetic susceptibilities and common molecular mechanisms between type 1, type 2 and other types of diabetes, and highlight the future prospects as well.

Keywords: Endoplasmic reticulum stress; Oxidative stress; β-Cell failure.


Conflict of interest statement

The authors declare no conflict of interest.

Figures
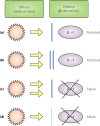
Figure 1
Figure 1
Relative balance between the offense and defense mechanisms in β‐cell failure. Offense is usually an external stress against the β‐cells, such as an immune‐mediated attack in type 1 diabetes and increased insulin demand due to obesity and insulin resistance in type 2 diabetes. Defense is usually a β‐cell intrinsic mechanism, such as protective mechanisms against oxidative stress, endoplasmic reticulum stress and apoptosis. (a) Normal balance. During a usual offensive attack (yellow arrow), normal defense (blue bar) can protect the β‐cells from failure. (b) Strong offense and defense. During a strong offensive attack, β‐cells can be protected from failure if the defense is sufficiently strong. (c) β‐Cell failure due to strong offense. Faced with a strong offensive attack, β‐cell failure manifests if the defense is not sufficiently strong. (d) β‐Cell failure due to weak defense. Even during a usual or slightly strong offensive attack, β‐cell failure can manifest if the defense is too weak.
Figure 2
Figure 2
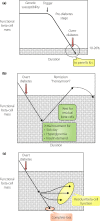
Functional β‐cell mass before and after the onset of type 1 diabetes. The vertical axis represents the functional β‐cell mass, which denotes the sum of β‐cell mass and functional status of each β‐cell. The horizontal axis is the time taken for the onset of type 1 diabetes. (a) Progressive decrease in the functional β‐cell mass toward the onset of diabetes. The functional β‐cell mass progressively decreases as the onset of type 1 diabetes approaches, even if the glucose level is within the normal range (prediabetes stage). This decrease is not necessarily linear; rather, it fluctuates from time‐to‐time, depending on the situation. In the long term, however, this decrease is progressive toward diabetic onset. When the functional β‐cell mass reaches a critically low level, overt type 1 diabetes develops with acute‐onset ketosis or ketoacidosis. (b) Partial recovery in the functional β‐cell mass soon after diabetes onset (honeymoon period). The functional β‐cell mass partially recovers after initial treatment of sick‐day conditions and near normalization of hyperglycemia can be achieved by administering sufficient quantity of insulin. (c) The functional β‐cell mass in the long term after the onset of diabetes. Changes in the functional β‐cell mass after diabetes onset vary from patient to patient; for instance, the progressive decrease in β‐cell mass results in complete depletion of endogenous insulin in some cases. In other cases, the functional β‐cell mass is preserved, albeit a very small amount, even after a long duration. However, there might be cases with sustained remission, although not clearly evidenced, that keep the functional β‐cell mass and insulin secretory function above the insulin‐dependency level.
Figure 3
Figure 3
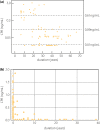
β‐Cell function relative to the duration of type 1 diabetes. (a) C‐peptide (CPR) levels at 90 min after meal tolerance test (vertical axis) relative to the duration of type 1 diabetes in European populations. Endogenous insulin secretion is preserved in a substantial number of patients with long‐standing type 1 diabetes in European populations (modified from Oram et al.25). (b) Fasting CPR levels (vertical axis) are plotted against the duration of diabetes (horizontal axis) in Japanese patients with acute‐onset type 1 diabetes (autoimmune; n = 77) enrolled at Kindai University Hospital. The endogenous insulin secretion, as assessed by CPR level, was completely lost in most patients as the duration increased. Note that the vertical axis is different from (a), in that fasting CPR levels are shown in the linear scale in this panel, whereas CPR levels at 90 min after the meal tolerance test are shown in the logarithmic scale in (a).
Figure 4
Figure 4
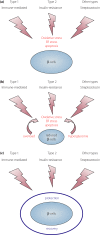
External stresses and mechanisms in β‐cell failure. (a) Different external stresses and similar final mechanisms of β‐cell failure in different types of diabetes. Different external stresses: immune‐mediated attack in type 1 diabetes, insulin resistance in type 2 diabetes and β‐cell toxic effect (streptozotocin) in other types of diabetes. Different offensive stresses share the same mechanisms, such as oxidative stress, endoplasmic reticulum stress and apoptosis in the final stage of β‐cell failure. (b) Progressive β‐cell failure after diabetes onset. Once the β‐cell mass is reduced, each β‐cell faces increased stress, such as increased insulin demand (overload) and hyperglycemia, leading to the acceleration of β‐cell failure because of oxidative stress and endoplasmic reticulum stress. (c) Sufficient protection against external stresses with a strong defensive mechanism, such as overexpression of thioredoxin, can preserve the functional β‐cell mass in type 1 (NOD mice), type 2 (db/db mice) and other types of diabetes (single high dose of streptozotocin).
Figure 5
Figure 5
Shared genetic susceptibilities between type 1 and type 2 diabetes. Both type 1 and type 2 diabetes are multifactorial diseases caused by the interaction of genetic and environmental factors. Genetic factors consist of multiple susceptibility genes, and among them, some genes are specific to each subtype; for instance, type 1 diabetes‐specific genes (A and B), such as autoimmune‐related genes (e.g., HLA), and type 2 diabetes‐specific genes (E and F) such as obesity‐ and insulin resistance‐related genes (e.g., FTO). Additionally, there are some common genes shared between both diabetes types (C and D), such as genes related to β‐cell fragility or vulnerability (e.g., GLIS3). Modified from Ikegami et al.3 with permission.
Figure 6
Figure 6
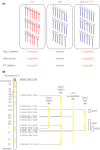
Chromosome 11 harbors genes for different types of diabetes. (a) Chromosome 11 of the NSY mouse possesses susceptibility genes for spontaneous type 2 diabetes, high‐sucrose induced diabetes and streptozotocin (STZ)‐induced diabetes. Control C3H mice are resistant to diabetes; whereas, NSY mice are susceptible to type 2 and STZ‐induced diabetes. Substitution of a single chromosome 11 of C3H mice with chromosome 11 from NSY mice (C3H‐Chr11NSY) converted the diabetes‐resistant C3H mice to diabetes‐susceptible mice, indicating that chromosome 11 harbored susceptibility genes for spontaneous type 2 diabetes, high‐sucrose induced diabetes and STZ‐induced diabetes. (b) Location of the susceptible loci for type 1 (Idd4 in NOD mice), type 2 (Nidd1n in NSY mice) and STZ‐induced diabetes on chromosome 11. #1 The support interval of quantitative trait loci for glucose intolerance. #2 Regions of impaired insulin secretion by congenic mapping under a high‐sucrose environment. #3 The support interval of STZ sensitivity locus in NOD mice was not clearly defined because of a limited number of markers. The centromeric and telomeric ends of the interval are therefore shown in the graduation. #4 Idd4 is now divided into several sub‐loci (Idd4.1, Idd4.2, and Idd4.3); however, each sub‐locus was mapped by multiple research groups using different strain combinations. Therefore, the interval including all these loci is shown in the closed bar. The interval of each sub‐locus is shown in the open bar.

Similar articles

Cited by

References

    1. The Committee of the Japan Diabetes Society on the Diagnostic Criteria of Diabetes Mellitus . Report of the committee on the classification and diagnostic criteria of diabetes mellitus. J Diabetes Investig 2010; 1: 212–228. - PMC - PubMed
    1. American Diabetes Association . Diagnosis and classification of diabetes mellitus. Diabetes Care 2014; 37(suppl 1): S81–S90. - PubMed
    1. Ikegami H, Fujisawa T, Ogihara T. Mouse models of type 1 and type 2 diabetes derived from the same closed colony: genetic susceptibility shared between two types of diabetes. ILAR J 2004; 45: 268–277. - PubMed
    1. Boitard C, Efendic S, Ferrannini E, et al. A tale of two cousins: type 1 and type 2 diabetes. Diabetes 2005; 54(Suppl2): S1–S3. - PubMed
    1. Dooley J, Tian L, Schonefeldt S, et al. Genetic predisposition for beta cell fragility underlies type 1 and type 2 diabetes. Nat Genet 2016; 48: 519–527. - PMC - PubMed

MeSH terms