. 2021 May 17;22(1):180.
doi: 10.1186/s12882-021-02374-2.

Higher CD19+CD25+ Bregs are independently associated with better graft function in renal transplant recipients

Affiliations

Higher CD19+CD25+ Bregs are independently associated with better graft function in renal transplant recipients

Eman H Ibrahim et al. BMC Nephrol. .

Abstract

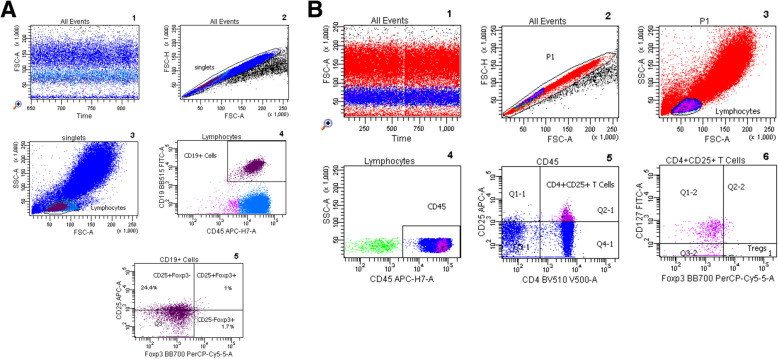
Background: The Identification of B cell subsets with regulatory functions might open the way to new therapeutic strategies in the field of transplantation, which aim to reduce the dose of immunosuppressive drugs and prolong the graft survival. CD25 was proposed as a marker of a B-cell subset with an immunosuppressive action termed Bregs. The effect of CD19 + CD25 + Bregs on graft function in renal transplant recipients has not yet been elucidated. We investigated a potential impact of CD19 + CD25 + Bregs on renal graft function as well as a possible interaction of CD19 + CD25 + Bregs with peripheral Tregs in healthy controls, end-stage kidney disease patients (ESKD), and renal transplant recipients. Moreover, we aimed to investigate the association of CD19 + CD25 + Bregs with serum IL-10, TGF-ß1, and IFN-γ in the same study groups.

Method: Thirty-one healthy controls, ninety renal transplant recipients, and eighteen ESKD patients were enrolled. We evaluated the CD19 + CD25 + Bregs and Treg absolute counts. Next, we investigated CD19 + CD25 + Bregs as predictors of good graft function in multiple regression and ROC analyses. Finally, we evaluated the association between CD19 + CD25+ Bregs and serum IL-10, TGF-ß, and IFN-γ.

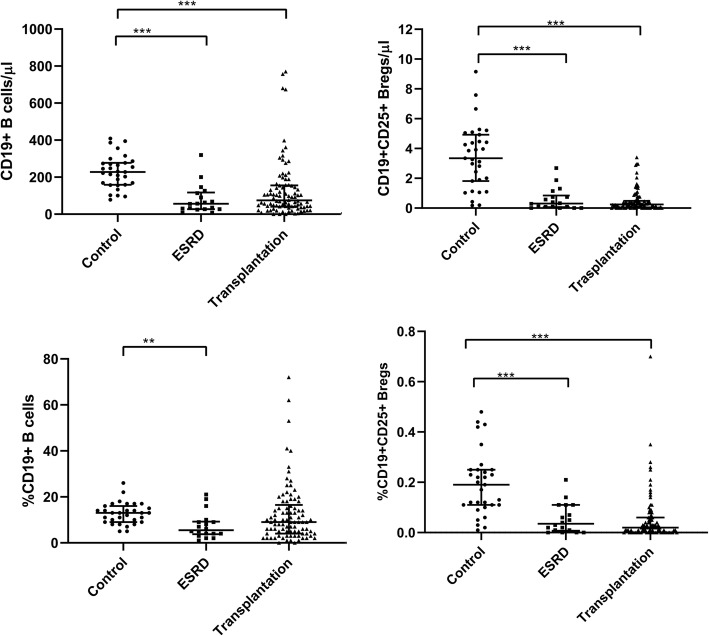
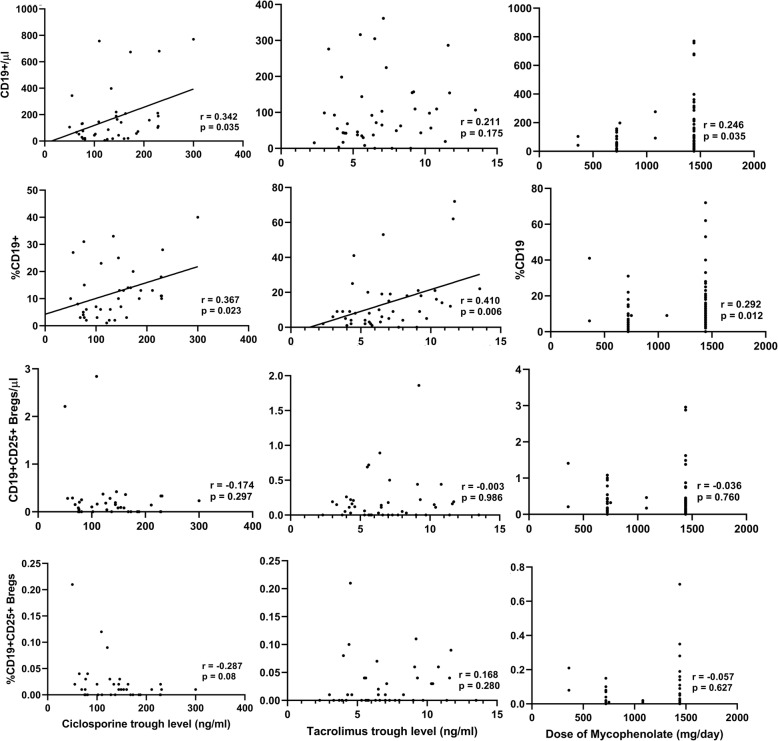
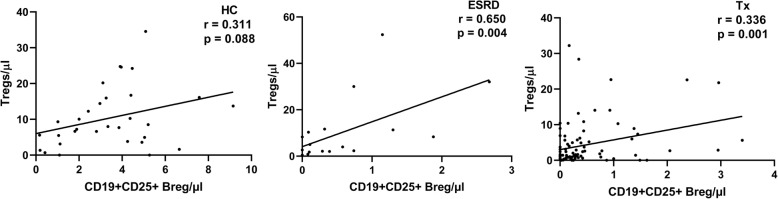
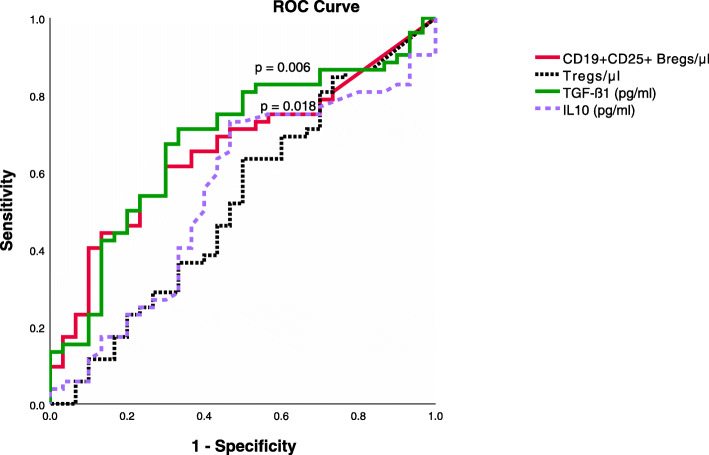
Results: ESKD patients and renal transplant recipients showed lower counts of CD19 + CD25+ Bregs compared to healthy controls (p < 0.001). Higher CD19 + CD25+ Breg counts were independently associated with a better GFR in renal transplant recipients (unstandardized B coefficient = 9, p = 0.02). In these patients, higher CD19 + CD25+ Bregs were independently associated with higher Treg counts (unstandardized B = 2.8, p = 0.004). In ROC analysis, cut-offs for CD19 + CD25 + Breg counts and serum TGF-ß1 of 0.12 cell/μl and 19,635.4 pg/ml, respectively, were shown to provide a good sensitivity and specificity in identifying GFR ≥ 30 ml/min (AUC = 0.67, sensitivity 77%, specificity 43%; AUC = 0.65, sensitivity 81%, specificity 50%, respectively). Finally, a significant positive association between CD19 + CD25+ Bregs and TGF-ß1 was shown in renal transplant recipients (r = 0.255, p = 0.015).

Conclusions: Our findings indicate that higher counts of CD19 + CD25+ Bregs are independently associated with better renal function and higher absolute Treg counts in renal transplant recipients.

Keywords: Bregs; GFR; Renal transplantation; Tregs.


Conflict of interest statement

The authors declare that they have no competing interests.

Figures

Fig. 1
Fig. 1
a Gating strategy for CD19 + CD25+ Bregs. (1) After ensuring the stability of the run and (2) exclusion of doublets, (3) lymphocytes were gated according to size. (4) Subsequently, CD19 was plotted versus CD45 to identify CD19+ cells. CD25 was then plotted against Foxp3 to further characterize CD19 + CD25+ Bregs into Foxp3- and Foxp3 + . b Gating strategy for Tregs. All the events were analyzed after (1) ensuring stability of the run and (2) exclusion of doublets. (3) Lymphocytes were gated according to size. (4) Afterwards, CD45 was gated to focus on lymphocytes. (5) CD25 vs CD4 dot plot allows the identification of CD4 + CD25+ T lymphocytes, (6) Foxp3 + CD127- cells were gated out of CD4 + CD25+ lymphocytes to identify Tregs
Fig. 2
Fig. 2
Absolute and relative CD19+ B cells and CD19 + CD25+ Bregs in healthy controls (a), ESKD patients (b), and renal transplant recipients (c). CD19+ B cells as well as CD19 + CD25+ Breg counts showed a marked decrease in ESKD and renal transplant patients. Adjusted p values are depicted (*p < 0.050, **p < 0.010, ***p < 0.001)
Fig. 3
Fig. 3
Comparison of absolute and relative counts of CD19+ B cells (a and b) and CD19+ CD25+ Bregs (c and d) between the Basiliximab-group and the ATG-group in renal transplant recipients. No statistically significant difference could be demonstrated between the two groups
Fig. 4
Fig. 4
Correlation between the absolute or relative counts of CD19+ B cells or CD19 + CD25+ Bregs and ciclosporine (a) or tacrolimus trough levels (b), or the daily doses of mycophenolic acid in renal transplant recipients (c). A positive correlation was shown between ciclosporine trough levels and absolute CD19+ B cells but not CD19 + CD25+ Bregs in renal transplant recipients. Tacrolimus trough levels showed no correlation with absolute CD19 + B cells or CD19 + CD25+ Bregs. No significant correlation between mycophenolic acid daily doses and CD19 + CD25+ Bregs
Fig. 5
Fig. 5
Association of the absolute counts of Tregs with the absolute counts of CD19 + CD25+ cells in healthy controls (HC) (a), end-stage kidney disease patients (ESKD) (b), and renal transplant recipients (Tx) (c). A significant positive correlation was shown in ESKD patients as well as renal transplant recipients
Fig. 6
Fig. 6
Area under the curves (AUCs) of receiving operator characteristics for the absolute counts of CD19 + CD25 + Bregs and Tregs, serum TGF-ß1, and serum IL-10 as possible identifiers of eGFR ≥ 30 ml/min. The optimal cutoff values were obtained through analysis of coordinate points of ROC curve. The AUC of CD19 + CD25 + Bregs as well as serum TGFβ1 showed statistical significance (AUC = 0.66, p = 0.018, AUC = 0.68, p = 0.006, respectively). AUC values of Treg absolute count as well as serum IL-10 were not significantly increased (AUC = 0.52, p = 0.7; AUC = 0.54, p = 0.5, respectively)

Similar articles

Cited by

References

    1. LeBien TW, Tedder TF. B lymphocytes: how they develop and function. Blood. 2008;112(5):1570–1580. doi: 10.1182/blood-2008-02-078071. - DOI - PMC - PubMed
    1. Katz SI, Parker D, Turk JL. B-cell suppression of delayed hypersensitivity reactions. Nature. 1974;251(5475):550–551. doi: 10.1038/251550a0. - DOI - PubMed
    1. Neta R, Salvin SB. Specific suppression of delayed hypersensitivity: the possible presence of a suppressor B cell in the regulation of delayed hypersensitivity. J Immunol. 1974;113(6):1716–1725. - PubMed
    1. Wolf SD, Dittel BN, Hardardottir F, Janeway CA., Jr Experimental autoimmune encephalomyelitis induction in genetically B cell-deficient mice. J Exp Med. 1996;184(6):2271–2278. doi: 10.1084/jem.184.6.2271. - DOI - PMC - PubMed
    1. Mizoguchi A, Mizoguchi E, Smith RN, Preffer FI, Bhan AK. Suppressive role of B cells in chronic colitis of T cell receptor alpha mutant mice. J Exp Med. 1997;186(10):1749–1756. doi: 10.1084/jem.186.10.1749. - DOI - PMC - PubMed