

Complete spatial characterisation of N-glycosylation upon striatal neuroinflammation in the rodent brain
- PMID: 33993882
- PMCID: PMC8127229
- DOI: 10.1186/s12974-021-02163-6
Complete spatial characterisation of N-glycosylation upon striatal neuroinflammation in the rodent brain
Abstract
Background: Neuroinflammation is an underlying pathology of all neurological conditions, the understanding of which is still being comprehended. A specific molecular pathway that has been overlooked in neuroinflammation is glycosylation (i.e., post-translational addition of glycans to the protein structure). N-glycosylation is a specific type of glycosylation with a cardinal role in the central nervous system (CNS), which is highlighted by congenital glycosylation diseases that result in neuropathological symptoms such as epilepsy and mental retardation. Changes in N-glycosylation can ultimately affect glycoproteins' functions, which will have an impact on cell machinery. Therefore, characterisation of N-glycosylation alterations in a neuroinflammatory scenario can provide a potential target for future therapies.
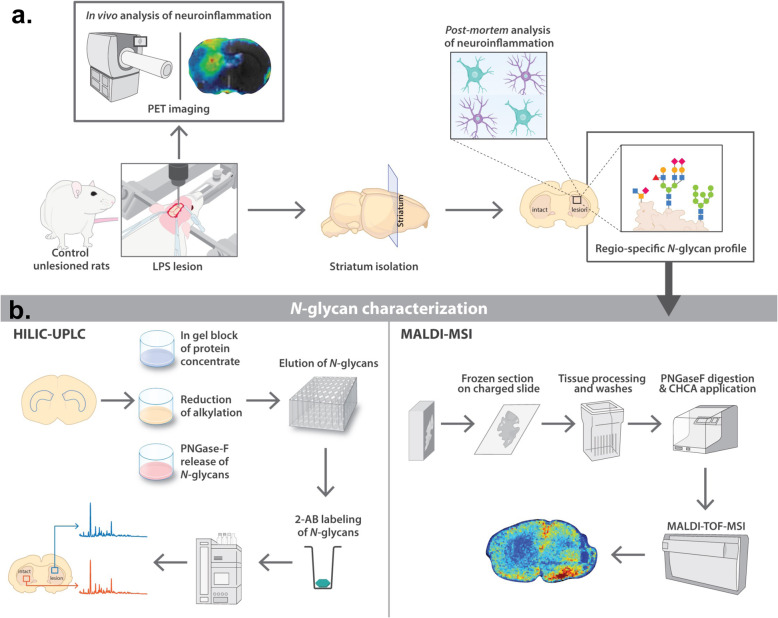
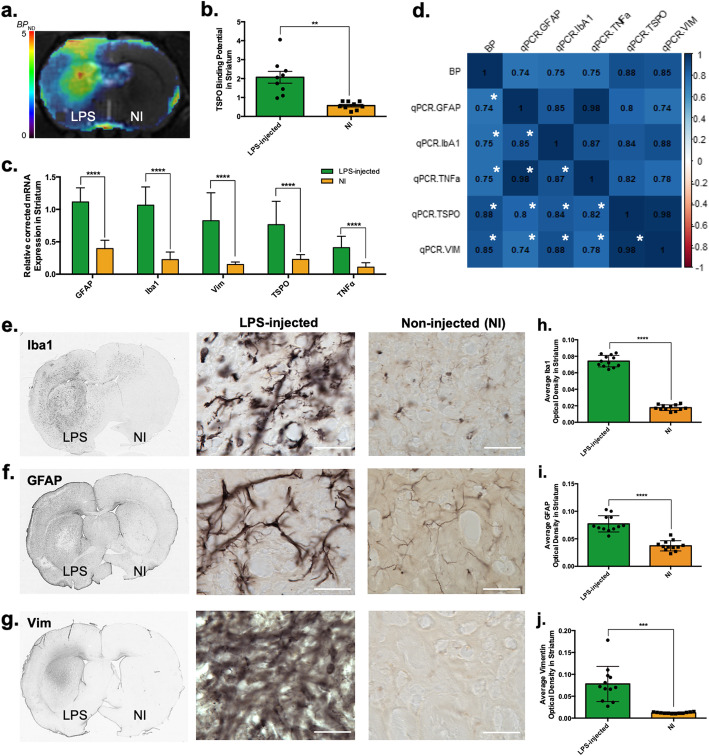
Methods: With that aim, the unilateral intrastriatal injection of lipopolysaccharide (LPS) in the adult rat brain was used as a model of neuroinflammation. In vivo and post-mortem, quantitative and spatial characterisation of both neuroinflammation and N-glycome was performed at 1-week post-injection of LPS. These aspects were investigated through a multifaceted approach based on positron emission tomography (PET), quantitative histology, reverse transcription-quantitative polymerase chain reaction (RT-qPCR), liquid chromatography and matrix-assisted laser desorption ionisation mass spectrometry imaging (MALDI-MSI).
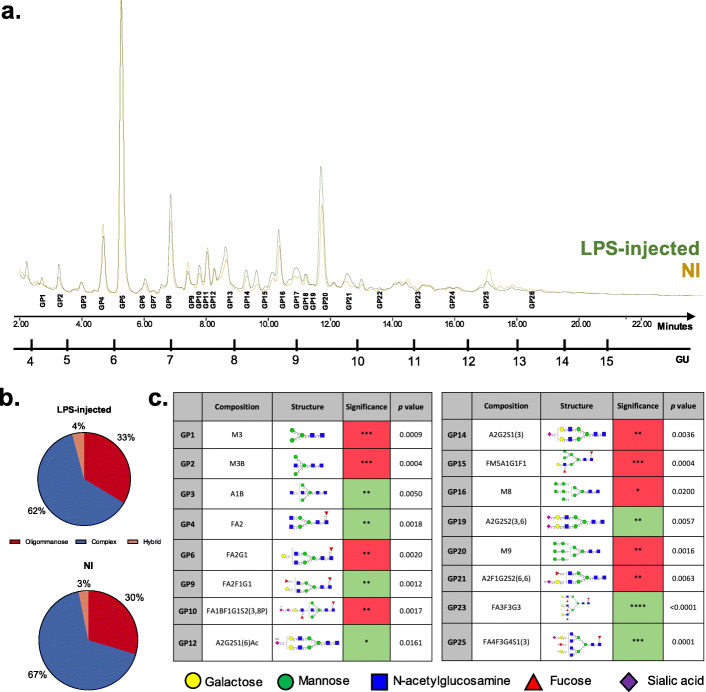
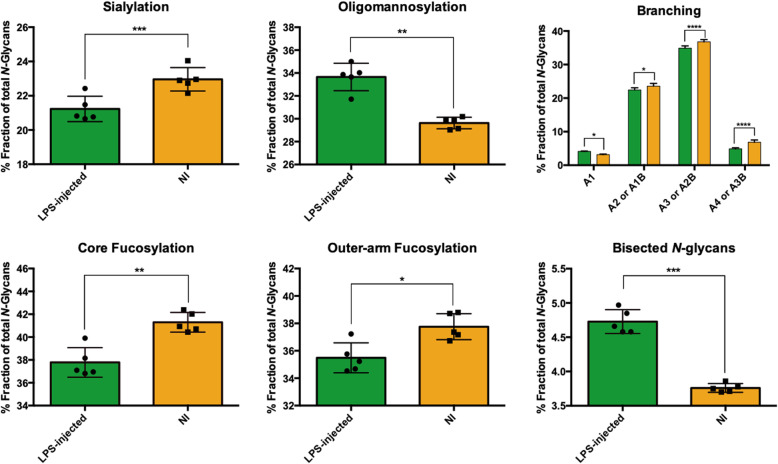
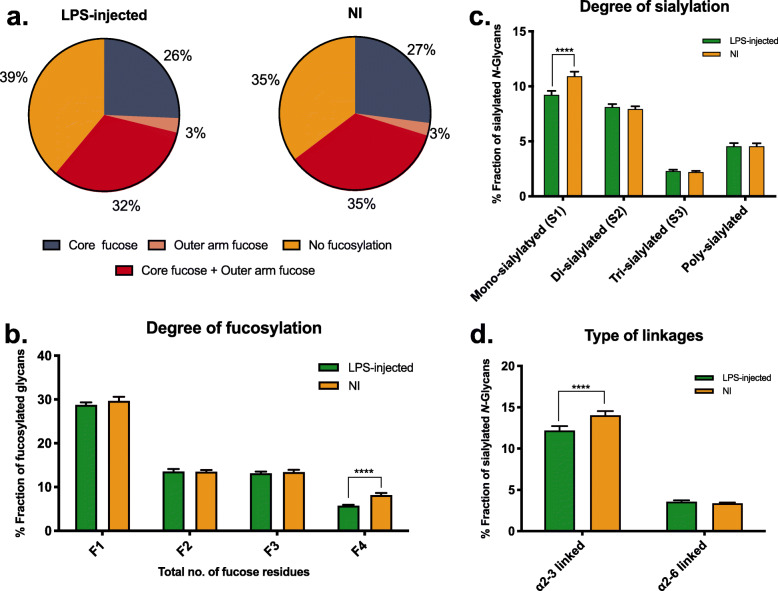
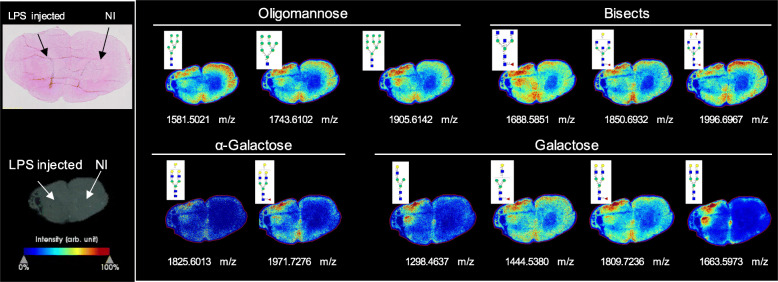
Results: In the brain region showing LPS-induced neuroinflammation, a significant decrease in the abundance of sialylated and core fucosylated structures was seen (approximately 7.5% and 8.5%, respectively), whereas oligomannose N-glycans were significantly increased (13.5%). This was confirmed by MALDI-MSI, which provided a high-resolution spatial distribution of N-glycans, allowing precise comparison between normal and diseased brain hemispheres.
Conclusions: Together, our data show for the first time the complete profiling of N-glycomic changes in a well-characterised animal model of neuroinflammation. These data represent a pioneering step to identify critical targets that may modulate neuroinflammation in neurodegenerative diseases.
Keywords: Glycomics; LPS model; Liquid chromatography; MALDI-MSI; N-glycosylation; Neuroinflammation; Protein glycosylation; Striatum.
Conflict of interest statement
The authors declare that they have no conflict of interests.
Figures
Similar articles
-
The glycosylation landscape of prostate cancer tissues and biofluids.Adv Cancer Res. 2024;161:1-30. doi: 10.1016/bs.acr.2024.04.005. Epub 2024 Apr 25. Adv Cancer Res. 2024. PMID: 39032948 Review.
-
Altered N-linked glycosylation in endometrial cancer.Anal Bioanal Chem. 2021 Apr;413(10):2721-2733. doi: 10.1007/s00216-020-03039-z. Epub 2020 Nov 21. Anal Bioanal Chem. 2021. PMID: 33222001
-
Imaging of N-linked glycans from formalin-fixed paraffin-embedded tissue sections using MALDI mass spectrometry.ACS Chem Biol. 2014 Sep 19;9(9):2149-56. doi: 10.1021/cb500405h. Epub 2014 Jul 30. ACS Chem Biol. 2014. PMID: 25029481 Free PMC article.
-
Region-Specific Cell Membrane N-Glycome of Functional Mouse Brain Areas Revealed by nanoLC-MS Analysis.Mol Cell Proteomics. 2021;20:100130. doi: 10.1016/j.mcpro.2021.100130. Epub 2021 Aug 4. Mol Cell Proteomics. 2021. PMID: 34358619 Free PMC article.
-
Current landscape of protein glycosylation analysis and recent progress toward a novel paradigm of glycoscience research.J Pharm Biomed Anal. 2016 Oct 25;130:273-300. doi: 10.1016/j.jpba.2016.07.015. Epub 2016 Jul 17. J Pharm Biomed Anal. 2016. PMID: 27461579 Review.
Cited by
-
Phosphorylation of N-glycans in the brain: The case for a non-canonical pathway?BBA Adv. 2024 Dec 19;7:100134. doi: 10.1016/j.bbadva.2024.100134. eCollection 2025. BBA Adv. 2024. PMID: 39810827 Free PMC article.
-
In Situ Imaging of O-Linked β-N-Acetylglucosamine Using On-Tissue Hydrolysis and MALDI Mass Spectrometry.Cancers (Basel). 2023 Feb 15;15(4):1224. doi: 10.3390/cancers15041224. Cancers (Basel). 2023. PMID: 36831567 Free PMC article.
-
The Impact of β-1,4-Galactosyltransferase V on Microglial Function.Front Cell Neurosci. 2021 Sep 3;15:723308. doi: 10.3389/fncel.2021.723308. eCollection 2021. Front Cell Neurosci. 2021. PMID: 34539352 Free PMC article.
-
Analysis of carbohydrates and glycoconjugates by matrix-assisted laser desorption/ionization mass spectrometry: An update for 2021-2022.Mass Spectrom Rev. 2025 May-Jun;44(3):213-453. doi: 10.1002/mas.21873. Epub 2024 Jun 24. Mass Spectrom Rev. 2025. PMID: 38925550 Free PMC article. Review.
-
Exogenous L-fucose attenuates depression induced by chronic unpredictable stress: Implicating core fucosylation has an antidepressant potential.J Biol Chem. 2025 Mar;301(3):108230. doi: 10.1016/j.jbc.2025.108230. Epub 2025 Jan 27. J Biol Chem. 2025. PMID: 39864626 Free PMC article.
References
MeSH terms
Substances
Grants and funding
LinkOut - more resources
Full Text Sources
Other Literature Sources
Molecular Biology Databases
