

Time-dependent probability distribution for number of infection in a stochastic SIS model: case study COVID-19
- PMID: 33994678
- PMCID: PMC8112579
- DOI: 10.1016/j.chaos.2021.110983
Time-dependent probability distribution for number of infection in a stochastic SIS model: case study COVID-19
Abstract
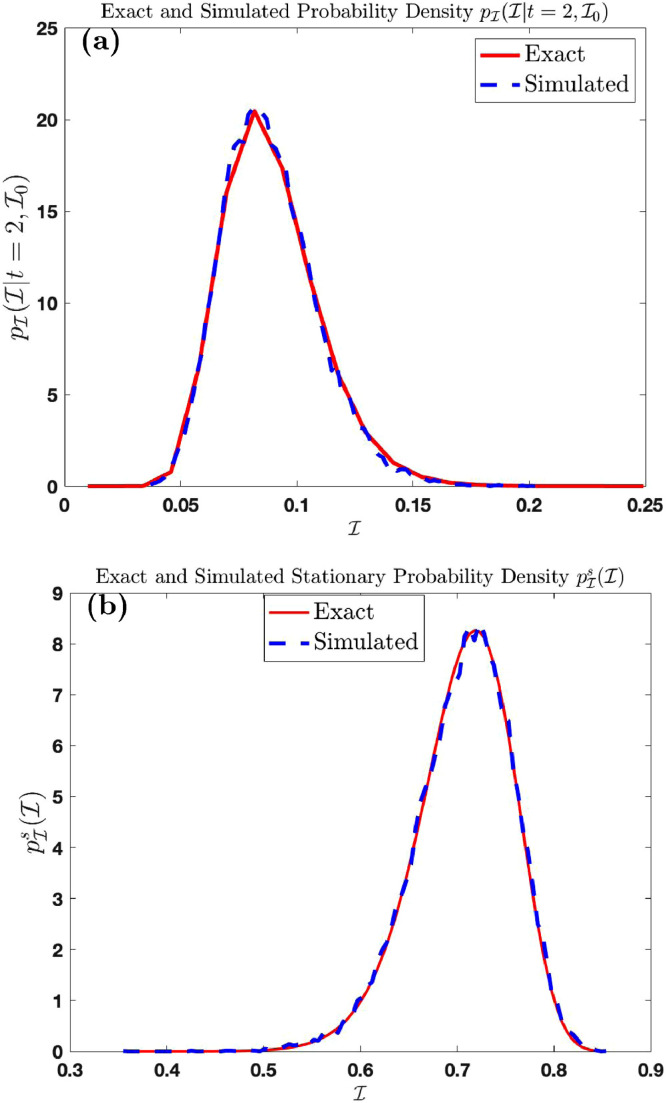
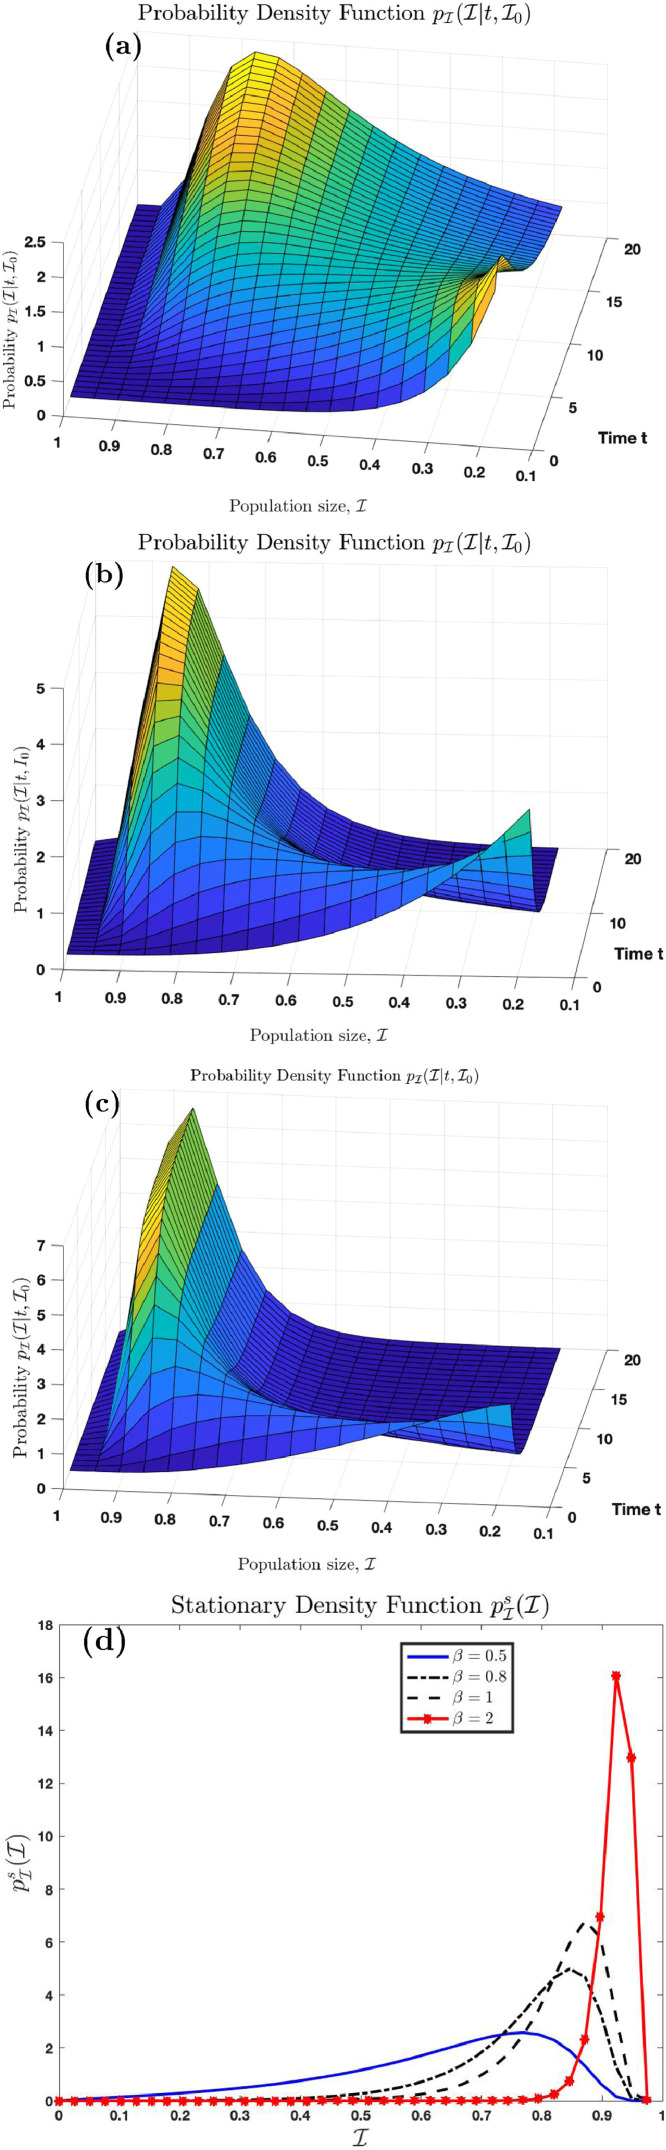
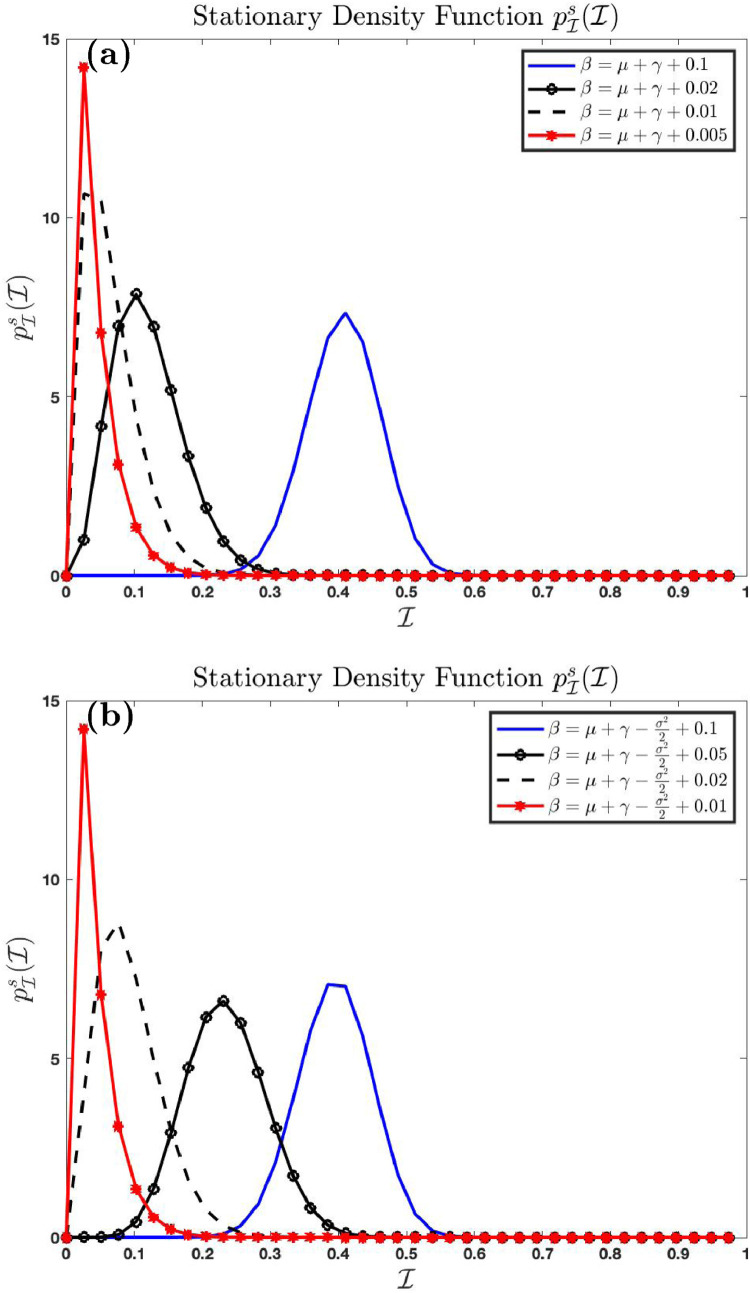
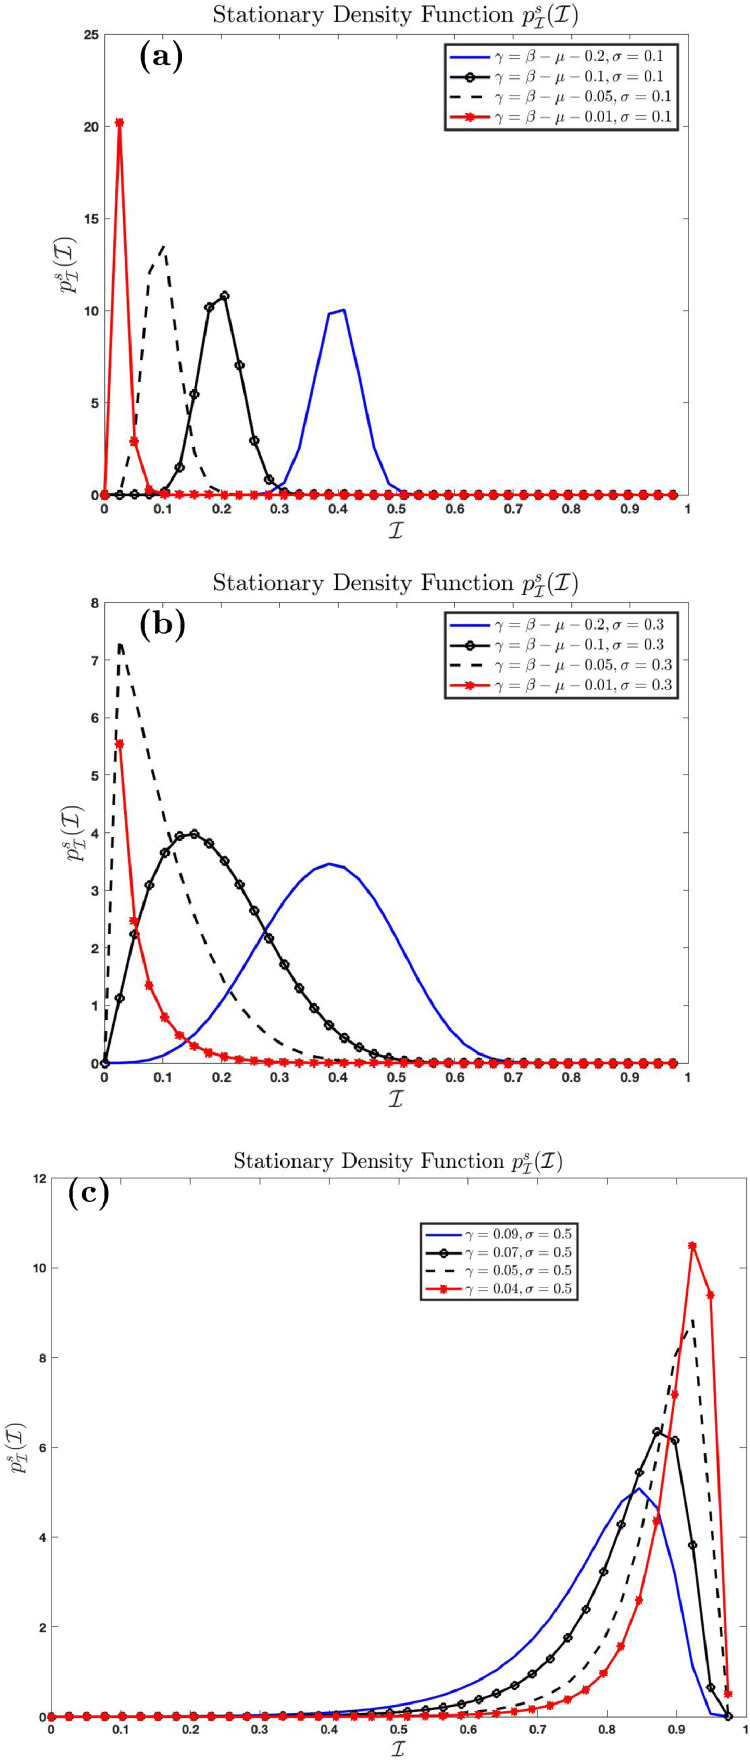
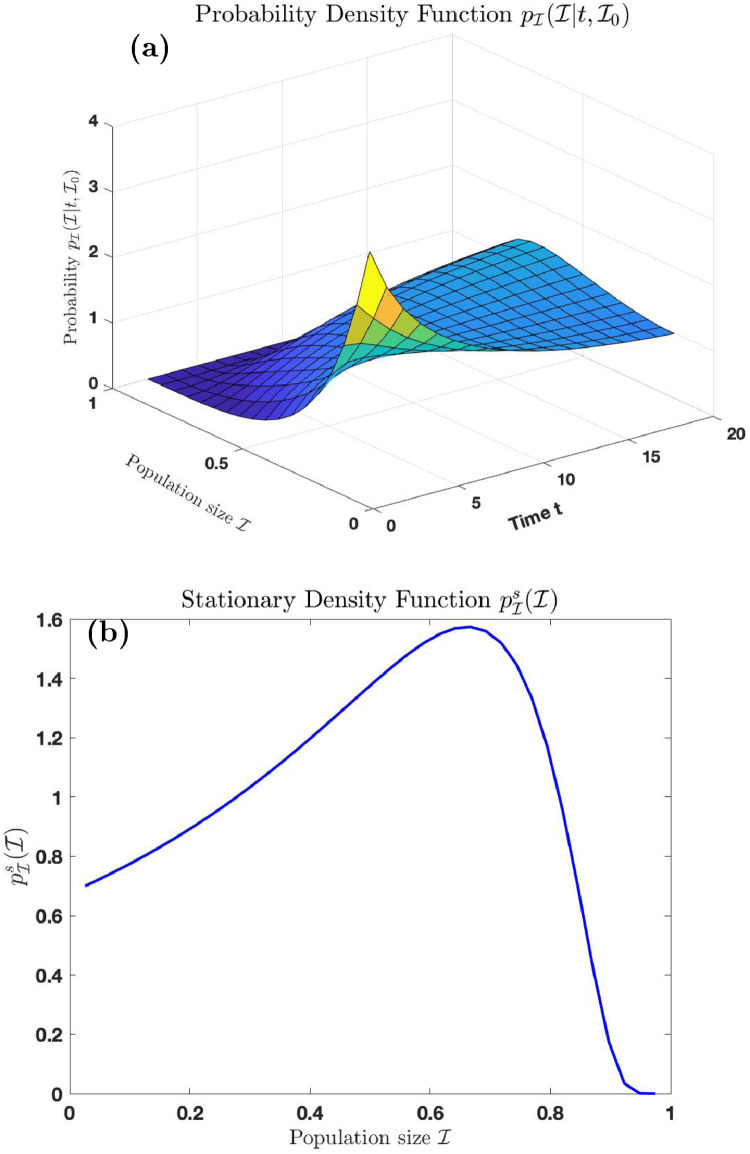
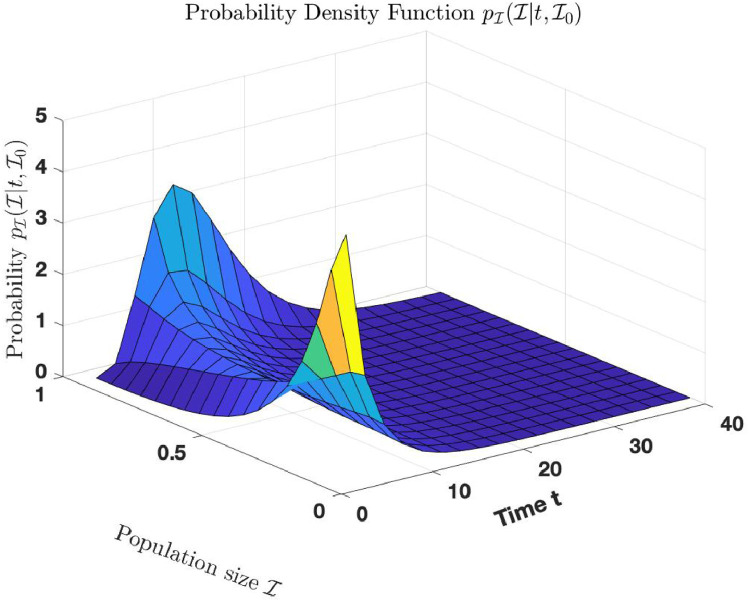
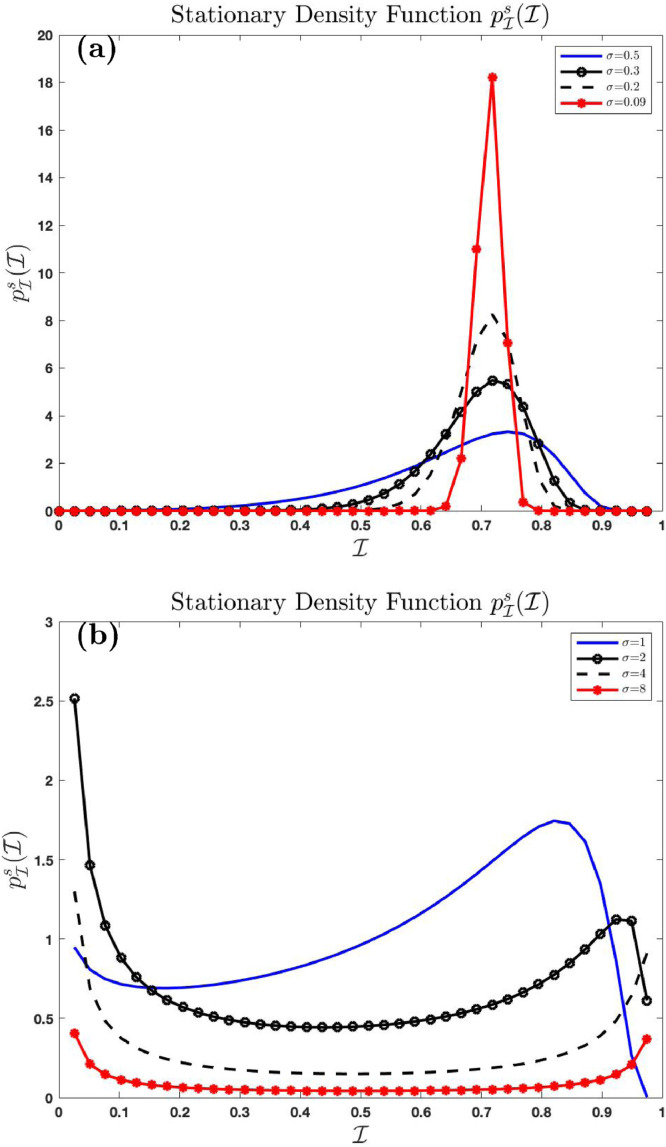
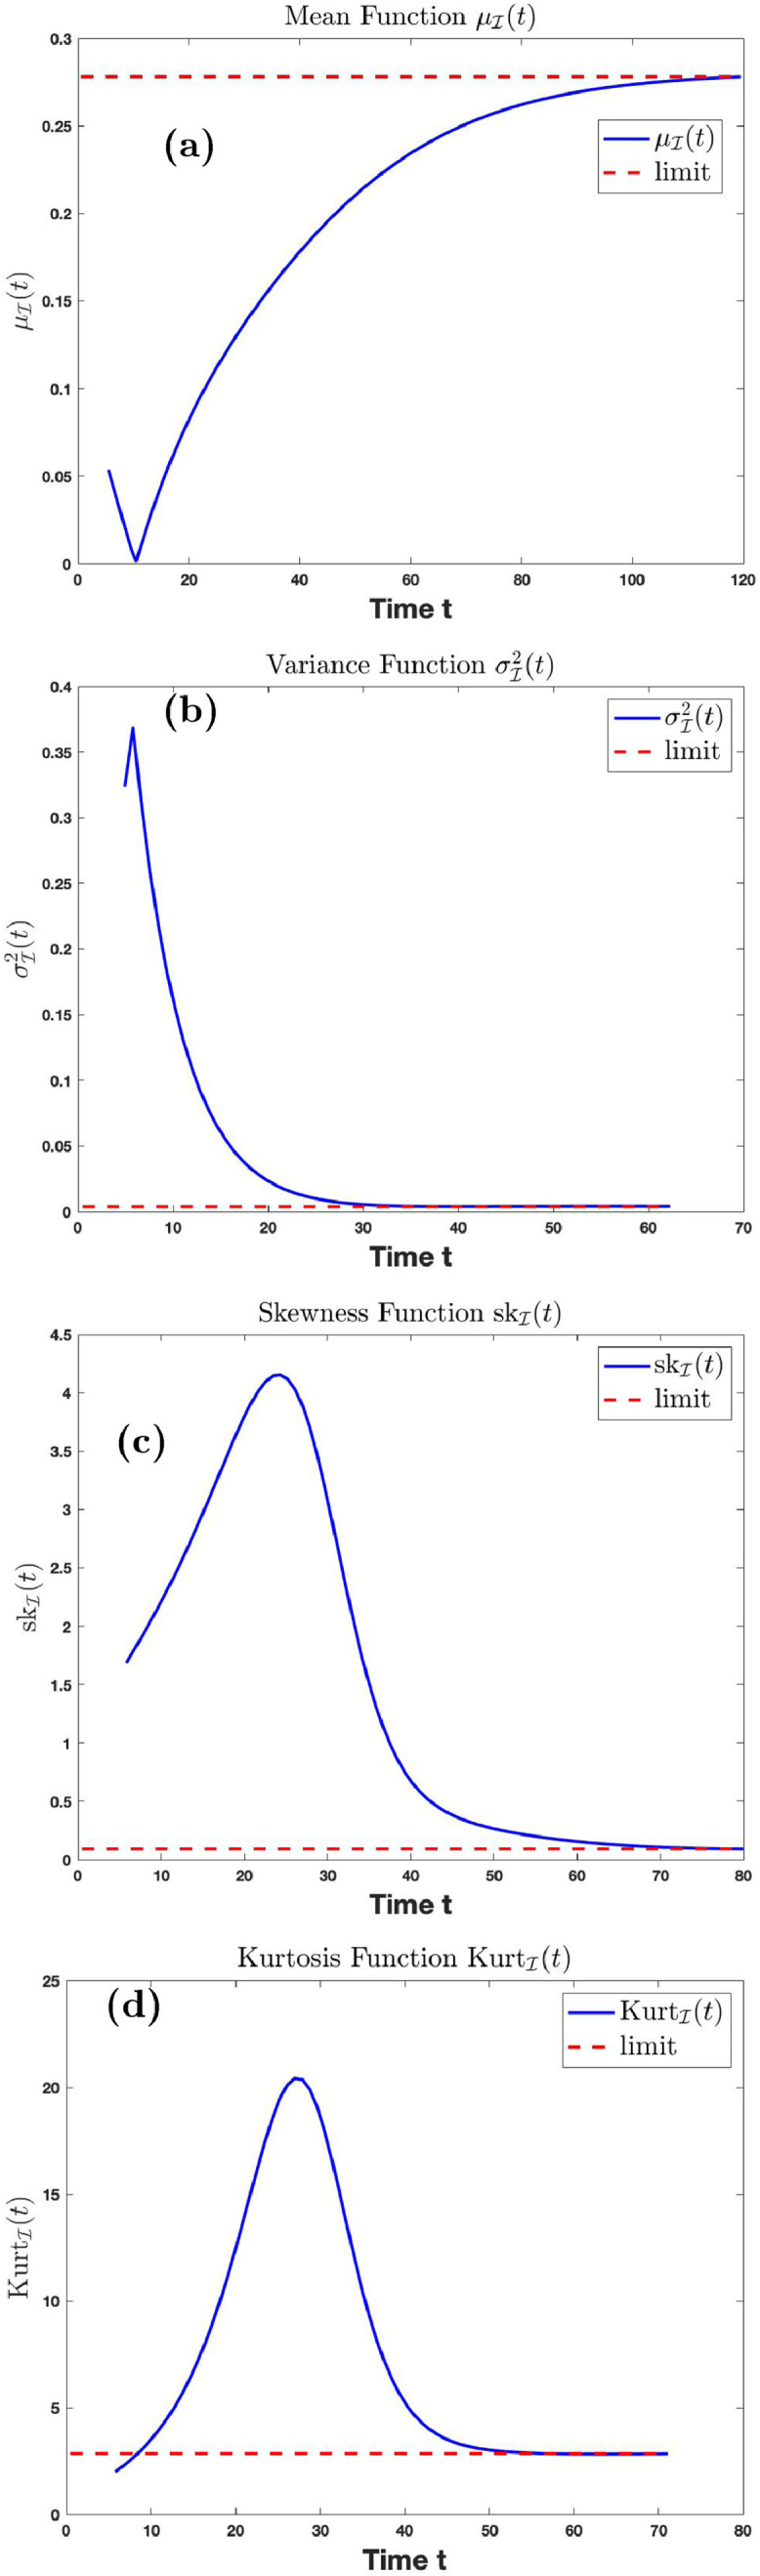
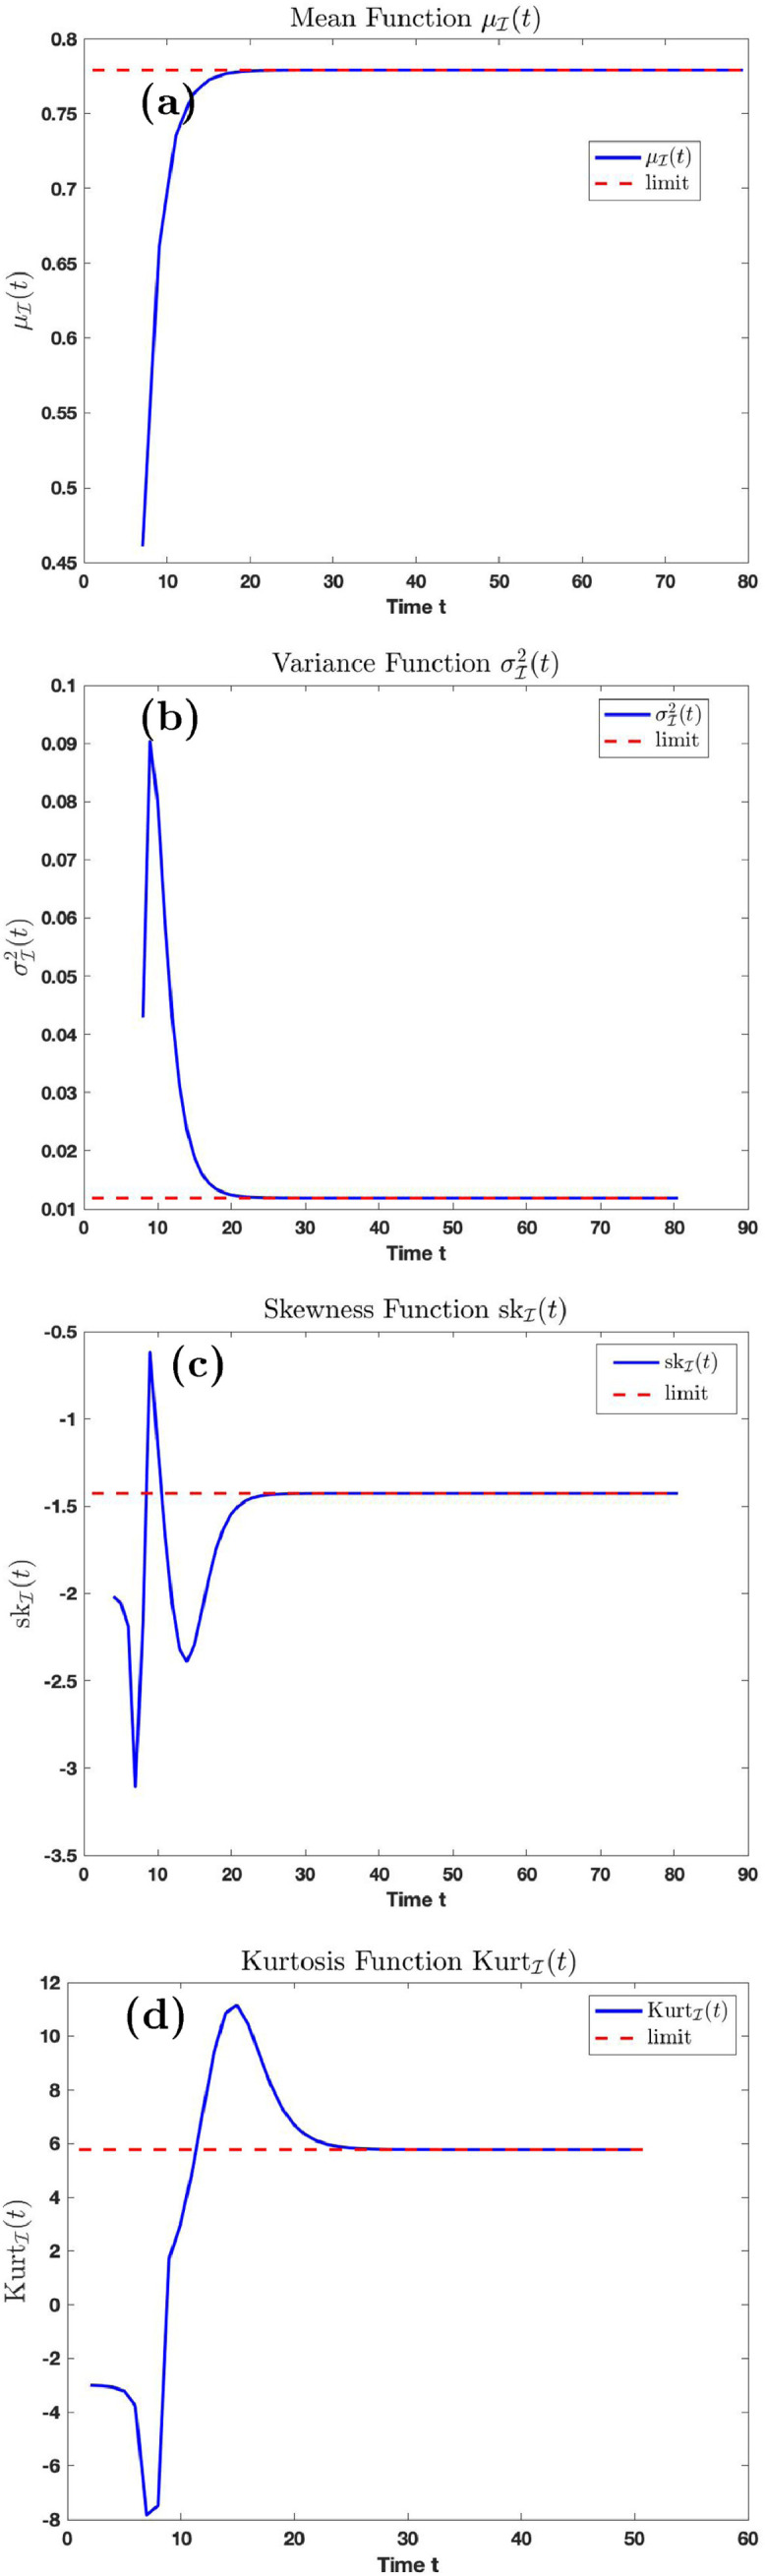
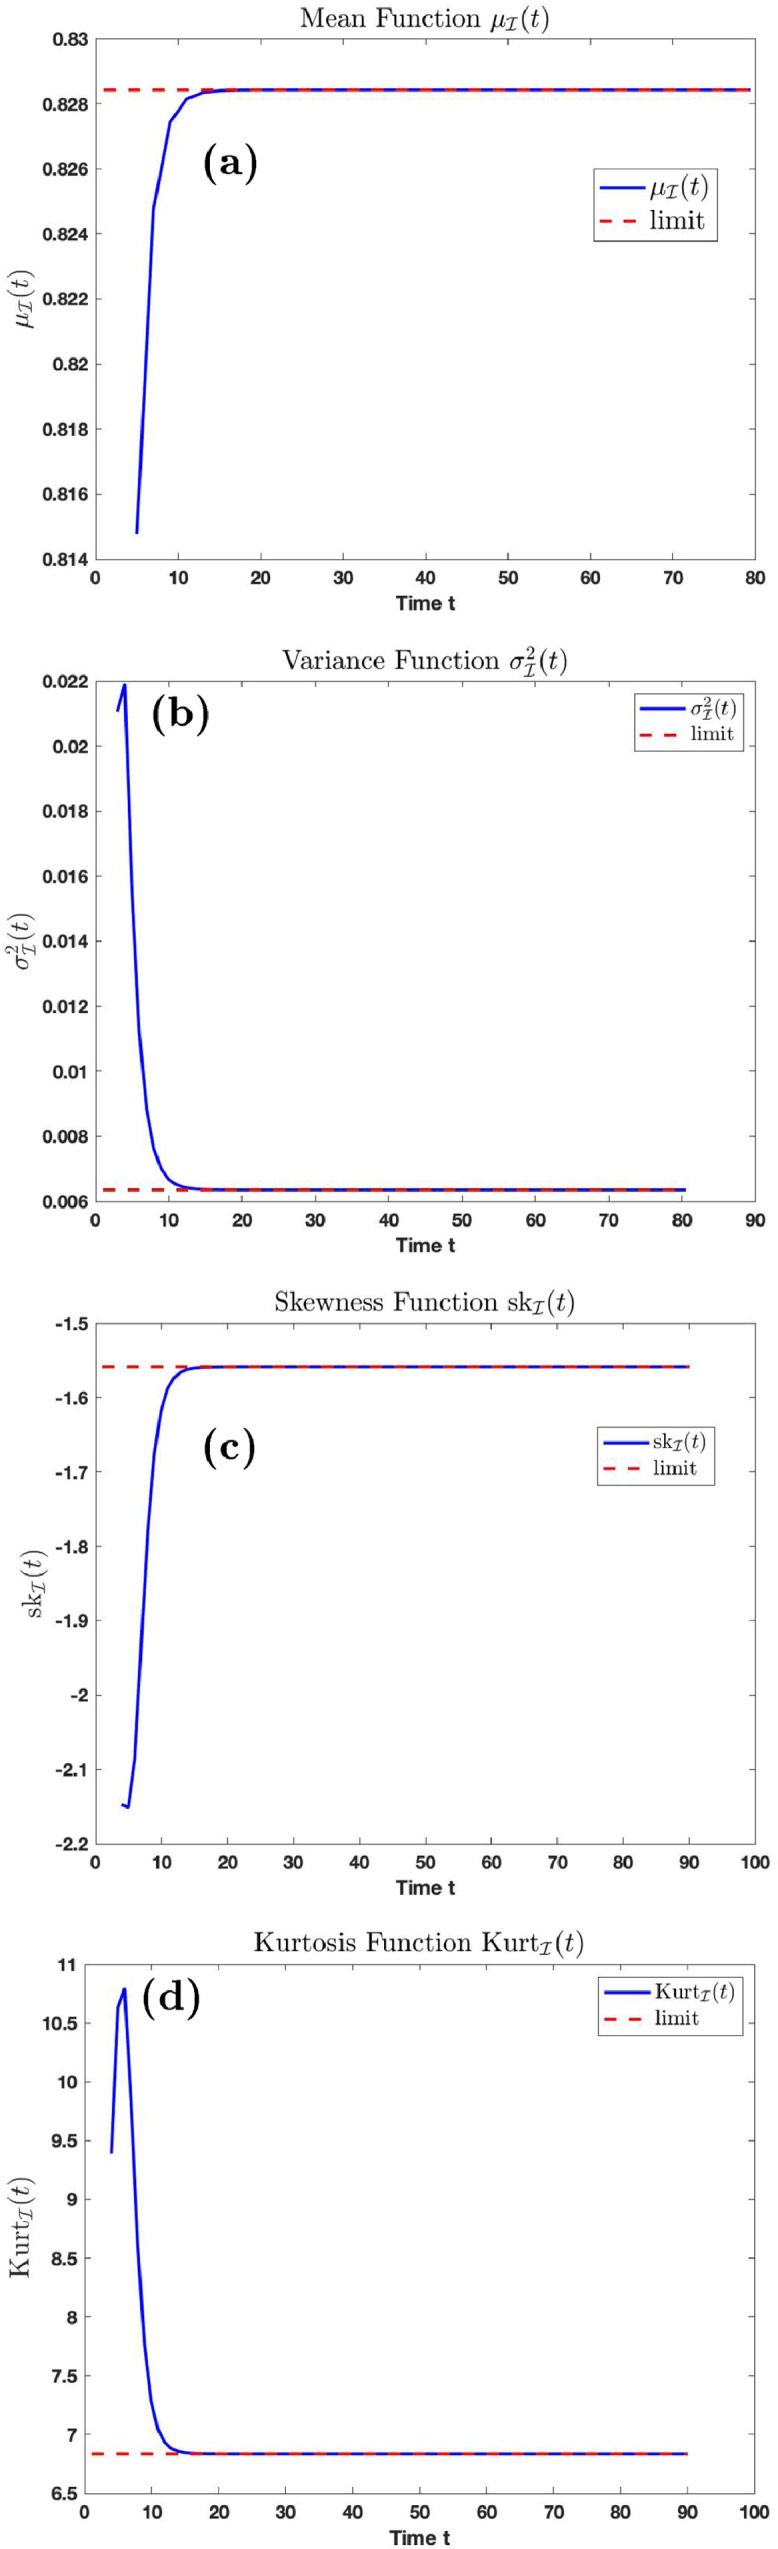
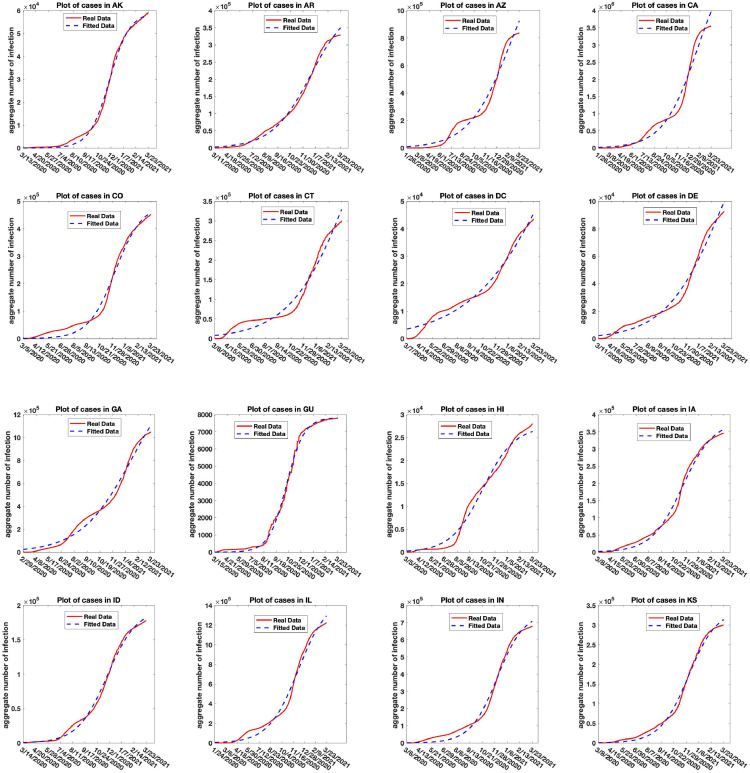
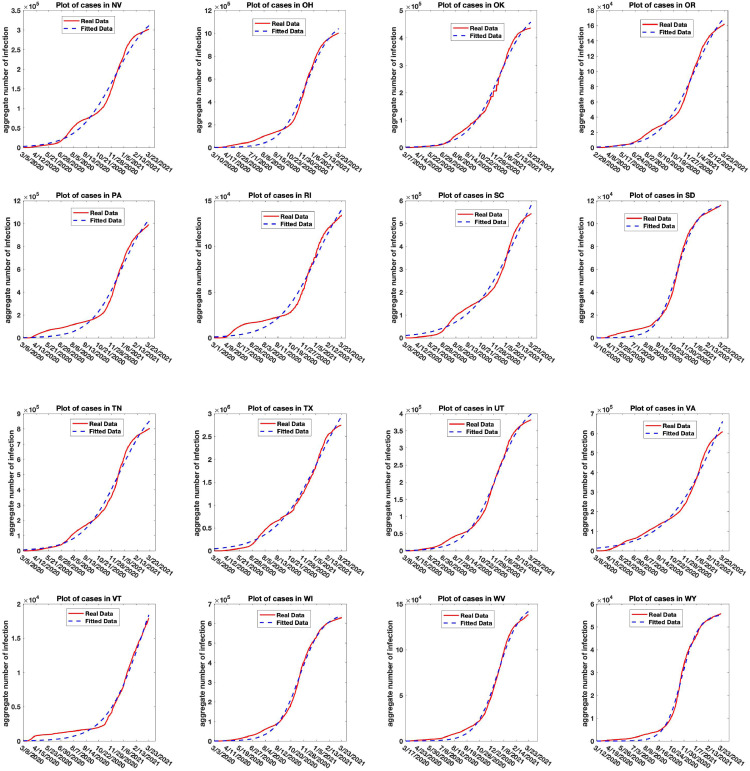
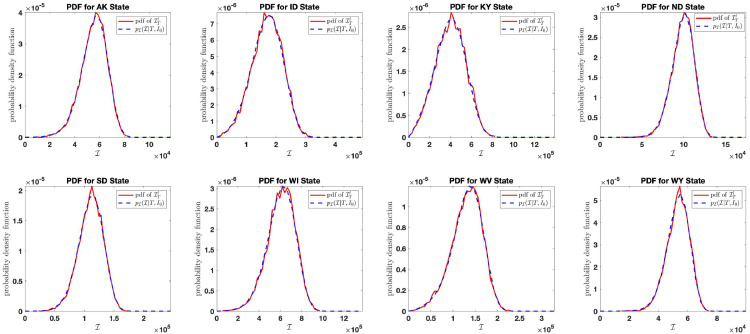
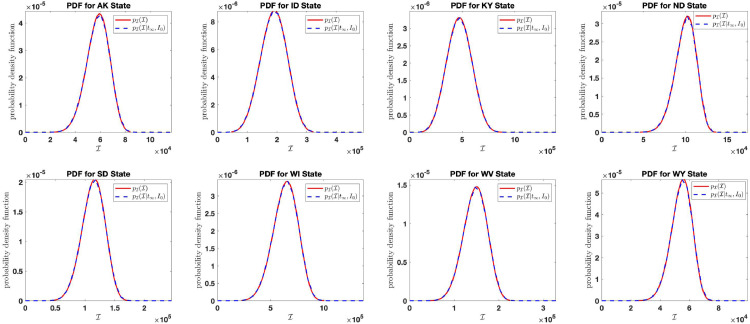
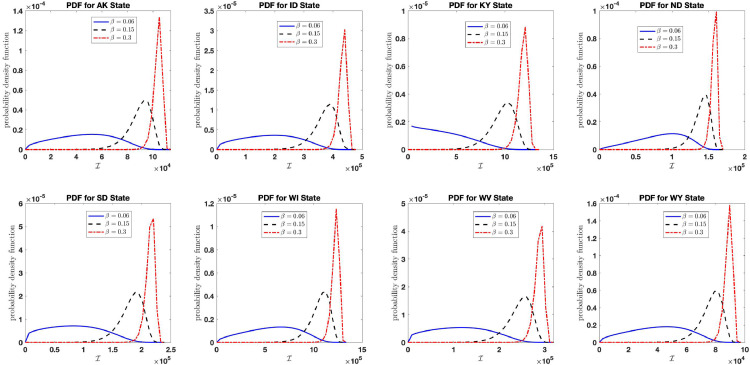
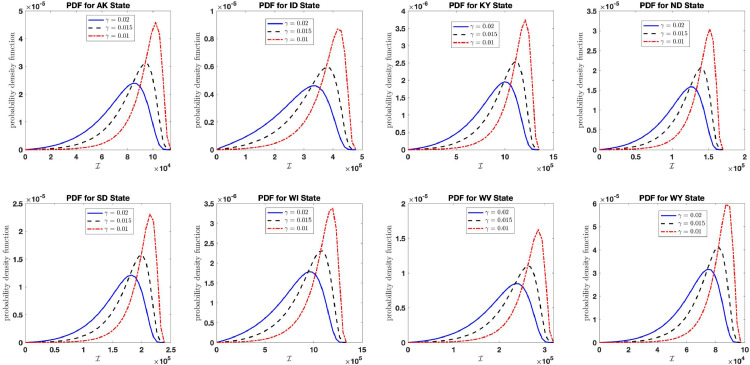
We derive the time-dependent probability distribution for the number of infected individuals at a given time in a stochastic Susceptible-Infected-Susceptible (SIS) epidemic model. The mean, variance, skewness, and kurtosis of the distribution are obtained as a function of time. We study the effect of noise intensity on the distribution and later derive and analyze the effect of changes in the transmission and recovery rates of the disease. Our analysis reveals that the time-dependent probability density function exists if the basic reproduction number is greater than one. It converges to the Dirac delta function on the long run (entirely concentrated on zero) as the basic reproduction number tends to one from above. The result is applied using published COVID-19 parameters and also applied to analyze the probability distribution of the aggregate number of COVID-19 cases in the United States for the period: January 22, 2020-March 23, 2021. Findings show that the distribution shifts concentration to the right until it concentrates entirely on the carrying infection capacity as the infection growth rate increases or the recovery rate reduces. The disease eradication and disease persistence thresholds are calculated.
Keywords: COVID-19; Hypergeometric; Infection; Kummer; Laguerre function; Probability density function; Stochastic differential equation; Whittaker function.
Conflict of interest statement
The author declares that there is no known competing financial interests or personal relationships that could have appeared to influence the work reported in this paper.
Figures

Similar articles
-
Closed-form probability distribution of number of infections at a given time in a stochastic SIS epidemic model.Heliyon. 2019 Sep 23;5(9):e02499. doi: 10.1016/j.heliyon.2019.e02499. eCollection 2019 Sep. Heliyon. 2019. PMID: 31687591 Free PMC article.
-
Estimation of epidemiological parameters for COVID-19 cases using a stochastic SEIRS epidemic model with vital dynamics.Results Phys. 2021 Sep;28:104664. doi: 10.1016/j.rinp.2021.104664. Epub 2021 Aug 11. Results Phys. 2021. PMID: 34395184 Free PMC article.
-
Stochastic Modeling and Forecasting of Covid-19 Deaths: Analysis for the Fifty States in the United States.Acta Biotheor. 2022 Sep 16;70(4):25. doi: 10.1007/s10441-022-09449-z. Acta Biotheor. 2022. PMID: 36112233 Free PMC article.
-
Stochastic persistence and stationary distribution in an SIS epidemic model with media coverage.Physica A. 2018 Feb 15;492:2220-2236. doi: 10.1016/j.physa.2017.11.137. Epub 2017 Dec 5. Physica A. 2018. PMID: 32288104 Free PMC article.
-
Differentiation and frequency distributions of body weights in plants and animals.Philos Trans R Soc Lond B Biol Sci. 1985 Aug 17;310(1142):1-75. doi: 10.1098/rstb.1985.0099. Philos Trans R Soc Lond B Biol Sci. 1985. PMID: 2864710 Review.
Cited by
-
Coefficient identification in a SIS fractional-order modelling of economic losses in the propagation of COVID-19.J Comput Sci. 2023 May;69:102007. doi: 10.1016/j.jocs.2023.102007. Epub 2023 Mar 30. J Comput Sci. 2023. PMID: 37041821 Free PMC article.
-
Reconstruction of incidence reporting rate for SARS-CoV-2 Delta variant of COVID-19 pandemic in the US.Infect Dis Model. 2023 Dec 9;9(1):70-83. doi: 10.1016/j.idm.2023.12.001. eCollection 2024 Mar. Infect Dis Model. 2023. PMID: 38125200 Free PMC article.
-
Stochasticity of disease spreading derived from the microscopic simulation approach for various physical contact networks.Appl Math Comput. 2022 Oct 15;431:127328. doi: 10.1016/j.amc.2022.127328. Epub 2022 Jun 21. Appl Math Comput. 2022. PMID: 35756537 Free PMC article.
References
-
- Arnold L. Wiley; New York: 1974. Stochastic differential equations: theory and applications.
-
- Baleanu D., Ghanbari B., Asad J.H., Jajarmi A., Pirouz H.M. Planar system-masses in an equilateral triangle: numerical study within fractional calculus. Comput Model Eng Sci. 2020;124(3):953–968. doi: 10.32604/cmes.2020.010236. - DOI
-
- Baleanu D., Jajarmi A., Sajjadi S.S., Asad J.H. The fractional features of a harmonic oscillator with position-dependent mass. Commun Theor Phys. 2020;72(5):055002.
-
- Bateman H. Vols. 1 & 2. McGraw-Hill; New York: 1953. Higher transcendental functions.
LinkOut - more resources
Full Text Sources
Other Literature Sources
