. 2021 May:79:94-106.
doi: 10.1016/j.trf.2021.04.006. Epub 2021 May 12.

Fatigue risk management based on self-reported fatigue: Expanding a biomathematical model of fatigue-related performance deficits to also predict subjective sleepiness

Affiliations

Fatigue risk management based on self-reported fatigue: Expanding a biomathematical model of fatigue-related performance deficits to also predict subjective sleepiness

Mark E McCauley et al. Transp Res Part F Traffic Psychol Behav. 2021 May.

Abstract

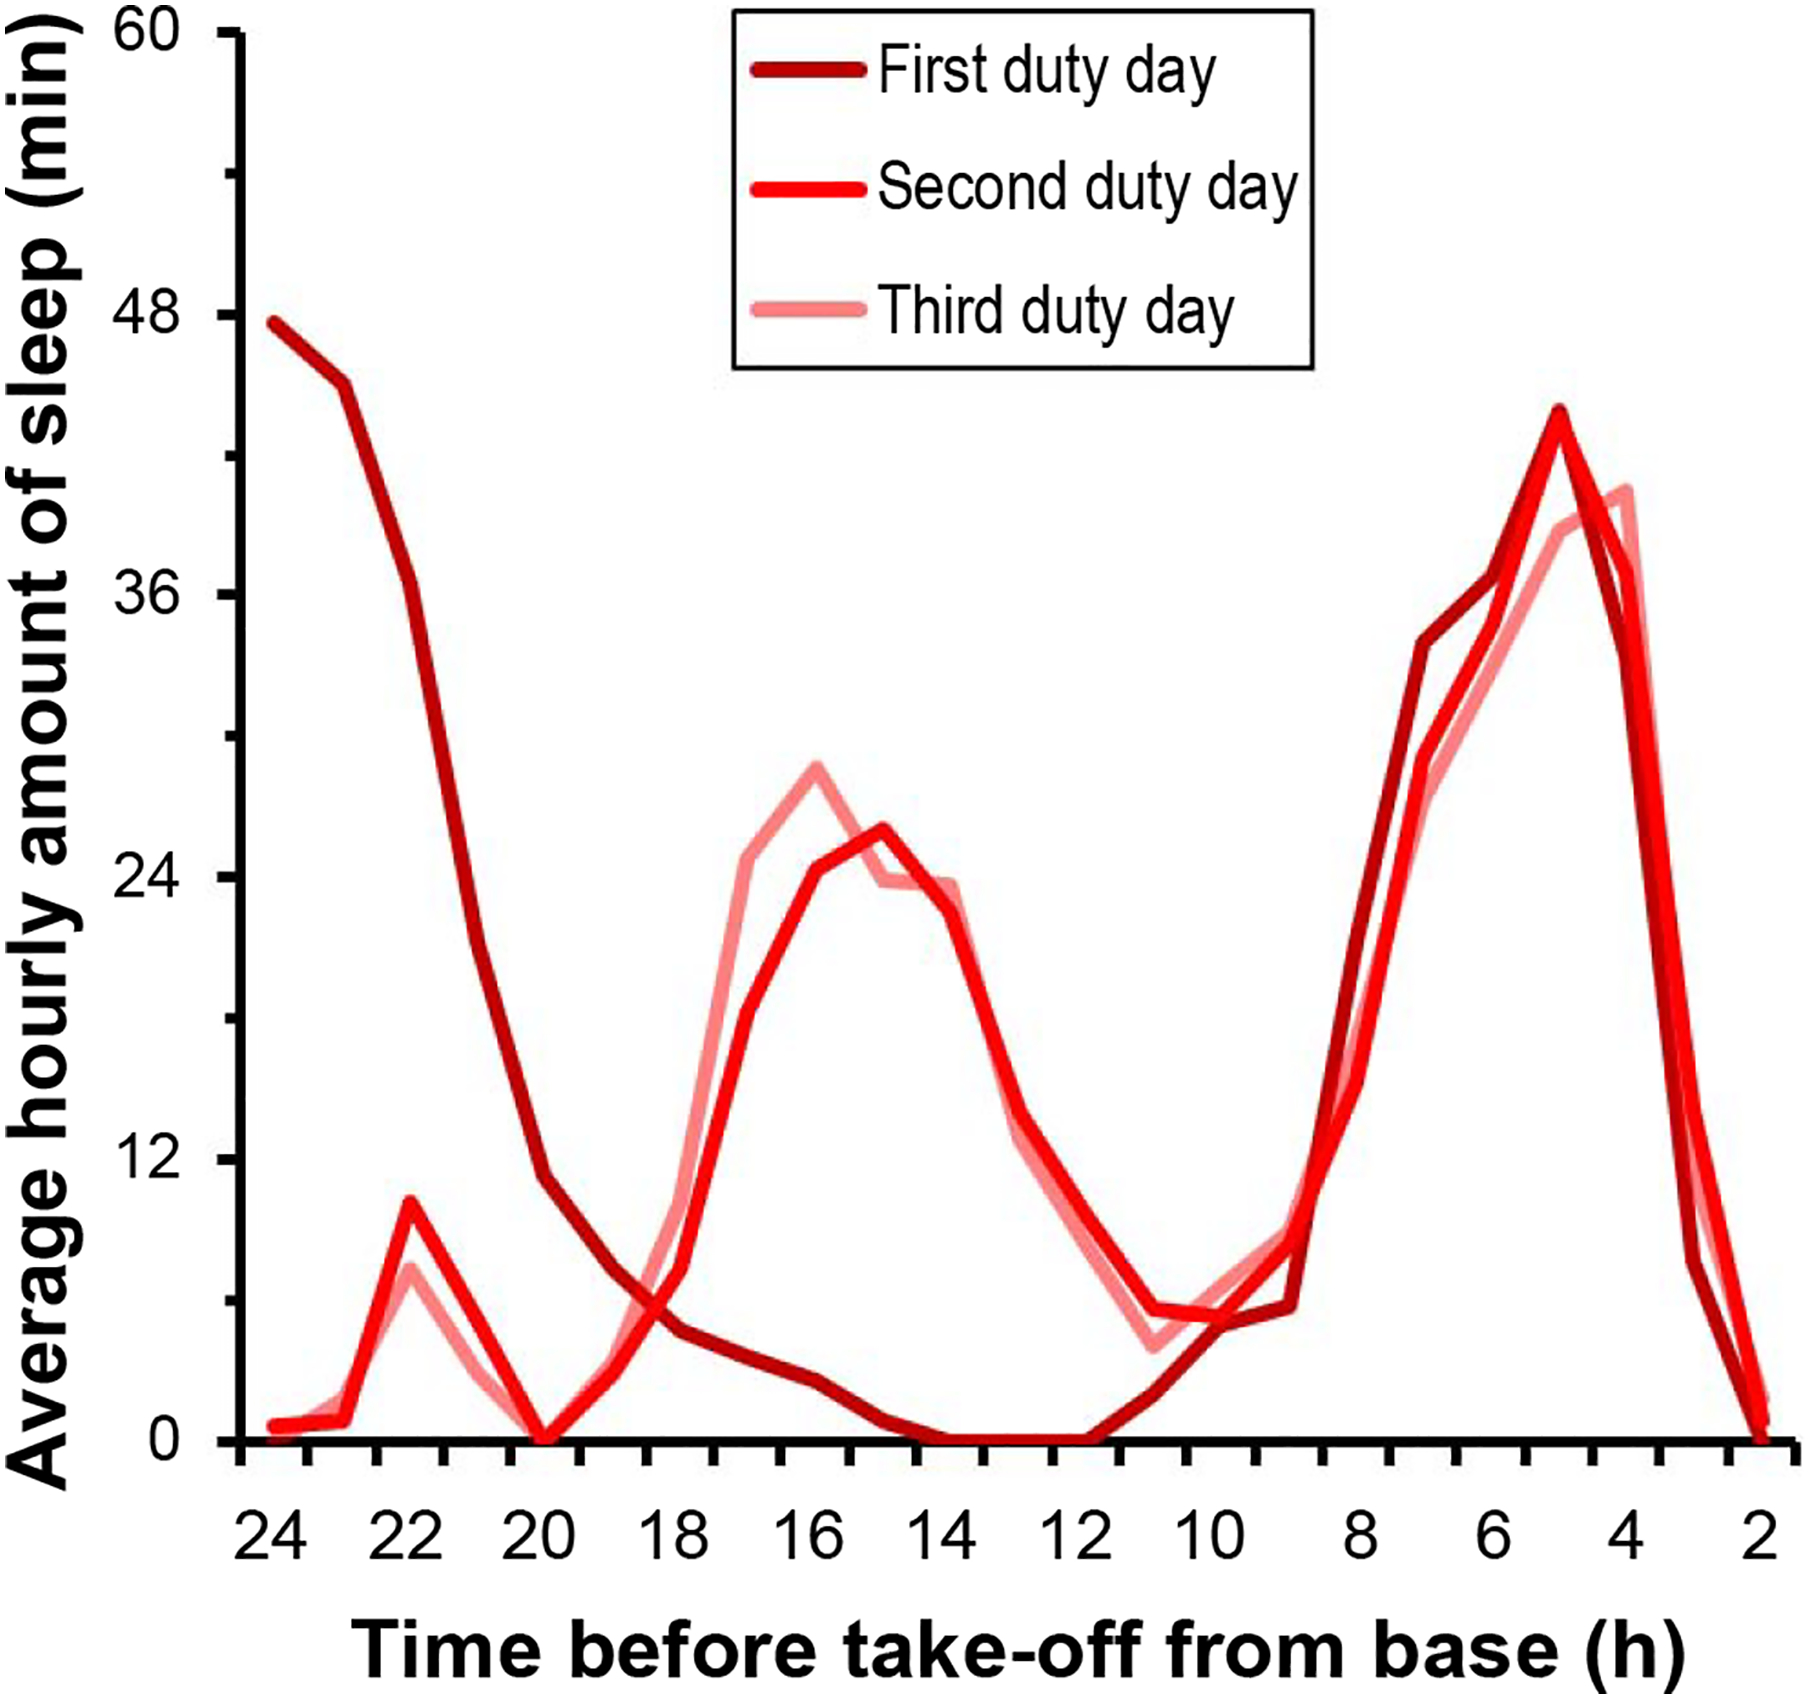
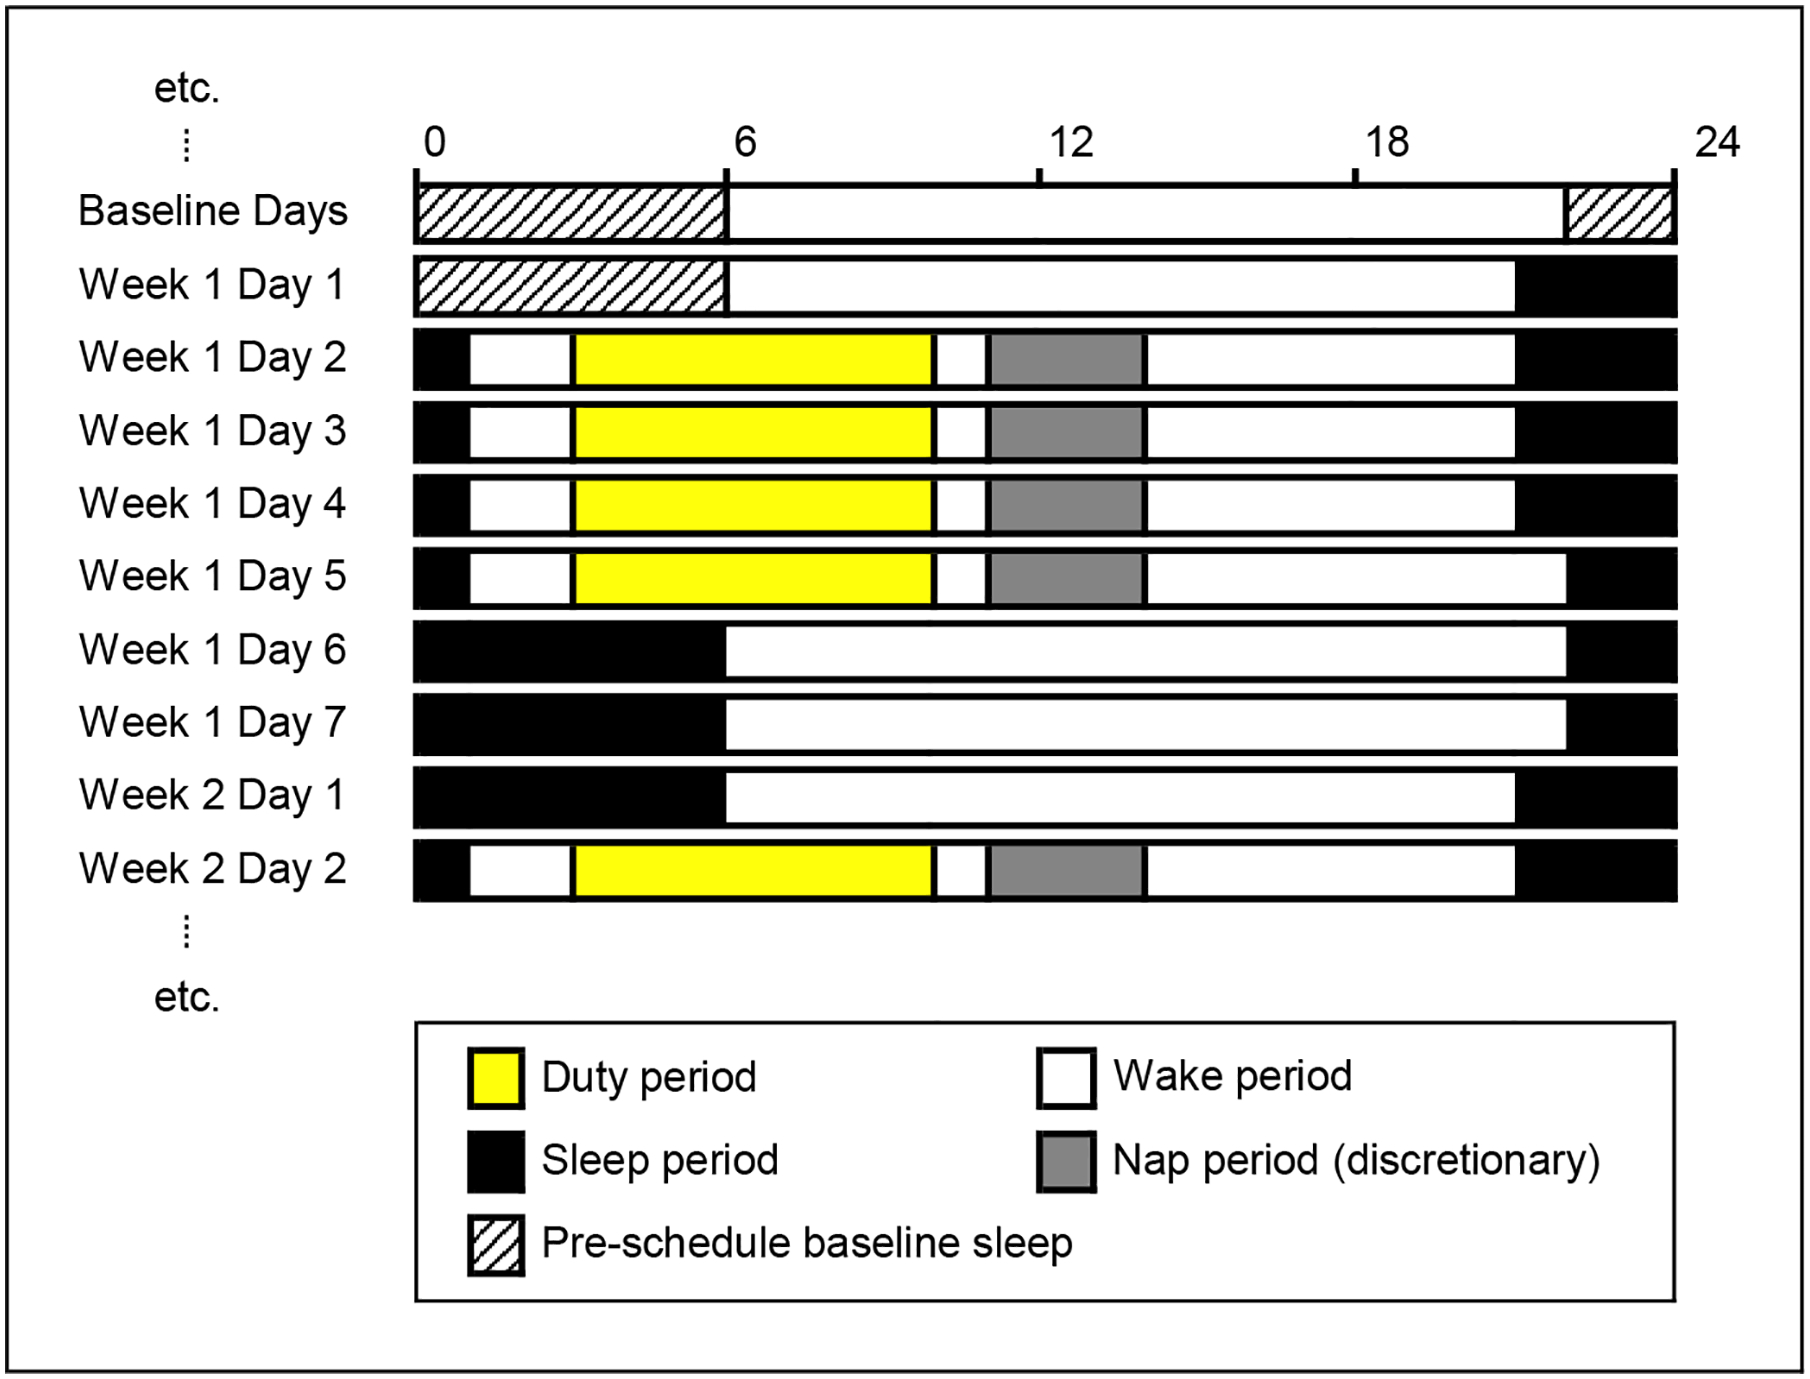
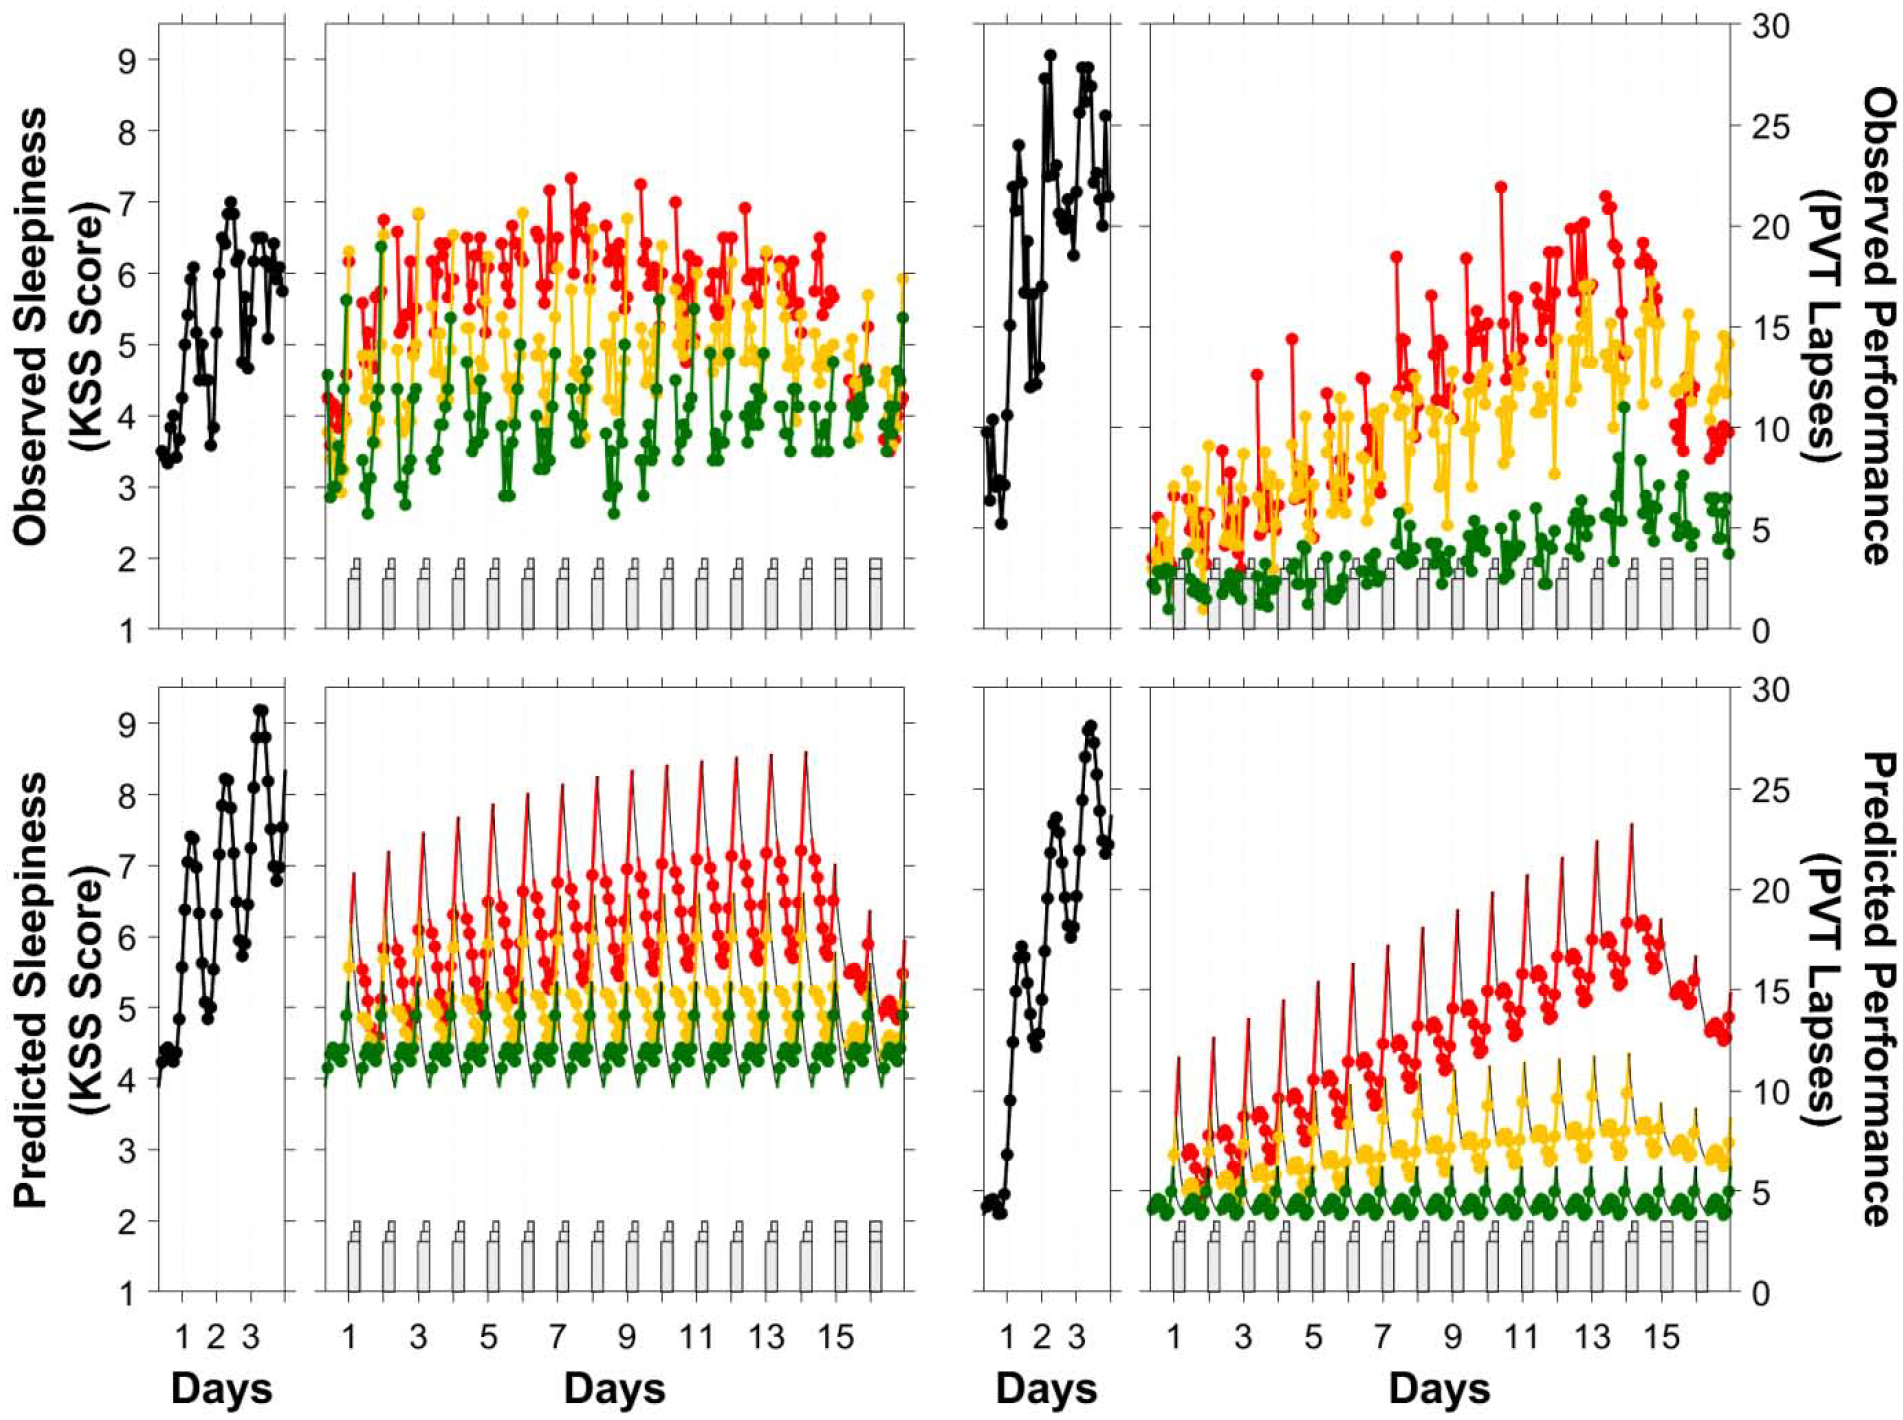
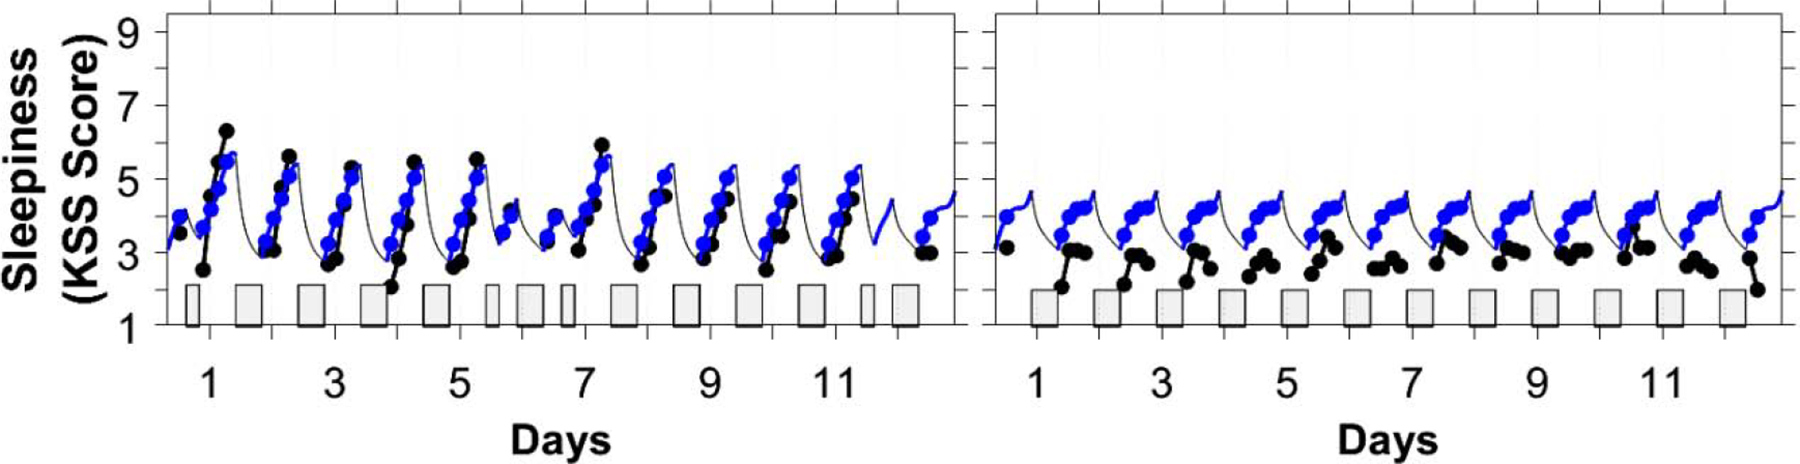
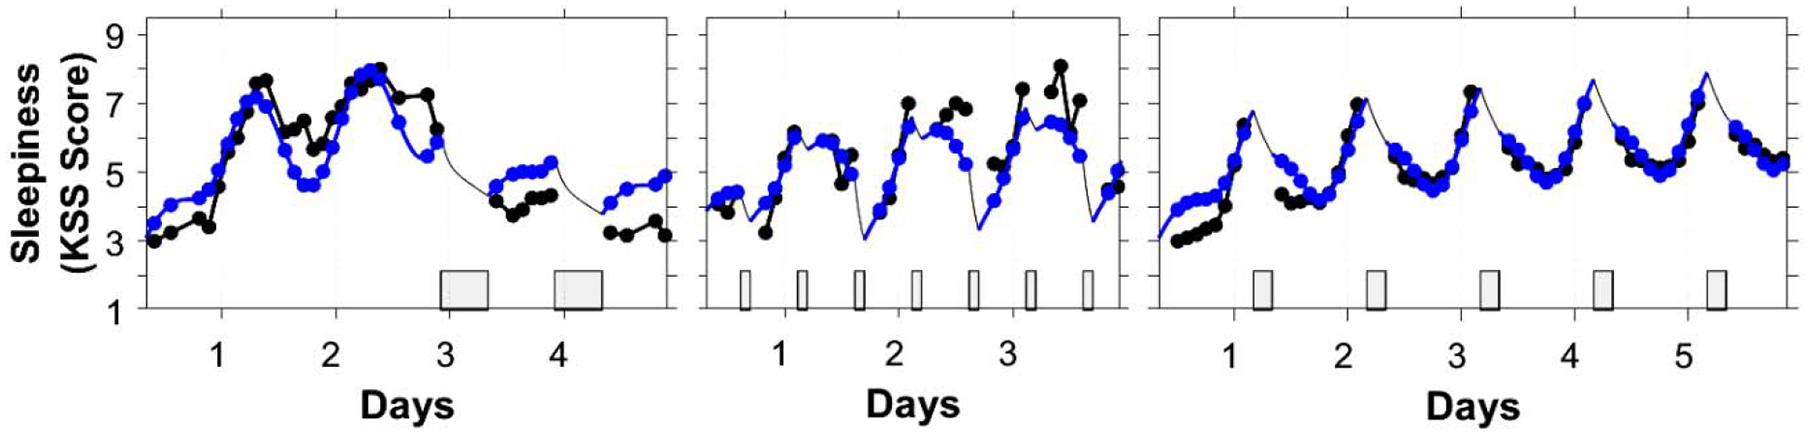
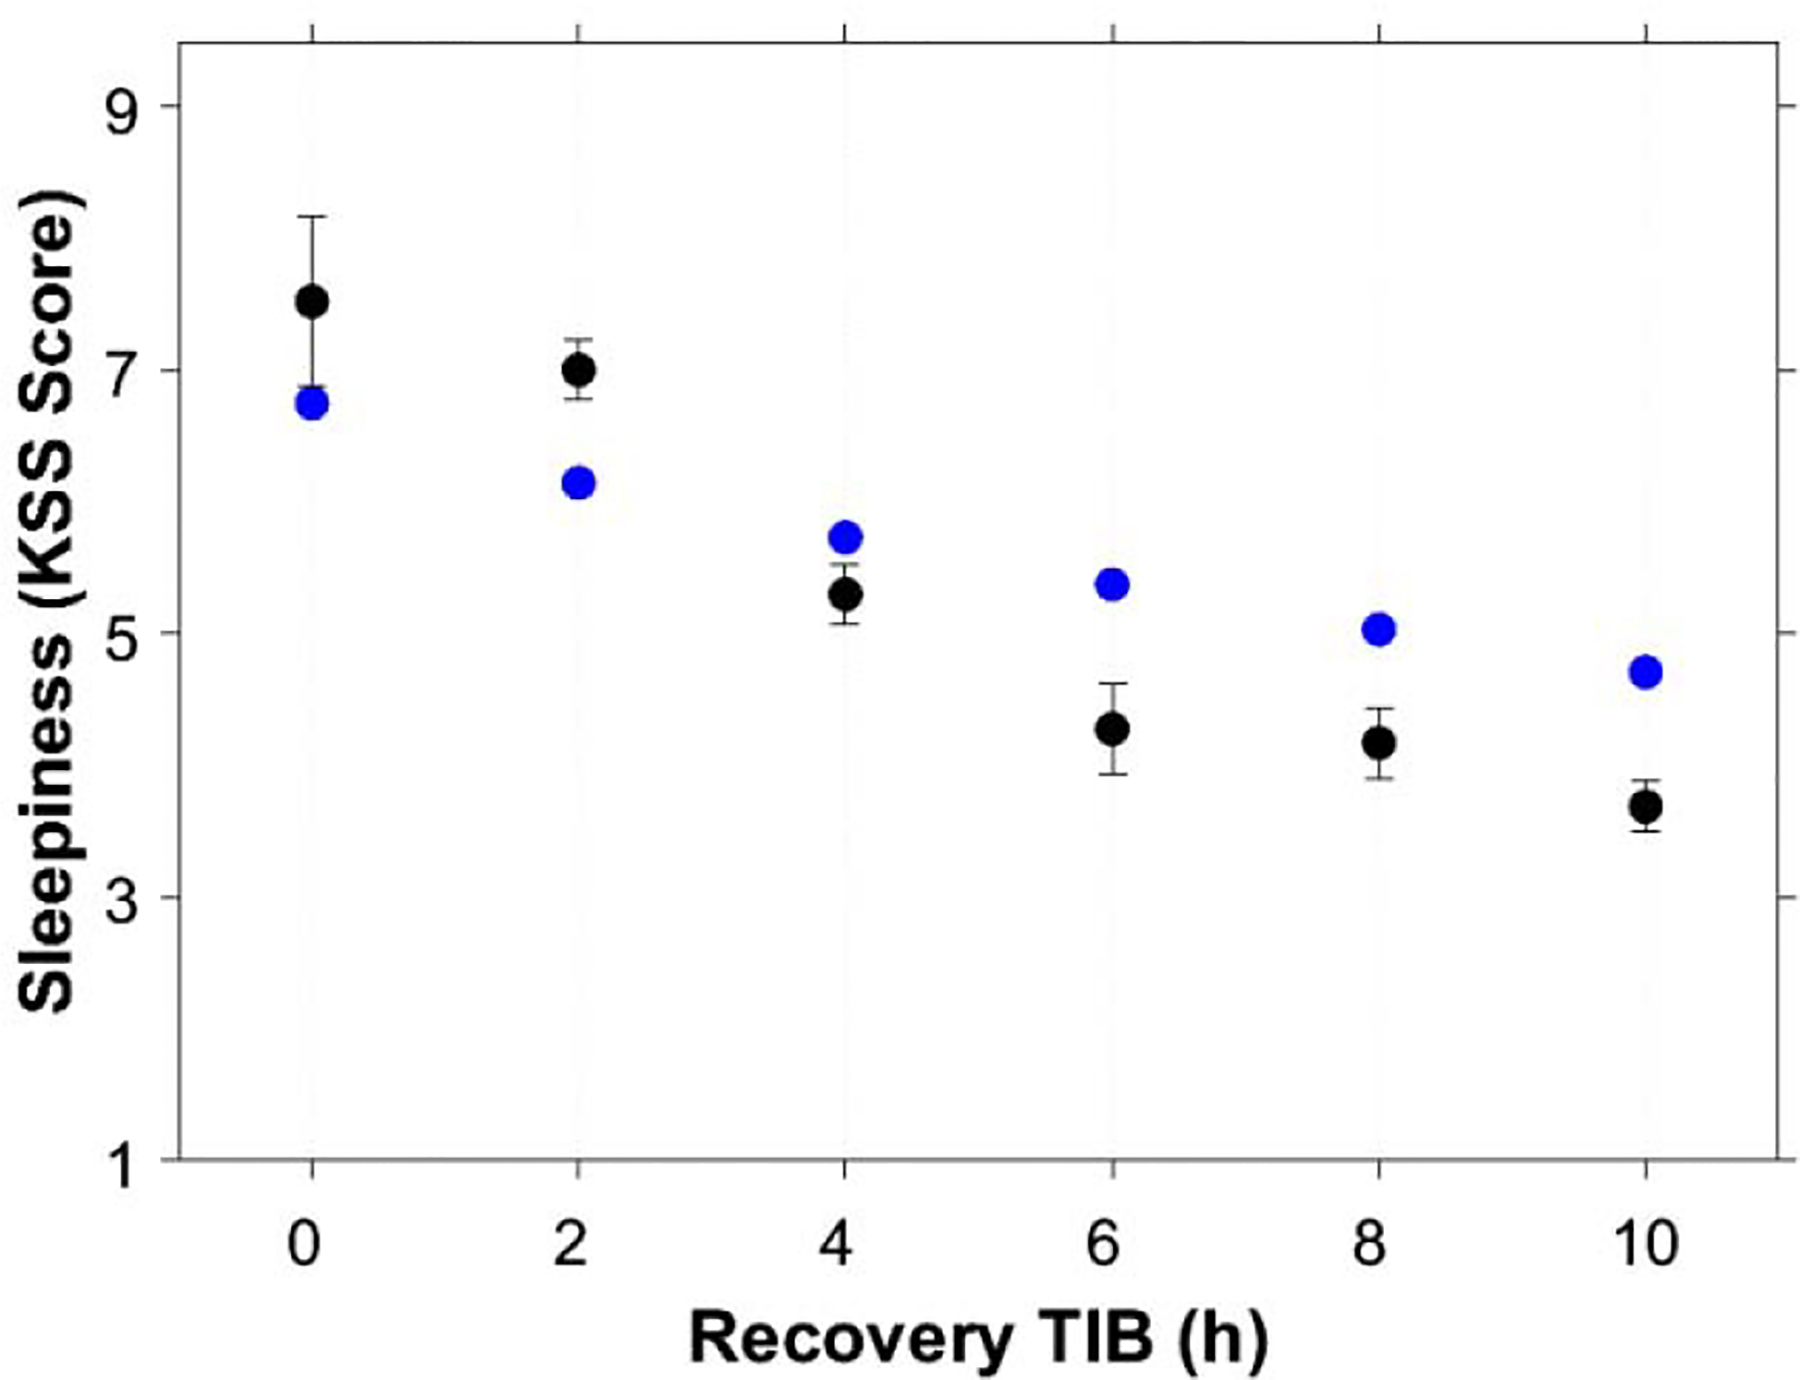
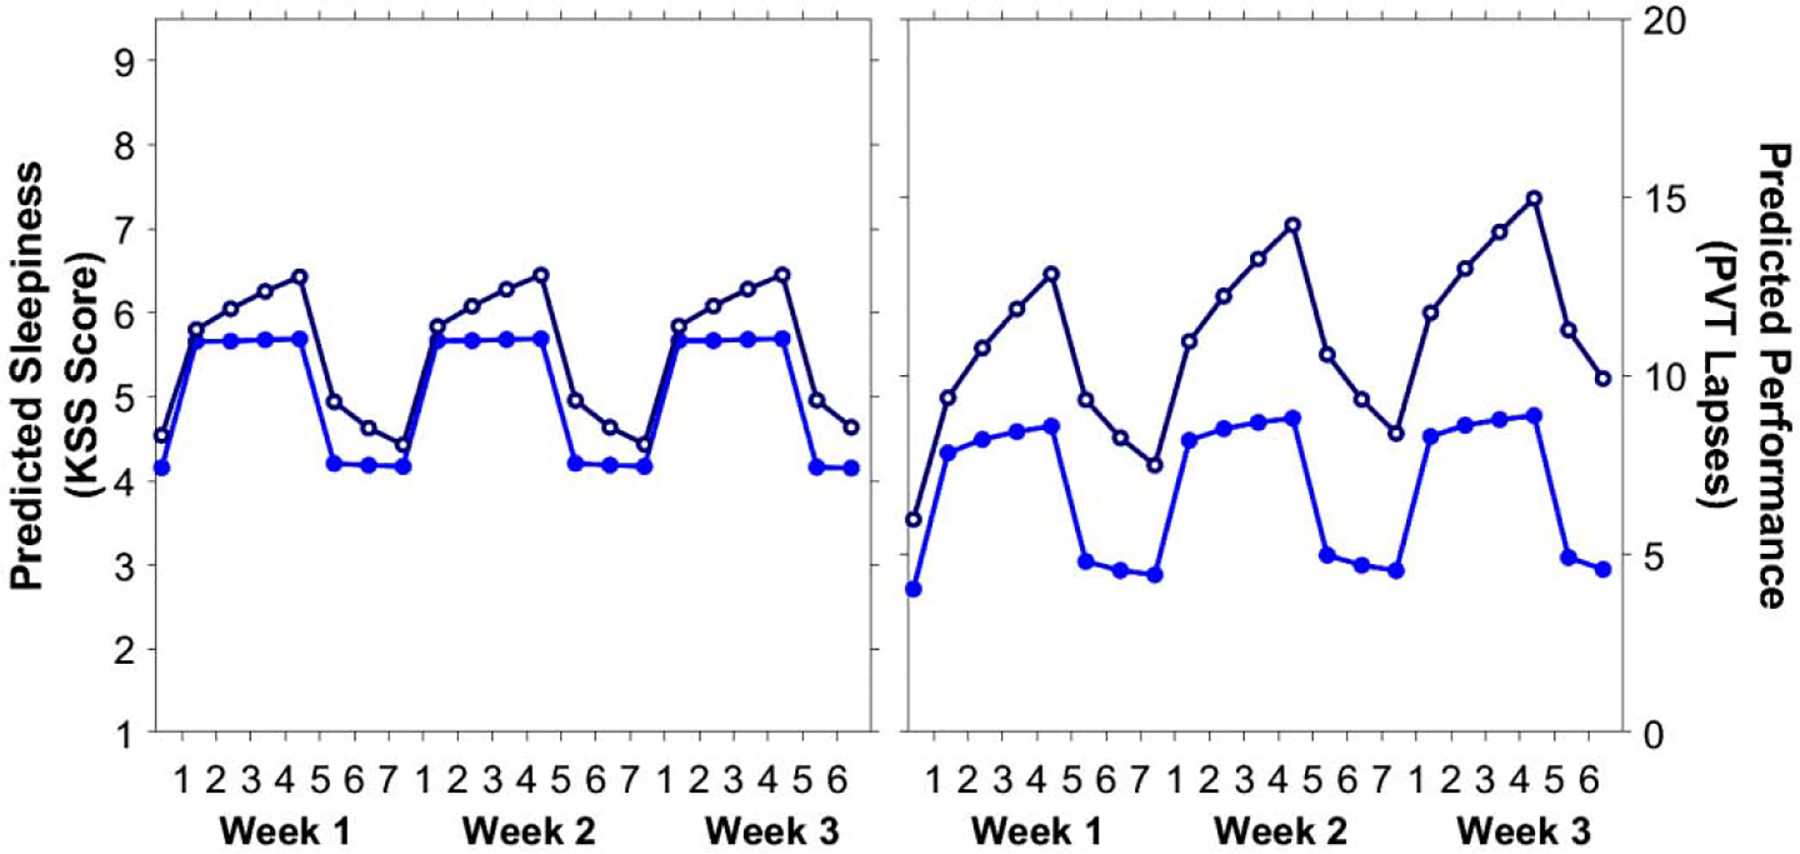
Biomathematical models of fatigue can be used to predict neurobehavioral deficits during sleep/wake or work/rest schedules. Current models make predictions for objective performance deficits and/or subjective sleepiness, but known differences in the temporal dynamics of objective versus subjective outcomes have not been addressed. We expanded a biomathematical model of fatigue previously developed to predict objective performance deficits as measured on the Psychomotor Vigilance Test (PVT) to also predict subjective sleepiness as self-reported on the Karolinska Sleepiness Scale (KSS). Four model parameters were re-estimated to capture the distinct dynamics of the KSS and account for the scale difference between KSS and PVT. Two separate ensembles of datasets - drawn from laboratory studies of sleep deprivation, sleep restriction, simulated night work, napping, and recovery sleep - were used for calibration and subsequent validation of the model for subjective sleepiness. The expanded model was found to exhibit high prediction accuracy for subjective sleepiness, while retaining high prediction accuracy for objective performance deficits. Application of the validated model to an example scenario based on cargo aviation operations revealed divergence between predictions for objective and subjective outcomes, with subjective sleepiness substantially underestimating accumulating objective impairment, which has important real-world implications. In safety-sensitive operations such as commercial aviation, where self-ratings of sleepiness are used as part of fatigue risk management, the systematic differences in the temporal dynamics of objective versus subjective measures of functional impairment point to a potentially significant risk evaluation sensitivity gap. The expanded biomathematical model of fatigue presented here provides a useful quantitative tool to bridge this previously unrecognized gap.

Keywords: Alertness; Fatigue and performance models; Fatigue risk management; Karolinska Sleepiness Scale; Psychomotor Vigilance Test; Self-rated sleepiness.


Figures

Fig. 1.
Fig. 1.
Average hourly sleep durations across the 24 h preceding take-off from base in pilots flying AM out-and-backs across three consecutive nighttime duty days.
Fig. 2.
Fig. 2.
Simulated duty and sleep schedule representing a stereotypical AM out-and-back pairing, used for application of the model.
Fig. 3.
Fig. 3.
Observations and predictions for total sleep deprivation and sustained sleep restriction in calibration study A1. Left side panels show group-average observations (top) and predictions (bottom) for sleepiness ratings on the KSS; right side panels show the same for number of lapses on the PVT for comparison. Black curves show results for 88 h of total sleep deprivation. Red, yellow, and green curves show results for 14 days of sleep restriction to 4 h, 6 h, and 8 h daily, respectively, followed by two 8-h recovery sleep opportunities. Thin curves in the bottom panels represent the continuous model predictions, with gray curve pieces indicating (nominal) predictions during sleep opportunities. The condition-specific sleep opportunities are denoted by the gray bars. Days are numbered relative to the last baseline day, which is day 0. Tick marks on the abscissas indicate midnight. Right side panels are redrawn from McCauley et al. (2013) with permission.
Fig. 4.
Fig. 4.
Observations and predictions for simulated night and day shift schedules in calibration study A2. The panels shows group-average observations (black) and predictions (blue) for sleepiness ratings on the KSS in the night shift schedule (left) and the day shift schedule (right). Blue and gray curve pieces represent the continuous model predictions, with gray indicating (nominal) predictions during sleep opportunities. The sleep opportunities are denoted by the gray bars. Days are numbered relative to the last baseline day, which is day 0. Tick marks on the abscissas indicate midnight.
Fig. 5.
Fig. 5.
Observations and predictions for validation studies B1–B3. The panels shows group-average observations (black) and predictions (blue) for sleepiness ratings on the KSS across total sleep deprivation and recovery days (left), extended wakefulness with daytime and nighttime napping (middle), and sustained sleep restriction (right). Blue and gray curve pieces represent the continuous model predictions, with gray indicating (nominal) predictions during sleep opportunities. The sleep opportunities are denoted by the gray bars. Days are numbered relative to the last baseline day, which is day 0. Tick marks on the abscissas indicate midnight.
Fig. 6.
Fig. 6.
Predictions for a dose-response sleep opportunity following five days of sustained sleep restriction in validation study B3. The abscissa denotes the sleep dose (time in bed, TIB) on the day after five days of sleep restriction to 4 h per day. The ordinate denotes sleepiness ratings on the KSS averaged across hours 2–14 of subsequent wakefulness. The graph shows group-average observations and standard errors (black) and corresponding predictions (blue).
Fig. 7.
Fig. 7.
One- and two-dimensional marginal probability distributions for the four free parameters of the KSS model. As shown in Table 2, αw is the homeostatic build-up rate during wakefulness, αs is the homeostatic dissipation rate during sleep, Wc is the critical threshold for the bifurcation, and ξ is the asymptotic amplitude of circadian modulation. The red dots are pairs of parameter estimates from the MCMC chain. The blue curves over the clouds of red dots represent contours of the approximate 50% and 95% reliability regions. The black curves anchored on the axes are the one-dimensional marginal distributions. Tick marks are set at the mean and two standard errors from the mean. Numbers in bold are correlations between pairs of parameter estimates as derived from the MCMC chain.
Fig. 8.
Fig. 8.
Day-by-day predictions of the expanded model across three cycles of a simulated AM out-and-back schedule in cargo flight operations. The graphs show predicted subjective sleepiness scores on the KSS (left) and objective performance (lapses) on the PVT (right) at 10:00 (duty end time) each day of the schedule shown in Fig. 2 – assuming that for the catch-up naps considered to be discretionary, either none (dark blue, open circles) or all (lighter blue, closed circles) would be taken.

Similar articles

Cited by

References

    1. Ahlström C, Anund A, Fors C, Åkerstedt T. The effect of daylight versus darkness on driver sleepiness: a driving simulator study. J Sleep Res. 2018; 27:e12642. - PubMed
    1. Åkerstedt T, Anund A, Axelsson J, Kecklund G. Subjective sleepiness is a sensitive indicator of insufficient sleep and impaired waking function. J Sleep Res. 2014; 23:242–254. - PubMed
    1. Åkerstedt T, Gillberg M. Subjective and objective sleepiness in the active individual. Int J Neurosci. 1990; 52:29–37. - PubMed
    1. Banks S, Van Dongen HPA, Maislin G, Dinges DF. Neurobehavioral dynamics following chronic sleep restriction: dose-response effects of one night for recovery. Sleep. 2010; 33:1013–1026. - PMC - PubMed
    1. Belenky G, Wesensten NJ, Thorne DR, Thomas ML, Sing HC, Redmond DP, Russo MB, Balkin TJ. Patterns of performance degradation and restoration during sleep restriction and subsequent recovery: a sleep dose-response study. J Sleep Res. 2003; 12:1–12. - PubMed

LinkOut - more resources