. 2021 Apr 12;17(7):1644-1659.
doi: 10.7150/ijbs.58612. eCollection 2021.

Wnt/β-catenin Signaling Inhibitors suppress the Tumor-initiating properties of a CD44+CD133+ subpopulation of Caco-2 cells

Affiliations

Wnt/β-catenin Signaling Inhibitors suppress the Tumor-initiating properties of a CD44+CD133+ subpopulation of Caco-2 cells

Junghoon Kim et al. Int J Biol Sci. .

Abstract

Tumor-initiating cells or cancer stem cells are a subset of cancer cells that have tumorigenic potential in human cancer. Although several markers have been proposed to distinguish tumor-initiating cells from colorectal cancer cells, little is known about how this subpopulation contributes to tumorigenesis. Here, we characterized a tumor-initiating cell subpopulation from Caco-2 colorectal cancer cells. Based on the findings that Caco-2 cell subpopulations express different cell surface markers, we were able to discriminate three main fractions, CD44-CD133-, CD44-CD133+, and CD44+CD133+ subsets, and characterized their biochemical and tumorigenic properties. Our results show that CD44+CD133+ cells possessed an unusual capacity to proliferate and could form tumors when transplanted into NSG mice. Additionally, primary tumors grown from CD44+CD133+ Caco-2 cells contained mixed populations of CD44+CD133+ and non-CD44+CD133+ Caco-2 cells, indicating that the full phenotypic heterogeneity of the parental Caco-2 cells was re-created. Notably, only the CD44+CD133+ subset of Caco-2-derived primary tumors had tumorigenic potential in NSG mice, and the tumor growth of CD44+CD133+ cells was faster in secondary xenografts than in primary transplants. Gene expression analysis revealed that the Wnt/β-catenin pathway was over-activated in CD44+CD133+ cells, and the growth and tumorigenic potential of this subpopulation were significantly suppressed by small-molecule Wnt/β-catenin signaling inhibitors. Our findings suggest that the CD44+CD133+ subpopulation from Caco-2 cells was highly enriched in tumorigenic cells and will be useful for investigating the mechanisms leading to human colorectal cancer development.

Keywords: CD133; CD44; Caco-2; IWR-1; Tumor-initiating cells; Tumorigenic potential; Wnt/β-catenin signaling inhibitor; XAV939.


Conflict of interest statement

Competing Interests: The authors have declared that no competing interest exists.

Figures
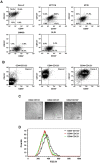
Figure 1
Figure 1
Isolation and analysis of Caco-2 subpopulations expressing CD44 or/and CD133. (A) Differences in the expression of CD44 and CD133 surface markers between colorectal cancer cells. Five colorectal cancer cell lines (Caco-2, HCT116, HT29, SW480, and DLD1) were cultured in MEM/EBSS (minimal essential medium with Earle's balanced salt solution) supplemented with 10% heat-inactivated FBS (fetal bovine serum), stained with specific monoclonal antibodies to CD44 (FITC-conjugated) and CD133 (PE-conjugated), and analyzed by flow cytometry. The results are expressed as the percentage of CD44-CD133-, CD44+CD133-, CD44-CD133+, or CD44+CD133+ cells in the total cell population. (B) Flow cytometric analyses of CD44-CD133-, CD44-CD133+, and CD44+CD133+ Caco-2 fractions to evaluate the efficiency of isolation. After FACS isolation, the percentage of CD44-CD133-, CD44-CD133+, and CD44+CD133+ cells within the total population increased to 90.8% ± 4.8%, 98.1% ± 1.1%, and 88.6% ± 4.0%, respectively. (C) Morphological characteristics of CD44-CD133-, CD44-CD133+, and CD44+CD133+ Caco-2 cells. CD44-CD133-, CD44-CD133+, and CD44+CD133+ cells (5 × 10³) were plated into 35 mm dishes, cultured for 24 hours, and examined using a confocal laser scanning microscope (LSM5 Pascal, Carl Zeiss Co., Ltd.; 200× original magnification). Scale bars, 100 μm. (D) Cell size distribution of CD44-CD133-, CD44-CD133+, and CD44+CD133+ Caco-2 cells. The x-axis of the plot represents forward scatter, indicating cell size, and the y-axis represents side scatter, indicating cell number. Curves denote CD44-CD133- (green line), CD44-CD133+ (red line), and CD44+CD133+ (black line) cells.
Figure 2
Figure 2
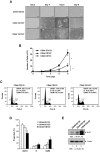
Growth characteristics and cell cycle analysis of CD44-CD133-, CD44-CD133+, and CD44+CD133+ Caco-2 cells. (A) Colony morphology of CD44-CD133-, CD44-CD133+, and CD44+CD133+ Caco-2 cells. CD44-CD133-, CD44-CD133+, and CD44+CD133+ cells (1 × 10⁴) were plated and cultured for 8 days. Cells were monitored at 2 day intervals under an inverted phase-contrast microscope (IX71; Olympus). Scale bars, 100 μm. (B) Growth curve of CD44-CD133-, CD44-CD133+, and CD44+CD133+ Caco-2 cells. Cells were seeded at 1 × 10⁴ cells per 35 mm dish and counted at 2 day intervals using a hemocytometer for a total of 8 days. Statistical significance was determined using unpaired Student's t-tests. **p < 0.01 versus control group. (C) Cell cycle distribution of CD44-CD133-, CD44-CD133+, and CD44+CD133+ Caco-2 cells. The DNA content of CD44-CD133- (left panel), CD44-CD133+ (middle panel), and CD44+CD133+ (right panel) cells was measured by fluorescence after propidium iodide staining. M1, M2, and M3 represent the G0/G1, S, and G2/M phases, respectively. Values represent the mean ± SD for three independent experiments. (D) Proportion of CD44-CD133-, CD44-CD133+, and CD44+CD133+ Caco-2 cells at G0/G1, S, and G2/M phase. The percentage of cells at G0/G1, S, and G2/M are shown after flow cytometry. Values represent the mean ± SD for three independent experiments. (E) Upregulation of Ki-67 expression in CD44+CD133+ Caco-2 cells. The protein expression level of Ki-67 in CD44-CD133-, CD44-CD133+, and CD44+CD133+ cells were assessed by western blotting (WB) (upper panel). After resolving the extracts by SDS-PAGE, the samples were analyzed by immunoblotting using anti-Ki-67 (SP6; Abcam) or anti-β-Actin (AbC-2002; AbClon Inc.) antibodies (Ab). β-Actin served as a loading control. Three independent experiments gave similar results.
Figure 3
Figure 3
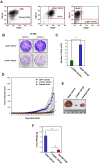
Evaluation of the tumorigenicity of the CD44+CD133+ Caco-2 cells in vivo. (A) Cytofluorimetric cell sorting of double-labeled parental (left panel), CD44+CD133+-positive (middle panel), and CD44+CD133+-negative (ΔCD44+CD133+, right panel) Caco-2 cells. Sorted cells were re-analyzed shortly after the initial sorting. Cell purities are presented as the percentage of selected cells in the sort fraction. (B) Analysis of serum requirements of Caco-2 cells expressing CD44 and CD133. CD44+CD133+ and ΔCD44+CD133+ cells were cultured in MEM/EBSS supplemented with 2% (v/v) FBS for 9 days and then stained with crystal violet to visualize cells. (C) Effect of serum starvation on CD44+CD133+ and ΔCD44+CD133+ Caco-2 cell proliferation. After serum starvation, total cell numbers were determined by counting at day 9. CD44+CD133+ (blue bar) and ΔCD44+CD133+ cells (green bar) were maintained by MEM/EBSS supplemented with 2% (v/v) FBS. Each bar represents the mean ± SD of three independent experiments. An unpaired Student's t-test was used to determine statistical significance. **p < 0.01 versus control group. (D) Growth of mouse xenografts generated after subcutaneous injection of unsorted (parental) or purified (CD44+CD133+ or ΔCD44+CD133+) Caco-2 cells. The parental, CD44+CD133+, or ΔCD44+CD133+ cells were sorted by flow cytometry and then subcutaneously injected into 8-week-old NSG mice (n = 7). Tumor development was observed at 2 day intervals for a total of 76 days. The volume of palpable tumors derived from parental (red triangles), CD44+CD133+ (blue circles), or ΔCD44+CD133+ (green squares) cells was measured and plotted as mean increases ± SD. An unpaired Student's t-test was used to determine statistical significance. *p < 0.05 and **p < 0.01 versus control group. (E) Photograph of tumor xenografts generated after subcutaneous injection of parental, CD44+CD133+, or ΔCD44+CD133+ Caco-2 cells. The representative tumor photograph was taken 76 days after injection. (F) Mass of tumors from NSG mice injected with parental, CD44+CD133+, or ΔCD44+CD133+ Caco-2 cells. Tumor mass in individual NSG mice was measured at 76 days after subcutaneous injection (n = 7) and is plotted as mean increases ± SD. An unpaired Student's t-test was used to determine statistical significance. **p < 0.01 versus control group.
Figure 4
Figure 4
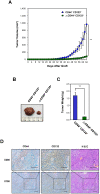
Evaluation of the tumorigenicity of CD44+CD133+ cells from primary xenografts. (A) Growth of mouse secondary xenografts generated after subcutaneous injection of CD44+CD133+ or ΔCD44+CD133+ cells from primary tumors. CD44+CD133+ or ΔCD44+CD133+ cells from primary xenografts were injected subcutaneously into NSG mice (n = 4). Tumor development was observed at 2 day intervals for a total of 64 days. The volume of palpable tumors derived from CD44+CD133+ (blue circles) or ΔCD44+CD133+ (green squares) cells is plotted as mean ± SD. An unpaired Student's t-test was used to determine statistical significance. **p < 0.01 versus control group. (B) Photograph of secondary xenografts generated after subcutaneous injection of CD44+CD133+ or ΔCD44+CD133+ cells from primary xenograft. Tumor photograph was taken 64 days after cell injection. (C) Mass of tumors from NSG mice subcutaneously injected with CD44+CD133+ or ΔCD44+CD133+ cells from primary xenografts. Tumor mass in individual NSG mice was estimated at 64 days after cell injection (n = 4) and is displayed as mean ± SD. An unpaired Student's t-test was used to determine statistical significance. **p < 0.01 versus control group. (D) Expression of CD44 and CD133 in secondary xenograft. Immunohistochemical staining of secondary xenograft demonstrated that CD44 and CD133 expression was preserved during secondary tumor development. Images are 100× (bottom panels) or 200× (top panels) magnification. Scale bars indicate 100 μm.
Figure 5
Figure 5
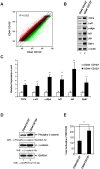
Activation of the Wnt/β-catenin signaling pathway in CD44+CD133+ Caco-2 cells. (A) CD44-CD133+ and CD44+CD133+ Caco-2 cells have distinct gene expression profiles. Scatter plot analysis of the gene expression pattern in CD44+CD133+ and CD44-CD133+ cells revealed distinct gene expression profiles between two subpopulations. Two-fold differences are defined above and below the lines parallel to the diagonal line. (B) RT-PCR analysis of genes involved in the canonical Wnt/β-catenin pathway in CD44-CD133+ and CD44+CD133+ Caco-2 cells. RT-PCR analysis of TCF4, Lef1, c-Myb, Id3, AR, and Dkk1 mRNA expression was performed in CD44-CD133+ and CD44+CD133+ Caco-2 cells. β-actin was used for normalization. Following RT-PCR, each product was analyzed on agarose gels and stained with ethidium bromide. (C) TaqMan qPCR of Wnt/β-catenin pathway genes. Quantitative real-time PCR reactions were performed to analyze the relative expression of TCF4, Lef1, c-Myb, Id3, AR, and Dkk1 in CD44-CD133+ and CD44+CD133+ cells, and normalized to that of β-actin. Representative mean ± SD from an assay performed in triplicate; two additional experiments gave similar results. An unpaired Student's t-test was used to determine statistical significance. **p < 0.01 versus control group. (D) β-catenin activation in CD44+CD133+ Caco-2 cells. Total cell extracts were prepared from CD44-CD133+ and CD44+CD133+ cells. The lysates were separated by SDS-PAGE and transferred to a PVDF membrane. The membrane was immunoblotted with anti-phospho-β-catenin (Ser552; Cell Signaling Technology), anti-β-catenin (BD Transduction Laboratories), or anti-GAPDH (V-18; Santa Cruz Biotechnology) antibodies. Western blot demonstrates higher levels of phospho-β-catenin (Ser552) in CD44+CD133+ cells than in CD44-CD133+ cells. (E) Transcriptional activation of the TOP reporter in CD44+CD133+ Caco-2 cells. The reporter plasmids, pTOPFlash (TOP, a wild-type reporter) or pFOPFlash (FOP, a mutant reporter), were transfected into CD44-CD133+ or CD44+CD133+ cells, respectively (along with a Renilla luciferase reporter to enable correction for transfection efficiencies), and the luciferase activity was determined. Fold induction (TOP/FOP) is expressed relative to that of the empty expression vector. Data represent mean ± SD for at least three experiments. An unpaired Student's t-test was used to determine statistical significance. **p < 0.01 versus control group.
Figure 6
Figure 6
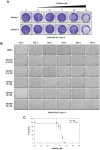
Importance of the Wnt signaling pathway in CD44+CD133+ Caco-2 cell proliferation. (A) Effects of XAV939 treatment on CD44+CD133+ Caco-2 cell colony formation. FACS-isolated CD44+CD133+ cells were plated in a 12-well plate at a cell density of 1 × 10⁴ per well and cultured in medium containing the indicated concentration of XAV939. Six days after XAV939 treatment, colony formation assays were carried out, and colonies were stained using crystal violet (0.05%) solution. A representative image of three separate experiments is shown. (B) Time-dependent effects of XAV939 treatment on CD44+CD133+ Caco-2 cell growth and morphology. CD44+CD133+ cells were cultured for 6 days in the absence or presence of the indicated concentration of XAV939. Cells were monitored once each day using an inverted phase-contrast microscope for 6 days. Scale bars indicate 100 μm. Four separate experiments produced similar results. (C) Determination of half-maximal inhibitory concentration of XAV939 in CD44+CD133+ Caco-2 tumor-initiating cells. Increasing concentrations of XAV939 were added to CD44+CD133+ cells, and growth inhibition was monitored by cell counting. Cell growth is presented as a percentage of the control (DMSO) at a given concentration of XAV939. Data are presented as the mean ± SD of four separate experiments. The IC50 value of XAV939 was calculated from a sigmoidal concentration-response curve fitted using SoftMax Pro software.
Figure 7
Figure 7
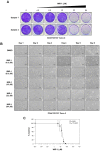
IWR-1 inhibits proliferation of CD44+CD133+ Caco-2 cells. (A) IWR-1 suppresses colony formation in CD44+CD133+ Caco-2 cells. CD44+CD133+ Caco-2 cells were plated in a 12-well plate at a density of 1 × 10⁴ per well and cultured in medium containing the indicated concentration of IWR-1. Six days after IWR-1 treatment, colony formation assays were carried out, and colonies were stained with 0.05% crystal violet. Representative crystal violet-stained images are presented. Three separate experiments produced similar results. (B) Effects of IWR-1 on CD44+CD133+ Caco-2 cell proliferation. CD44+CD133+ cells were exposed to increasing concentrations of IWR-1, and growth inhibition was monitored every day for 6 days. Scale bars indicate 100 μm. Representative images are shown from four separate experiments, which yielded similar results. (C) Determination of half-maximal inhibitory concentration of IWR-1. Increasing concentrations of IWR-1 were added to CD44+CD133+ cells, and growth inhibition was monitored by cell counting. Cell growth is presented as the percentage of the control (DMSO) value at a given concentration of IWR-1. Data are presented as the mean ± SD of four separate experiments. The IC50 value for IWR-1 was calculated from a sigmoidal concentration-response curve fitted using SoftMax Pro software.
Figure 8
Figure 8
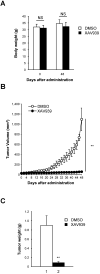
XAV939 suppresses CD44+CD133+ cell-induced tumor formation. (A) Mean body weight of NSG mice following XAV939 treatment. To evaluate the potential toxicity of XAV939, the body weight of NSG mice was monitored for the duration of the experiment. Mice showed no notable weight loss. An unpaired Student's t-test was applied to determine statistical significance. p = non-significant (NS) for >0.05. (B) Decrease in tumor volume after XAV939 treatment. Tumor-bearing mice (tumor volume = 15-25 mm3, randomized into two groups) were intraperitoneally injected with vehicle or XAV939 (20 mg/kg) once every 3 days for 48 days, and tumor size was monitored. An unpaired Student's t-test was applied to determine statistical significance. **p < 0.01 versus control group. (C) Quantification of tumor growth following XAV939 or control treatment. Tumor mass derived from vehicle- or XAV939-treated mice is presented as mean mass increases ± SD. An unpaired Student's t-test was applied to determine statistical significance. **p < 0.01 versus control group.

Similar articles

Cited by

References

    1. Siegel RL, Miller KD, Jemal A. Cancer statistics, 2020. CA Cancer J Clin. 2020;70:7–30. - PubMed
    1. Siegel RL, Miller KD, Goding Sauer A, Fedewa SA, Butterly LF, Anderson JC, Colorectal cancer statistics, 2020. CA Cancer J Clin. 2020. - PubMed
    1. Markowitz SD, Bertagnolli MM. Molecular origins of cancer: Molecular basis of colorectal cancer. N Engl J Med. 2009;361:2449–60. - PMC - PubMed
    1. Meyerhardt JA, Mayer RJ. Systemic therapy for colorectal cancer. N Engl J Med. 2005;352:476–87. - PubMed
    1. Bomken S, Fiser K, Heidenreich O, Vormoor J. Understanding the cancer stem cell. Br J Cancer. 2010;103:439–45. - PMC - PubMed

Publication types

MeSH terms