Review
. 2021;31(7):2715-2756.
doi: 10.1007/s10904-021-02011-3. Epub 2021 May 12.

Recent Advances in Nanoscale Metal-Organic Frameworks Towards Cancer Cell Cytotoxicity: An Overview

Affiliations
Review

Recent Advances in Nanoscale Metal-Organic Frameworks Towards Cancer Cell Cytotoxicity: An Overview

Pierre D Harvey et al. J Inorg Organomet Polym Mater. 2021.

Abstract

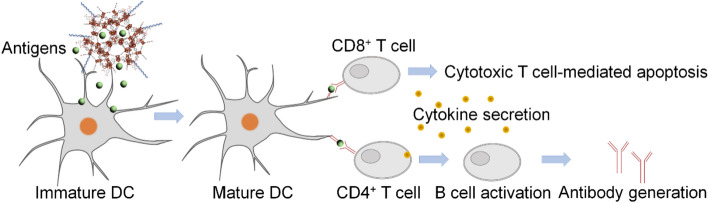
Abstract: The fight against cancer has always been a prevalent research topic. Nanomaterials have the ability to directly penetrate cancer cells and potentially achieve minimally invasive, precise and efficient tumor annihilation. As such, nanoscale metal organic frameworks (nMOFs) are becoming increasingly attractive as potential therapeutic agents in the medical field due to their high structural variability, good biocompatibility, ease of surface functionalization as well as their porous morphologies with tunable cavity sizes. This overview addresses five different common strategies used to find cancer therapies, while summarizing the recent progress in using nMOFs as cytotoxic cancer cell agents largely through in vitro studies, although some in vivo investigations have also been reported. Chemo and targeted therapies rely on drug encapsulation and delivery inside the cell, whereas photothermal and photodynamic therapies depend on photosensitizers. Concurrently, immunotherapy actively induces the body to destroy the tumor by activating an immune response. By choosing the appropriate metal center, ligands and surface functionalization, nMOFs can be utilized in all five types of therapies. In the last section, the future prospects and challenges of nMOFs with respect to the various therapies will be presented and discussed.


Conflict of interest statement

Conflict of interestThe authors declare no competing financial interest.

Figures

Fig. 1
Fig. 1
Simplified reaction scheme of various nMOFs belonging to the ZIF, MIL and UiO families. Red: oxygen; grey: carbon; orange: iron; blue: nitrogen; turquoise: zirconium (Color figure online)
Fig. 2
Fig. 2
Schematic illustration of nMOF-mediated chemotherapy inside a cancer cell (Color figure online)
Fig. 3
Fig. 3
Structures of MIL-53(Fe) (a), [Gd(BCB)(DMF)](H2O2) (b) and [Dy(HABA)(ABA)(DMA)4] (c). Red: oxygen; grey: carbon; orange: iron; turquoise: gadolinium (b) and dysprosium (c) (Color figure online)
Fig. 4
Fig. 4
Scheme illustrating how MnCO@Ti-MOF releases CO in the presence of H2O2: a H2O2 decomposes into OH radicals through a Fenton-like reaction; b the OH radicals replace the Br and CO ligands causing CO release; c manganese hydroxyl decomposes into MnCOx via the removal of H2O2 and H2O [28] (Color figure online)
Fig. 5
Fig. 5
a Ti-MOF structure. b UiO-68 MOF structure. c Cu-TCPP(Fe) nMOF nanosheets structure. d ZIF-L MOF structure. Red: oxygen; grey: carbon; blue: nitrogen; purple: titanium (a) or zinc (d); green: zirconium; orange: iron; yellow: copper (Color figure online)
Fig. 6
Fig. 6
a Synthesis of the nucleic acid-functionalized MOF(3). b Preparation of the dye/drug-loaded MOF(3) capped by the (3)/(4) duplex and the subsequent pH-induced unlocking via the reconfiguration into intercalated-motif structures. c Preparation of the dye/drug-loaded MOF(3) capped by the (3)/(5) duplex and the subsequent pH-induced unlocking via the reconfiguration into intercalated-motif structures. d Drug/dye release from MOF(6/7) through the cleavage of the capping units by Mg2+ ions that activate the Mg2+-dependent DNAzymes. e Drug/dye release from MOF(6/8) through the cleavage of the capping units by Pb2+ ions that activate the Pb2+-dependent DNAzymes. f Drug/dye release from MOF(6/9) via the unlocking of the capping units via the cooperative cleavage of the lock, in the presence of ATP and Mg2+ ions [33]. Published by The Royal Society of Chemistry (Color figure online)
Fig. 7
Fig. 7
a Schematic loading and unlocking of MOF(1)/(2) through the formation of the VEGF/aptamer complex, where (2) is a nucleic acid containing the anti-VEGF aptamer. b Schematic loading and unlocking of MOF(1)/(3) through the formation of the VEGF/aptamer complex, where (3) includes the anti-VEGF aptamer conjugated to the AS1411 aptamer [38]. Reproduced with permission from The Royal Society of Chemistry (Color figure online)
Fig. 8
Fig. 8
Schematic illustration of drug loading and post-synthetic surface functionalization. (1) Functionalization with bicyclononyne functionalized β-cyclodextrin derivatives attached to PEG1900 polymers. (2) Functionalization with αvβ3 integrins [41]. Reproduced with permission from The Royal Society of Chemistry (Color figure online)
Fig. 9
Fig. 9
ROS generation via the reaction between ferric ions and DHA [44, 45] (Color figure online)
Fig. 10
Fig. 10
Activation of NOX by Cisplatin and formation of superoxide anions and H2O2 from O2 followed by Fenton reactions [44]
Fig. 11
Fig. 11
Schematic synthesis of DOX/3-amino-1,2,4-triazole-loaded Fe3O4@MSN, further conjugated to folate/triphenylphosphonium [48]. Reproduced with permission from The Royal Society of Chemistry (Color figure online)
Fig. 12
Fig. 12
Schematic illustration of nMOF-mediated photothermal therapy (Color figure online)
Fig. 13
Fig. 13
a UiO-66 MOF structure. b Fe-soc-MOF structure. Red: oxygen; grey: carbon; blue: nitrogen; green: zirconium; orange: iron (Color figure online)
Fig. 14
Fig. 14
Schematic synthesis of AuNS@MOF-ZD2 nMOFs. Reproduced with permission from WILEY (Color figure online)
Fig. 15
Fig. 15
Schematic preparation of UFO-like CD-PdNS/ZIF-8 JNPs. Reproduced with permission from WILEY (Color figure online)
Fig. 16
Fig. 16
Schematic illustration of nMOF-mediated immunotherapy by releasing antigens to APCs (dendritic cells in this case) (Color figure online)
Fig. 17
Fig. 17
a W-TBP MOF structure. b PCN MOF structure. c Fe-TBP MOF structure. Red: oxygen; grey: carbon; blue: nitrogen; green: zirconium; orange: iron; turquoise: tungsten (Color figure online)
Fig. 18
Fig. 18
Schematic illustration of nMOF-mediated targeted therapies. Violet star Cytotoxic proteins; red down arrow Gene regulators; green triangle DNA damage repair inhibitors; yellow circle Angiogenesis inhibitors; blue plus Autophagy inhibitors (Color figure online)
Fig. 19
Fig. 19
Structure of rMOF (MIL-88B). Red: O; grey: C; blue: N; orange: Fe (Color figure online)
Fig. 20
Fig. 20
Schematic diagram illustrating the consecutive encapsulations of black phosphorous quantum dots to form G-BHM nMOFs (Color figure online)
Fig. 21
Fig. 21
a UiO-66 MOF structure. b Zr-Fum MOF structure. c IRMOF-3 structure. d Hf-BDC MOF structure. Red: oxygen; grey: carbon; purple: zinc; green: zirconium; blue: hafnium (Color figure online)
Fig. 22
Fig. 22
Synthesis of DCA-loaded, surface functionalized UiO-66 MOFs through coordination modulation (CM), post-synthetic surface ligand exchange (PS) and click chemistry (CC) [103]
Fig. 23
Fig. 23
Synthesis of DCA-loaded MOFs, surface functionalized Zr-fum MOFs [104]
Fig. 24
Fig. 24
a Expression levels of LC3-I and LC3-II in MEFs after exposure to Fe-MIL-101-NH2 at different concentrations for 24 h. b Expression levels of p62 in MEFs treated with Fe-MIL-101-NH2 at different concentrations. c Expression levels of mTOR, Becline1 and Atg5 in MEFs after exposure to Fe-MIL-101-NH2 at different concentrations for 24 h. *p < 0.05 compared with control group. Data are expressed as mean ± S.D. n = 3 [134]. Reproduced with permission from The Royal Society of Chemistry
Fig. 25
Fig. 25
Photophysical processes and nMOF-mediated PDT. Green circle Photosensitizers (Color figure online)
Fig. 26
Fig. 26
Hafnium-porphyrin nMOF structure (Color figure online)
Fig. 27
Fig. 27
Preparation of A@UiO-66-H-P. Reproduced with permission from WILEY (Color figure online)
Fig. 28
Fig. 28
Schematic illustration of TPZ/UCSs nMOFs (Color figure online)

Similar articles

Cited by

References

    1. M.G. Krukemeyer, V. Krenn, F. Huebner, W. Wagner, R. Resch, J. Nanomed. Nanotechnol. 06, 336 (2015).
    1. Rudramurthy GR, Swamy MK. J. Biol. Inorg. Chem. 2018;23:1185. doi: 10.1007/s00775-018-1600-6. - DOI - PubMed
    1. Magdalane CM, Kaviyarasu K, Raja A, Arularasu MV, Mola GT, Isaev AB, Al-Dhabi NA, Arasu MV, Jeyaraj B, Kennedy J, Maaza M. J. Photochem. Photobiol. B Biol. 2018;185:275. doi: 10.1016/j.jphotobiol.2018.06.011. - DOI - PubMed
    1. Kaviyarasu K, Kanimozhi K, Matinise N, Magdalane CM, Mola GT, Kennedy J, Maaza M. Mater. Sci. Eng. C. 2017;76:1012. doi: 10.1016/j.msec.2017.03.210. - DOI - PubMed
    1. Kaviyarasu K, Geetha N, Kanimozhi K, Magdalane CM, Sivaranjani S, Ayeshamariam A, Kennedy J, Maaza M. Mater. Sci. Eng. C. 2017;74:325. doi: 10.1016/j.msec.2016.12.024. - DOI - PubMed

LinkOut - more resources