. 2021 Apr 29:15:595583.
doi: 10.3389/fnins.2021.595583. eCollection 2021.

Spatial Memory and Gut Microbiota Alterations Are Already Present in Early Adulthood in a Pre-clinical Transgenic Model of Alzheimer's Disease

Affiliations

Spatial Memory and Gut Microbiota Alterations Are Already Present in Early Adulthood in a Pre-clinical Transgenic Model of Alzheimer's Disease

Paola C Bello-Medina et al. Front Neurosci. .

Abstract

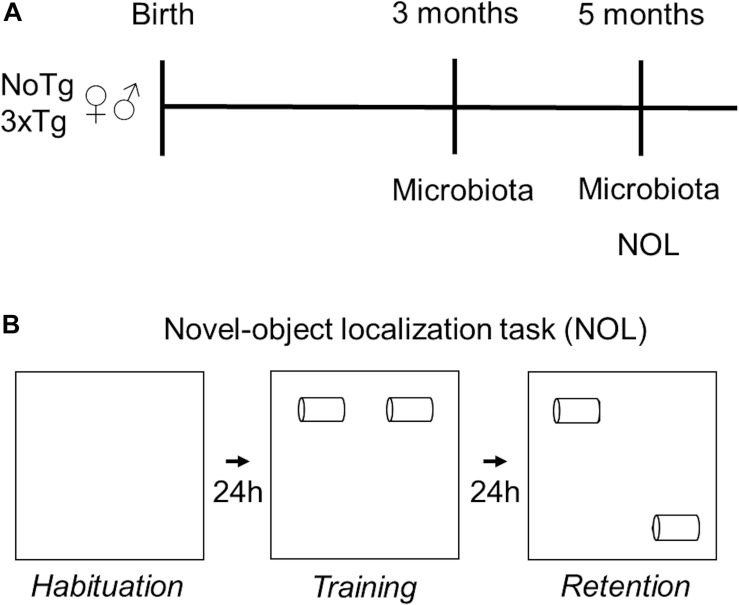
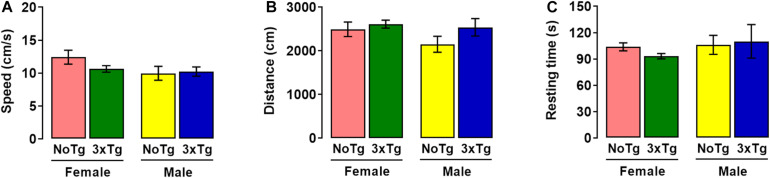
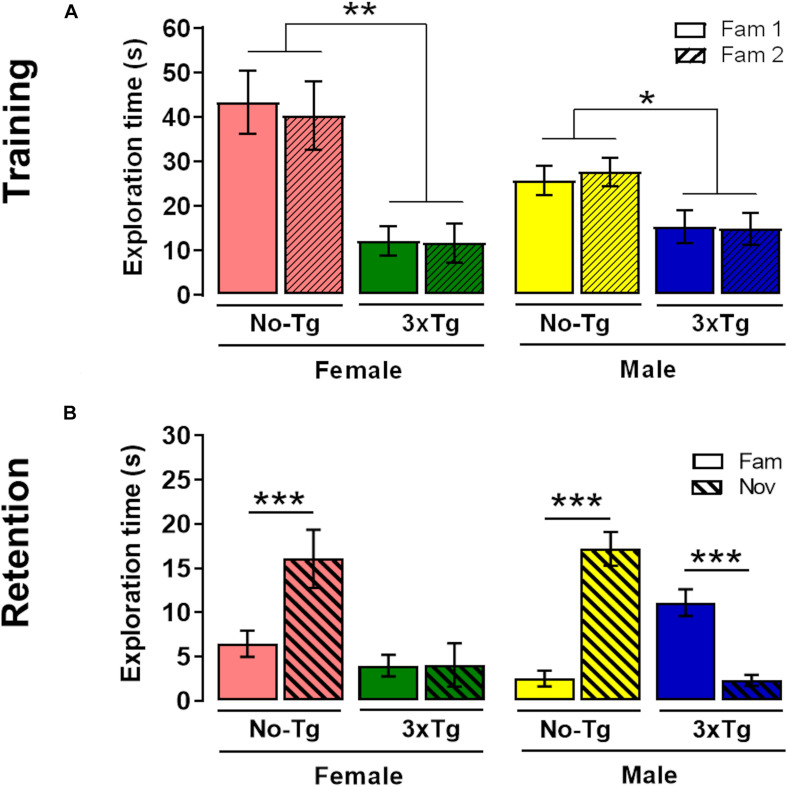
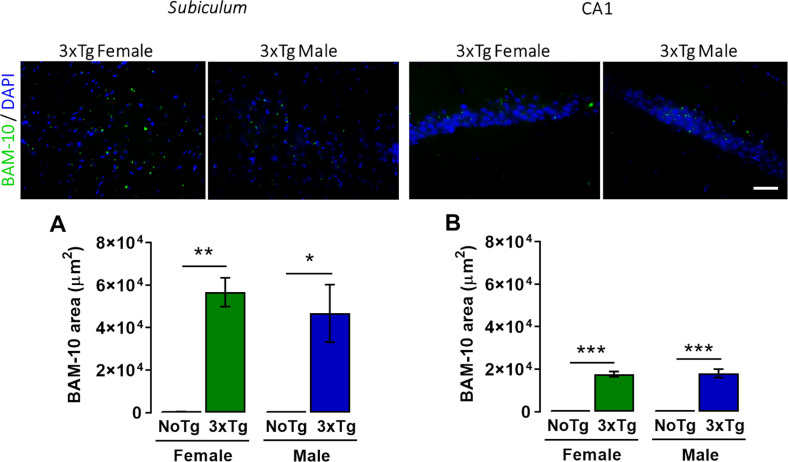
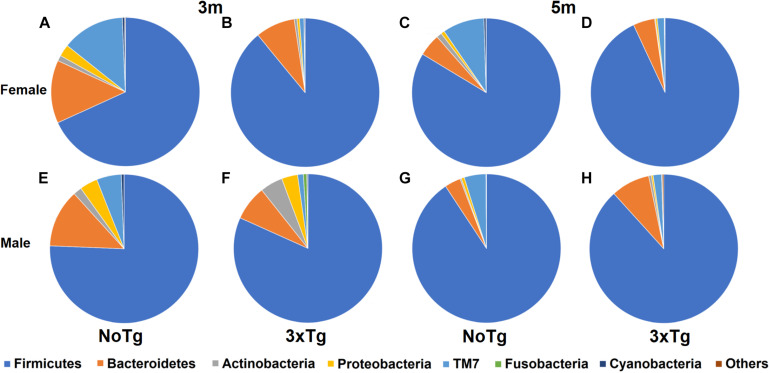
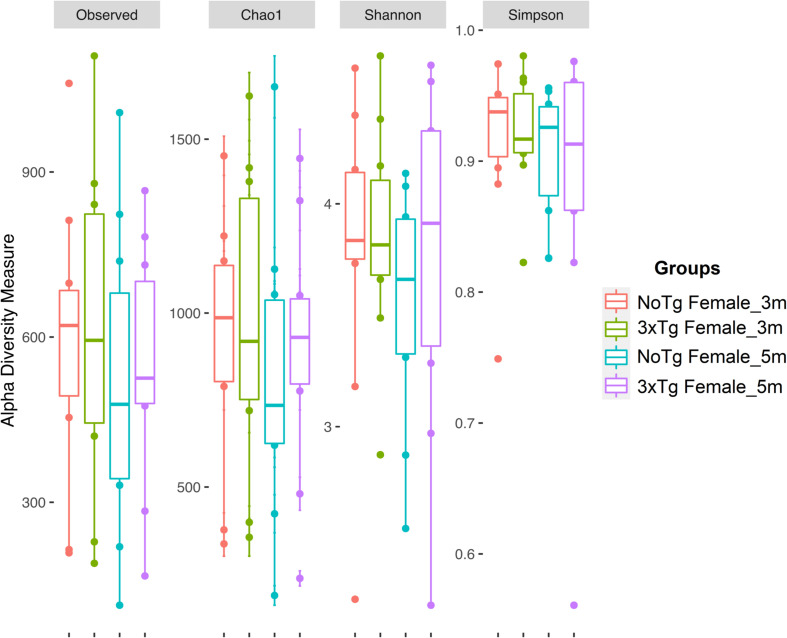
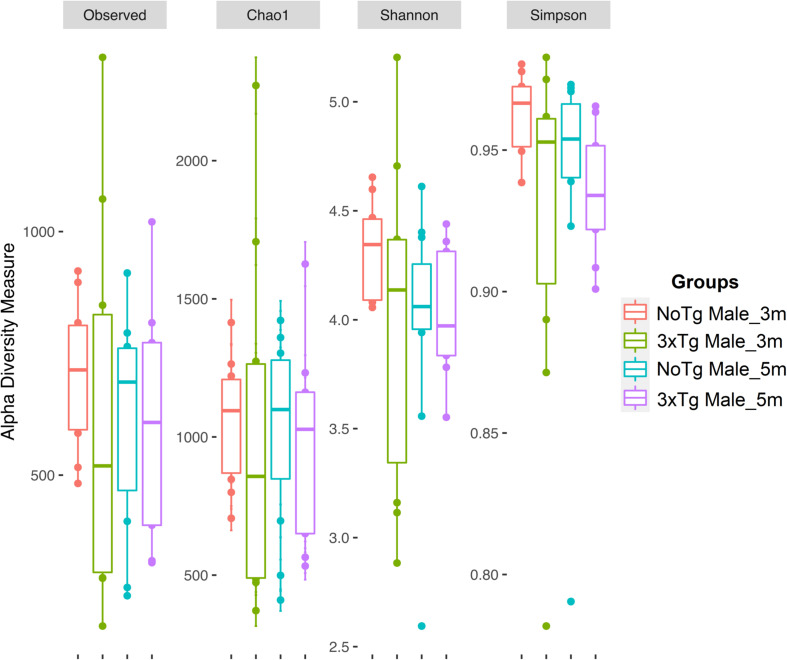
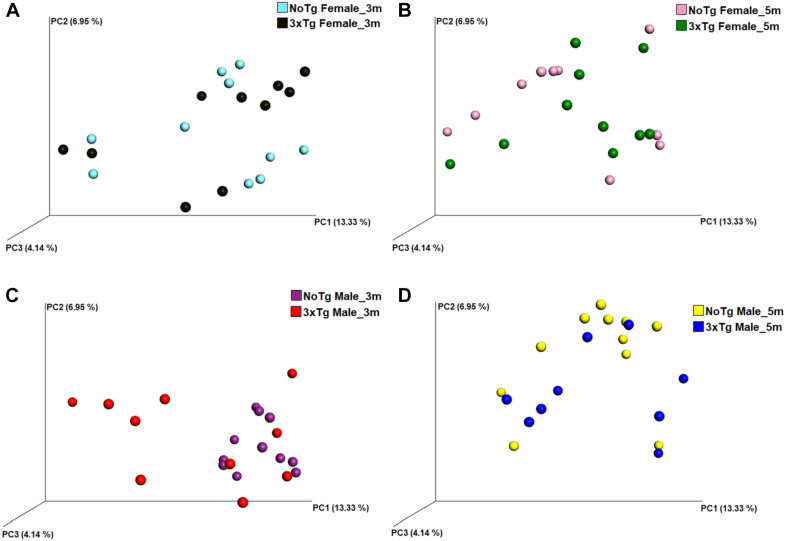
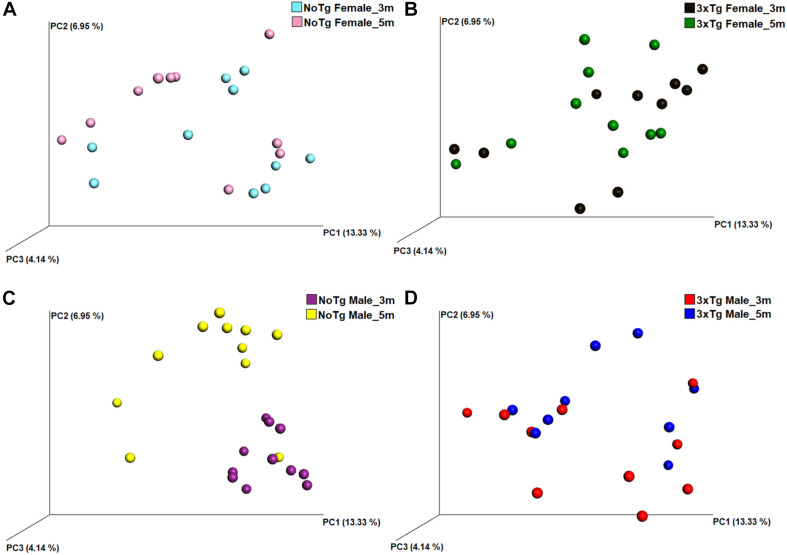
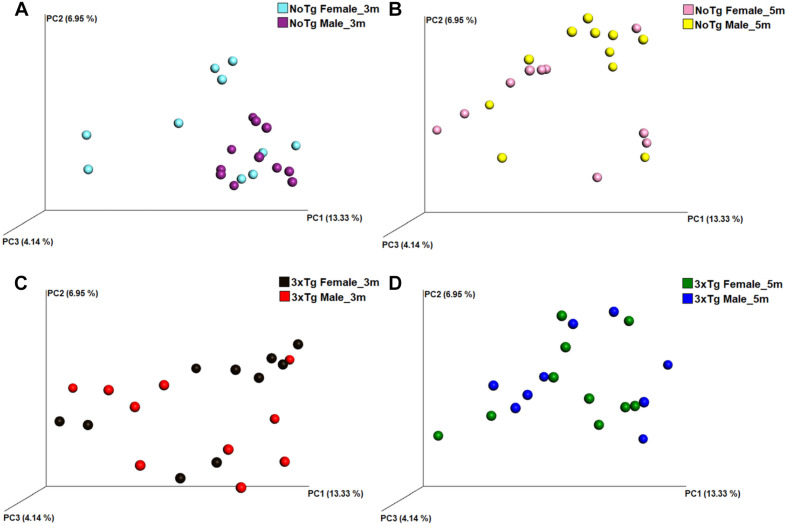
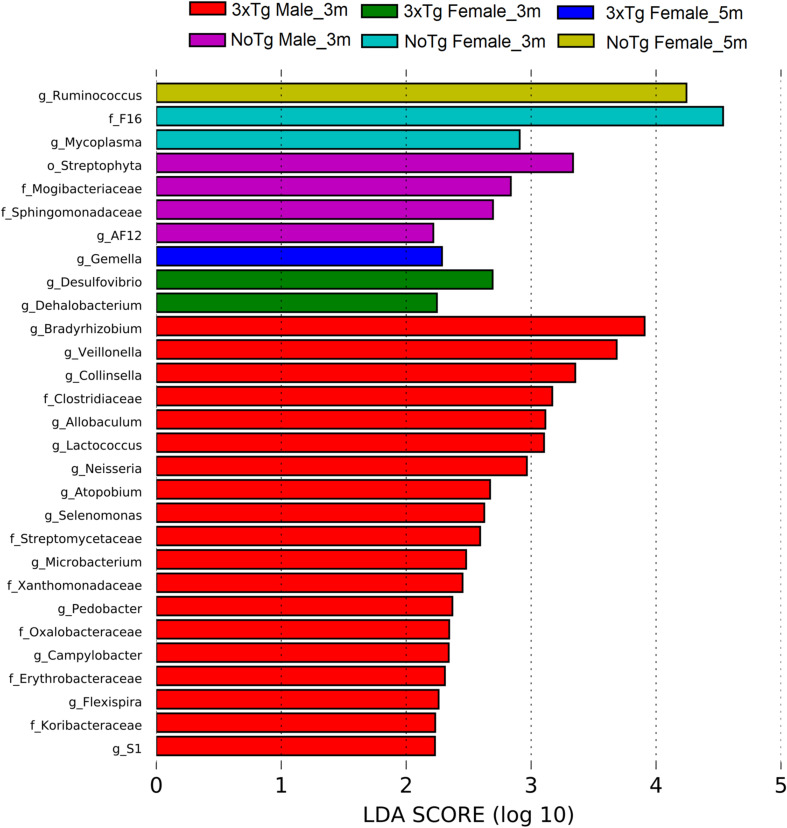
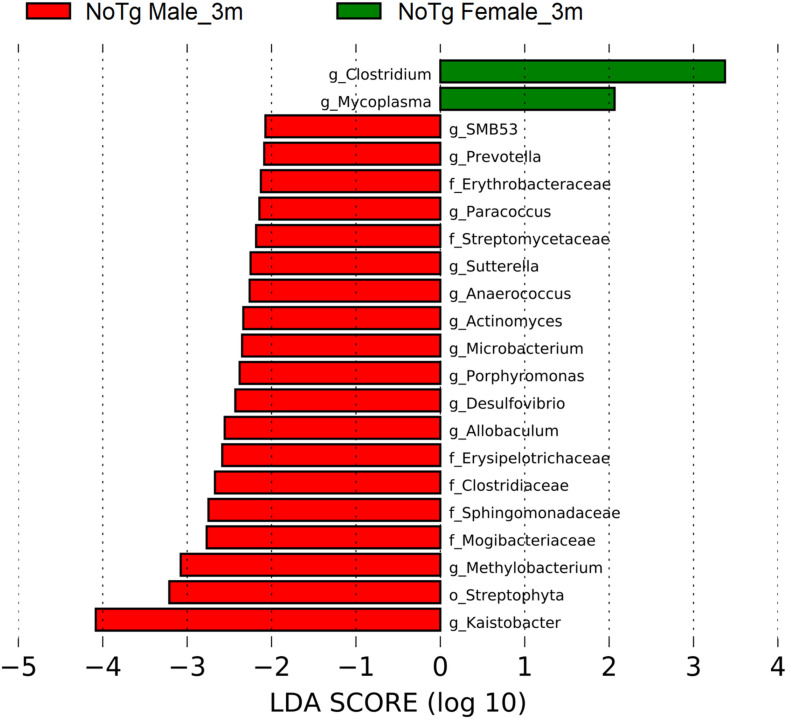
The irreversible and progressive neurodegenerative Alzheimer's disease (AD) is characterized by cognitive decline, extracellular β-amyloid peptide accumulation, and tau neurofibrillary tangles in the cortex and hippocampus. The triple-transgenic (3xTg) mouse model of AD presents memory impairment in several behavioral paradigms and histopathological alterations from 6 to 16 months old. Additionally, it seems that dysbiotic gut microbiota is present in both mouse models and patients of AD at the cognitive symptomatic stage. The present study aimed to assess spatial learning, memory retention, and gut microbiota alterations in an early adult stage of the 3xTg-AD mice as well as to explore its sexual dimorphism. We evaluated motor activity, novel-object localization training, and retention test as well as collected fecal samples to characterize relative abundance, alpha- and beta-diversity, and linear discriminant analysis (LDA) effect size (LEfSe) analysis in gut microbiota in both female and male 3xTg-AD mice, and controls [non-transgenic mice (NoTg)], at 3 and 5 months old. We found spatial memory deficits in female and male 3xTg-AD but no alteration neither during training nor in motor activity. Importantly, already at 3 months old, we observed decreased relative abundances of Actinobacteria and TM7 in 3xTg-AD compared to NoTg mice, while the beta diversity of gut microbiota was different in female and male 3xTg-AD mice in comparison to NoTg. Our results suggest that gut microbiota modifications in 3xTg-AD mice anticipate and thus could be causally related to cognitive decline already at the early adult age of AD. We propose that microbiota alterations may be used as an early and non-invasive diagnostic biomarker of AD.

Keywords: 3xTg-AD; Actinobacteria; TM7; alpha-diversity; beta-diversity; dysbiosis; high-throughput DNA sequencing; novel-object localization.


Conflict of interest statement

The authors declare that the research was conducted in the absence of any commercial or financial relationships that could be construed as a potential conflict of interest.

Figures

FIGURE 1
FIGURE 1
Experimental design. (A) Fecal samples of female and male non-transgenic (NoTg) or Alzheimer’s disease triple-transgenic (3xTg-AD) mice were collected when they were 3 and 5 months old. (B) NOL task was performed in 5-month-old mice. NOL consists of three sessions: habituation, training, and retention test.
FIGURE 2
FIGURE 2
Motor activity during habituation session of novel-object localization (NOL) task. Mean values (with standard error) of (A) speed, (B) distance traveled, and (C) resting time of female or male non-transgenic (NoTg) or Alzheimer’s disease triple-transgenic (3xTg-AD) mice of 5 months old; n = 10 mice per group.
FIGURE 3
FIGURE 3
Novel-object localization (NOL) task. Mean exploration time (with standard error) of familiar localization 1 (Fam 1) and familiar localization 2 (Fam 2) in (A) training and exploration time of familiar localization (Fam) and novel localization (Nov) in (B) retention test of female or male non-transgenic (NoTg) or Alzheimer’s disease triple-transgenic (3xTg-AD) mice of 5 months old. *p < 0.05, **p < 0.001, ***p < 0.0001; n = 10 mice per group.
FIGURE 4
FIGURE 4
Representative images of β-amyloid (green) immunohistochemistry and nuclei detection (blue) obtained with 40× objective in the subiculum and CA1 of the dorsal hippocampus of female and male 3xTg-AD at 5 months old. Mean BAM-10 area (μm2) (with standard error) of female and male non-transgenic (NoTg) or Alzheimer’s disease triple-transgenic (3xTg-AD) mice in the (A) subiculum and (B) CA1. *p < 0.05, **p < 0.001, ***p < 0.0001; n = 4 mice per group. Scale bar = 20 μm.
FIGURE 5
FIGURE 5
Relative abundance of bacterial phyla in fecal samples of non-transgenic (NoTg) and Alzheimer’s disease triple-transgenic (3xTg-AD) mice. Sectors in pie charts indicate Firmicutes, Bacteroidetes, Actinobacteria, Proteobacteria, TM7, Fusobacteria, and Cyanobacteria phyla as shown by tag colors at the right side of the figure. Abundances of each phylum are shown as percentages beside each sector in the pie charts. “Others” groups phyla with <0.5% relative abundance (Verrucomicrobia, Acidobacteria, Thermotogae, Chloroflexi, Thermi, Gemmatimonadetes, Tenericutes, Euryarchaeota, FBP, Spirochaetes, and Synergistetes). The figure shows data for 3 and 5 months (m) old for NoTg female (A,C) and male mice (E,G) and for 3xTg-AD female (B,D) and male mice (F,H) (Supplementary Tables 1, 2).
FIGURE 6
FIGURE 6
Alpha diversity of bacteria in fecal samples collected from female mice. The figure shows data for non-transgenic (NoTg) (coral pink) and Alzheimer’s disease triple-transgenic (3xTg-AD) mice at 3 months (m) old (light olive) and NoTg (light blue) and 3xTg-AD mice at 5 months old (light purple). The Y-axis indicates the values for the corresponding indexes: observed number of species (Observed), expected bacterial richness (Chao1), and Shannon and Simpson diversity (Supplementary Tables 3, 4).
FIGURE 7
FIGURE 7
Alpha diversity of bacteria in fecal samples collected from male mice. The figure shows data for non-transgenic (NoTg) (coral pink) and Alzheimer’s disease triple-transgenic (3xTg-AD) mice at 3 months (m) old (light olive) and NoTg (light blue) and 3xTg-AD mice at 5 months old (light purple). The Y-axis indicates the values for the corresponding indexes: observed number of species (Observed), expected bacterial richness (Chao1), and Shannon and Simpson diversity (Supplementary Tables 3, 4).
FIGURE 8
FIGURE 8
Beta diversity of bacteria in fecal samples collected from non-transgenic (NoTg) and Alzheimer’s disease triple-transgenic (3xTg-AD) mice. The graphics show beta diversity analyses calculated by dissimilarity metrics using operational taxonomic unit (OTU) tables and Unweighted UniFrac analyses. The analyses show the dissimilarity among mice by colors: NoTg female at 3 months (m) old (cyan), 3xTg-AD female at 3 months old (black), NoTg female at 5 months old (pink), 3xTg-AD female at 5 months old (green), NoTg male at 3 months old (purple), 3xTg-AD male at 3 months old (red), NoTg male at 5 months old (yellow), 3xTg-AD male at 3 months old (blue). Data comparisons by genotype and sex: NoTg vs. 3xTg-AD female mice at 3 months old (A), NoTg vs. 3xTg-AD female mice at 5 months old (B), NoTg vs. 3xTg-AD male mice at 3 months old (C), and NoTg vs. 3xTg-AD male mice at 5 months old (D). The three-dimensional scatter plots were generated using principal coordinates analyses (PCoA) in three different axis that show the percentage of total differences. There were significant differences on all comparisons according to ANOSIM similarity test ((A), R = 0.184, p = 0.018; (B), R = 0.124, p = 0.028; (C), R = 0.422, p = 0.001; (D), R = 0.174, p = 0.022).
FIGURE 9
FIGURE 9
Beta diversity of bacteria in fecal samples collected from non-transgenic (NoTg) and Alzheimer’s disease triple-transgenic (3xTg-AD) mice. The graphics show beta diversity analyses calculated by dissimilarity metrics using operational taxonomic unit (OTU) tables and Unweighted UniFrac analyses. The analyses show the dissimilarity among mice by colors: NoTg female at 3 months (m) old (cyan), 3xTg-AD female at 3 months old (black), NoTg female at 5 months old (pink), 3xTg-AD female at 5 months old (green), NoTg male at 3 months old (purple), 3xTg-AD male at 3 months old (red), NoTg male at 5 months old (yellow), 3xTg-AD male at 3 months old (blue). Data comparisons by time in the same genotype: NoTg female mice 3 and 5 months old (A), 3xTg-AD female mice 3 and 5 months old (B), NoTg male mice 3 and 5 months old (C), and 3xTg-AD male mice 3 and 5 months old (D). The three-dimensional scatter plots were generated using principal coordinates analyses (PCoA) in three different axis that show the percentage of total differences. There is a significant difference in panel (C) according to ANOSIM similarity test (R = 0.425, p = 0.002) but not in panels (A) (R = 0.032, p = 0.223), (B) (R = 0.020, p = 0.297), and (D) (R = 0.093, p = 0.076).
FIGURE 10
FIGURE 10
Beta diversity of bacteria in fecal samples collected from non-transgenic (NoTg) and Alzheimer’s disease triple-transgenic (3xTg-AD) mice. The graphics show beta diversity analyses calculated by dissimilarity metrics using operational taxonomic unit (OTU) tables and Unweighted UniFrac analyses. The analyses show the dissimilarity among mice by colors: NoTg female at 3 months (m) old (cyan), 3xTg-AD female at 3 months old (black), NoTg female at 5 months old (pink), 3xTg-AD female at 5 months old (green), NoTg male at 3 months old (purple), 3xTg-AD male at 3 months old (red), NoTg male at 5 months old (yellow), 3xTg-AD male at 3 months old (blue). The data is comparing by sex NoTg and 3xTg; NoTg female and male mice at 3 months (A), NoTg female and male mice at 5 months (B), 3xTg female and male mice at 3 months (C), and 3xTg female and male mice at 5 months (D). The three-dimensional scatter plots were generated using principal coordinates analyses (PCoA) in three different axes which shows the percentage of total differences. There is significant difference on (A) according to ANOSIM similarity test (R = 0.225, p = 0.002), but no for (B, R = 0.082, p = 0.102), (C, R = 0.037, p = 0.231), and (D, R = 0.029, p = 0.275).
FIGURE 11
FIGURE 11
Bacteria with a statistically significant change between non-transgenic (NoTg) and Alzheimer’s disease triple-transgenic (3xTg-AD) mice at 3 and 5 months (m) old in male and female in fecal samples. The bacteria with statistical relevance are shown by colors: red color indicates 3xTg-AD male at 3 months old; green, 3xTg-AD female at 3 months old; blue, 3xTg-AD female at 5 months old; pink, NoTg male at 3 months old; cyan, NoTg female at 3 months old; light olive, NoTg female at 5 months old. Horizontal bars represent the effect size for each taxon. The length of the bars represents the log10 transformed linear discriminant analysis (LDA) score, indicated by vertical dotted lines. The threshold on the logarithmic LDA score for discriminative features was set to 2.0. The name of bacteria with a statistically significant change in the relative abundance is written alongside the horizontal lines. Taxa names are abbreviated as “o,” order; “f,” family, and “g,” genus. See Supplementary Table 5 for full taxon description and LDA score and p values.
FIGURE 12
FIGURE 12
Bacteria with statistically significant change on non-transgenic (NoTg) mice at 3 and 5 months (m) old for male and female in fecal samples. The bacteria with statistical relevance are shown by colors: red color indicates NoTg male at 3 months old; green, NoTg female at 3 months old. Horizontal bars represent the effect size for each taxon. The length of the bars represents the log10 transformed linear discriminant analysis (LDA) score, indicated by vertical dotted lines. The threshold on the logarithmic LDA score for discriminative features was set to 2.0. The name of bacteria with a statistically significant change in the relative abundance is written alongside the horizontal lines. Taxa names are abbreviated as “c,” class; “o,” order; “f,” family, and “g,” genus. See Supplementary Table 6 for full taxon description and LDA score and p values.
FIGURE 13
FIGURE 13
Bacteria with statistically significant change on Alzheimer’s disease triple-transgenic (3xTg-AD) mice at 3 and 5 months (m) old in male and female in fecal samples. The bacteria with statistical relevance are shown by colors: red indicates 3xTg-AD male at 3 months old, green indicates 3xTg-AD male at 5 months old, blue indicates 3xTg-AD female at 3 months old, and pink indicates 3xTg-AD female at 5 months old. Horizontal bars represent the effect size for each taxon. The length of the bars represents the log10 transformed linear discriminant analysis (LDA) score, indicated by vertical dotted lines. The threshold on the logarithmic LDA score for discriminative features was set to 2.0. The name of bacteria with a statistically significant change in the relative abundance is written alongside the horizontal lines. Taxa names are abbreviated as “f,” family, and “g,” genus. See Supplementary Table 7 for full taxon description and LDA score and p values.

Similar articles

Cited by

References

    1. Aguayo S., Schuh C. M. A. P., Vicente B., Aguayo L. G. (2018). Association between Alzheimer’s disease and oral and gut microbiota: are pore forming proteins the missing link? J. Alzheimers Dis. 65 29–46. 10.3233/JAD-180319 - DOI - PubMed
    1. Albasser M. M., Davies M., Futter J. E., Aggleton J. P. (2009). Magnitude of the object recognition deficit associated with perirhinal cortex damage in rats: effects of varying the lesion extent and the duration of the sample period. Behav. Neurosci. 123 115–124. 10.1037/a0013829 - DOI - PubMed
    1. Alonso R., Pisa D., Fernández-Fernández A. M., Carrasco L. (2018). Infection of fungi and bacteria in brain tissue from elderly persons and patients with Alzheimer’s disease. Front. Aging Neurosci. 10:159. 10.3389/fnagi.2018.00159 - DOI - PMC - PubMed
    1. Andrews S. (2010). FastQC: A Quality Control Tool for High Throughput Sequence Data. Available online at: http://www.bioinformatics.babraham.ac.uk/projects/fastqc (accessed July, 2020).
    1. Antonets K. S., Kliver S. F., Nizhnikov A. A. (2018). Exploring proteins containing amyloidogenic regions in the proteomes of bacteria of the order Rhizobiales. Evol. Bioinform. 14 1–12. 10.1177/1176934318768781 - DOI - PMC - PubMed

LinkOut - more resources