. 2021 Apr 28:15:641284.
doi: 10.3389/fnins.2021.641284. eCollection 2021.

Valproic Acid Induces Autism-Like Synaptic and Behavioral Deficits by Disrupting Histone Acetylation of Prefrontal Cortex ALDH1A1 in Rats

Affiliations

Valproic Acid Induces Autism-Like Synaptic and Behavioral Deficits by Disrupting Histone Acetylation of Prefrontal Cortex ALDH1A1 in Rats

Huan Liu et al. Front Neurosci. .

Abstract

Objectives: This study aimed to investigate the impact of valproic acid (VPA) on the histone acetylation of acetaldehyde dehydrogenase 1A1 (ALDH1A1) and the mechanism underlying VPA-induced autism-like behavior.

Methods: Female Sprague-Dawley rats were intraperitoneally injected with VPA during gestation to establish an autism model in their offspring. Some offspring prenatally exposed to VPA were randomly treated with MS-275, one histone deacetylase (HDAC) inhibitor, or retinoic acid (RA) after birth. Behavioral tests were conducted on the offspring 6 weeks after birth. Electrophysiological experiments were performed to investigate long-term potentiation (LTP) in the prefrontal cortex (PFC). The expression levels of AMPA receptors (GluA1 and 2), NMDA receptors (GluN1 and 2), synapsin 1 (SYN1), HDAC, acetylated histone 3 (AcH3), RA receptor alpha (RARα), and ALDH1A1 in the PFC were measured by Western blotting and quantitative polymerase chain reaction. ALDH enzyme activity in PFC tissue was detected using a Micro ALDH Assay Kit. The RA level in the PFC was measured using ultrahigh-performance liquid chromatography/tandem mass spectrometry. A chromatin immunoprecipitation (ChIP) experiment explored the interaction between the ALDH1A1 gene and AcH3.

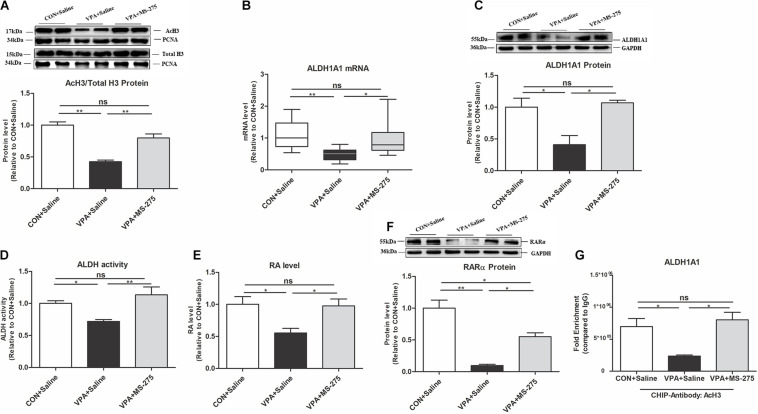
Results: Offspring prenatally exposed to VPA showed autism-like behavior, upregulated the levels of LTP and GluN2A, GluA1, and SYN1 proteins relevant to synaptic plasticity in the PFC. The expression levels of HDAC3 mRNA and protein were increased. On the other hand, there was a significant reduction in the levels of AcH3, RARα, RA, ALDH1A1 mRNA and protein, the level of ALDH activity and AcH3 enrichment in the ALDH1A1 promoter region in VPA-induced offspring. Administration of MS-275 in VPA offspring significantly elevated the levels of AcH3, ALDH1A1 mRNA and protein, ALDH activity, RA, the level of RARα protein and the binding of AcH3 to the ALDH1A1 promoter. In addition, the GluA1 protein level and LTP were reduced, and most behavioral deficits were reversed. After RA supplementation in the VPA-treated offspring, the RA and RARα protein levels were significantly upregulated, GluA1 protein and LTP were downregulated, and most autism-like behavioral deficits were effectively reversed.

Conclusion: These findings suggest that VPA impairs histoneacetylation of ALDH1A1 and downregulates the RA-RARα pathway. Such epigenetic modification of ALDH1A1 by VPA leads to autism-like synaptic and behavioral deficits.

Keywords: ALDH1A1; RARα; autism spectrum disorder; histone acetylation; homeostatic synaptic plasticity; retinoic acid; valproic acid.


Conflict of interest statement

The authors declare that the research was conducted in the absence of any commercial or financial relationships that could be construed as a potential conflict of interest.

Figures

FIGURE 1
FIGURE 1
Schematic diagram of experimental design. (A) Schematic diagram of the CON and VPA groups. VPA rats (offspring, n = 28–30) received a single dose of 600 mg/kg VPA by intraperitoneal injection at 12.5 days of gestation, and the CON rats (offspring, n = 28–30) received the same volume of 0.9% saline. (B) Schematic diagram of the CON + Saline, VPA + Saline, and VPA + MS-275 groups. VPA + MS-275 offspring (n = 28–30) received VPA during pregnancy and an intraperitoneal injection of 3.5 mg/kg MS-275 for a week before each test. Offspring (n = 28–30 per group) from the CON + Saline group and VPA + Saline group were treated with saline for comparison. (C) Schematic diagram of the CON + Corn Oil, VPA + Corn Oil, and VPA + RA groups. VPA + RA offspring (n = 28–30) received VPA during pregnancy and oral administration of 6 mg/kg RA once daily for 3 weeks before each test. Offspring (n = 28–30 per group) from the CON + Corn Oil group and VPA + Corn Oil group were treated with corn oil for comparison. Behavioral tests were conducted beginning at PND 43, and the offspring was sacrificed for brain tissue collection after behavioral tests. VPA, valproic acid; RA, retinoic acid; PND, postnatal day.
FIGURE 2
FIGURE 2
Autism-like behavioral deficits and dysregulation of homeostatic synaptic plasticity in the PFC of VPA-exposed offspring. (A) The tracing and total distance traveled in the open-field test (n = 20–22 per group, Z1 = –1.785, P = 0.074). (B) The time spent in the central zone in the open-field test (n = 20–22 per group, t33 = 5.716, P < 0.001). (C) The time spent self-grooming in the open-field test (n = 20–22 per group, t27 = –4.131, P < 0.001). (D) The tracing and social interaction in the three-chamber test (stimulus: a stranger rat vs. an object) (n = 20–22 per group, t38 = 8.692, P < 0.001 for CON group; t38 = –0.61, P = 0.546 for VPA group). (E) The tracing and recognition of social novelty in the three-chamber test (stimulus: a stranger rat vs. a familiar rat) (n = 20–22 per group, t38 = 2.98, P = 0.005 for CON group; t38 = –1.227, P = 0.227 for VPA group). (F) Western blot and quantification analyses of GluN2A, GluA1, SYN1, GluA2, GluN1, and GluN2B protein in the PFC of offspring from the CON and VPA groups (n = 3 per group). (G) Summary graphs of PFC LTP in CON and VPA (n = 9 slices from 4 rats per group). (H) LTP magnitude was measured as an average potentiation at 41–45 min after the onset of HFS induction (n = 9 slices from 4 rats per group). Each experiment was repeated at least three times. The values are the median (P25–P75) (A) or means ± SEMs (B–H). Mann–Whitney U test (A), Student’s t-test (B–H), *P < 0.05, **P < 0.01, ***P < 0.001, ns, not significant; VPA, valproic acid; PFC: prefrontal cortex; PND, Postnatal Day; LTP, long-term potentiation; fEPSP, field excitatory postsynaptic potentials; HFS, high frequency stimulation.
FIGURE 3
FIGURE 3
Levels of HDAC3 and histone acetylation in the PFC of VPA-exposed offspring. (A) Levels of HDAC1, HDAC2, HDAC3, and HDAC8 mRNA expression in the PFC from the CON and VPA groups, as detected using qPCR and normalized to GAPDH (n = 10 per group). (B) Western blot and quantification analyses of HDAC1, HDAC2, HDAC3, and HDAC8 protein in the nuclear fraction of PFC from CON and VPA groups (n = 3 per group). (C) Western blot and quantification analyses of AcH3 and total H3 proteins in the nuclear fraction of PFC from the CON and VPA groups, as normalized to PCNA; the level of histone acetylation was measured as the ratio of AcH3 to H3 (n = 3 per group). Each experiment was repeated at least three times. The values are means ± SEMs. Student’s t-test, *P < 0.05, **P < 0.01, ns, not significant; VPA, valproic acid; PFC: prefrontal cortex.
FIGURE 4
FIGURE 4
Changes in ALDH1A1 and RA-RARα in the PFC of VPA-exposed offspring. (A) Western blot and quantification analyses of RARα protein in the PFC from the CON and VPA groups (n = 3 per group). (B) RA levels in the PFC from CON and VPA groups, as quantitated using UPLC-MS/MS (n = 5 per group). (C) ALDH1A1, ALDH1A2, and ALDH1A3 mRNA expression levels in the PFC from the CON and VPA groups, as detected using qPCR and normalized to GAPDH (n = 10 per group). (D) Western blot and quantification analyses of ALDH1A1 protein in the PFC of offspring from the CON and VPA groups (n = 3 per group). (E) ALDH enzyme activity in PFC tissue from the CON and VPA groups was determined using an ALDH Assay Kit (n = 10 per group). (F) ChIP-qPCR analyses of the enrichment of AcH3 on the promoter region of the ALDH1A1 gene in the PFC from the CON and VPA groups (n = 3 per group). Each experiment was repeated at least three times. The values are the means ± SEMs (A,B,D–F) or median (P25–P75) (C). Student’s t-test (A,B,D–F), Mann–Whitney U test (C), *P < 0.05, **P < 0.01, ns, not significant; VPA, valproic acid; PFC: prefrontal cortex.
FIGURE 5
FIGURE 5
Levels of AcH3, ALDH1A1, and RA-RARα expression in the PFC of VPA-exposed offspring following MS-275 treatment. (A) Western blot and quantification analyses of AcH3 and total H3 protein in the nuclear fraction of PFC from the CON + Saline, VPA + Saline, and VPA + MS-275 groups, as normalized to PCNA; the level of histone acetylation was measured as the ratio of AcH3 to H3 (n = 3 per group). (B) ALDH1A1 mRNA expression in the PFC from the CON + Saline, VPA + Saline, and VPA + MS-275 groups, as detected using qPCR and normalized to GAPDH (n = 10 per group). (C) Western blot and quantification analyses of ALDH1A1 protein in the PFC of offspring from the CON + Saline, VPA + Saline, and VPA + MS-275 groups (n = 3 per group). (D) ALDH enzyme activity in PFC tissue from the CON + Saline, VPA + Saline, and VPA + MS-275 groups was determined using the ALDH Assay Kit (n = 10 per group). (E) RA levels in the PFC from the CON + Saline, VPA + Saline, and VPA + MS-275 groups, as quantitated using UPLC-MS/MS (n = 5 per group). (F) Western blot and quantification analyses of RARα protein in the PFC from the CON + Saline, VPA + Saline, and VPA + MS-275 groups (n = 3 per group). (G) ChIP-qPCR analyses of the enrichment of AcH3 on the promoter region of the ALDH1A1 gene in the PFC from the CON + Saline, VPA + Saline, and VPA + MS-275 groups (n = 3 per group). Each experiment was repeated at least three times. The values are the means ± SEMs (A,C–G) or median (P25–P75) (B). One-way ANOVA with Bonferroni post hoc test (A,C–G), Kruskal–Wallis H test with Nemenyi post hoc test (B), *P < 0.05, **P < 0.01, ns, not significant; VPA, valproic acid; PFC: prefrontal cortex.
FIGURE 6
FIGURE 6
Changes in homeostatic synaptic plasticity and autism-like behaviors in VPA-exposed offspring after MS-275 treatment. (A) Western blot and quantification analyses of GluN2A, GluA1, and SYN1 protein in the PFC of offspring from the CON + Saline, VPA + Saline, and VPA + MS-275 groups (n = 3 per group). (B) Summary graphs of PFC LTP in the CON + Saline, VPA + Saline, and VPA + MS-275 groups (n = 9 slices from 4 rats per group). (C) LTP magnitude was measured as an average potentiation at 41–45 min after the onset of HFS induction (n = 9 slices from four rats per group). (D–H) Behavioral tests were performed in offspring from the CON + Saline, VPA + Saline, and VPA + MS-275 groups beginning at PND 43. (D) The tracing and total distance traveled in the open-field test (n = 20–22 per group, F2,60 = 1.788, P = 0.176). (E) The time spent in the central zone in the open-field test (n = 20–22 per group, F2,60 = 11.238, P < 0.001). (F) The time spent self-grooming in the open-field test (n = 20–22 per group, F2,60 = 7.083, P = 0.002). (G) The tracing and social interaction in the three-chamber test (stimulus: a stranger rat vs. an object) (n = 20-22 per group, t42 = 11.485, P < 0.001 for CON + Saline group; t38 = –1.199, P = 0.238 for VPA + Saline group; t38 = 6.157, P < 0.001 for VPA + MS-275 group). (H) The tracing and recognition of social novelty in the three-chamber test (stimulus: a stranger rat vs. a familiar rat) (n = 20–22 per group, t42 = 3.776, P < 0.001 for CON + Saline group; t40 = –0.035, P = 0.972 for VPA + Saline group; t42 = 1.448, P = 0.155 for VPA + MS-275 group). Each experiment was repeated at least three times. The values are means ± SEMs. One-way ANOVA with Bonferroni post hoc test (A–F), Student’s t-test (G,H), *P < 0.05, **P < 0.01, ***P < 0.001, ns, not significant; VPA, valproic acid; PFC, prefrontal cortex; LTP, long-term potentiation; fEPSP, field excitatory postsynaptic potentials; HFS, high frequency train stimulation; PND, Postnatal Day.
FIGURE 7
FIGURE 7
Changes in RARα expression levels, homeostatic synaptic plasticity and autism-like behaviors in VPA-exposed offspring following RA intervention. (A) RA levels in the PFC from the CON + Corn Oil, VPA + Corn Oil, and VPA + RA groups, as quantitated using UPLC-MS/MS (n = 5 per group). (B) Western blot and quantification analyses of RARα protein in the PFC from the CON + Corn Oil, VPA + Corn Oil, and VPA + RA groups (n = 3 per group). (C) Western blot and quantification analyses of GluN2A, GluA1, and SYN1 protein in the PFC of offspring from the CON + Corn Oil, VPA + Corn Oil, and VPA + RA groups (n = 3 per group). (D) Summary graphs of PFC LTP in the CON + Corn Oil, VPA + Corn Oil, and VPA + RA groups (n = 9 slices from four rats per group). (E) LTP magnitude was measured as an average potentiation at 41–45 min after the onset of HFS induction (n = 9 slices from four rats per group). (F–J) Behavioral tests were performed in offspring from the CON + Corn Oil, VPA + Corn Oil, and VPA + RA groups beginning at PND 43. (F) The tracing and total distance traveled in the open-field test (n = 20–22 per group, F2,57 = 0.356, P = 0.702). (G) The time spent in the central zone in the open-field test (n = 20–22 per group, F2,57 = 12.511, P < 0.001). (H) The time spent self-grooming in the open-field test (n = 20–22 per group, F2,58 = 5.709, P = 0.005). (I) The tracing and social interaction in the three-chamber test (stimulus: a stranger rat vs. an object) (n = 20–22 per group, t38 = 9.079, P < 0.001 for CON + Corn Oil group; t38 = –0.191, P = 0.85 for VPA + Corn Oil group; t42 = 7.214, P < 0.001 for VPA + RA group). (J) The tracing and recognition of social novelty in the three-chamber test (stimulus: a stranger rat vs. a familiar rat) (n = 20–22 per group, t38 = 3.366, P = 0.002 for CON + Corn Oil group; t38 = –0.836, P = 0.408 for VPA + Corn Oil group; t40 = 2.243, P = 0.031 for VPA + RA group). Each experiment was repeated at least three times. The values are means ± SEMs. One-way ANOVA with Bonferroni post hoc test (A–H), Student’s t-test (I,J), *P < 0.05, **P < 0.01, ***P < 0.001, ns = not significant; VPA, valproic acid; PFC, prefrontal cortex; RA, retinoic acid; LTP, long-term potentiation; fEPSP, field excitatory postsynaptic potentials; HFS, high frequency train stimulation; PND, postnatal day.

Similar articles

Cited by

References

    1. Aoto J., Nam C. I., Poon M. M., Ting P., Chen L. (2008). Synaptic signaling by all-trans retinoic acid in homeostatic synaptic plasticity. Neuron 60 308–320. 10.1016/j.neuron.2008.08.012 - DOI - PMC - PubMed
    1. Autism Spectrum Disorders Working Group of The Psychiatric Genomics Consortium (2017). Meta-analysis of GWAS of over 16,000 individuals with autism spectrum disorder highlights a novel locus at 10q24.32 and a significant overlap with schizophrenia. Mol. Autism 8:21. 10.1186/s13229-017-0137-9 - DOI - PMC - PubMed
    1. Bagni C., Zukin R. S. (2019). A Synaptic perspective of fragile x syndrome and autism spectrum disorders. Neuron 101 1070–1088. 10.1016/j.neuron.2019.02.041 - DOI - PMC - PubMed
    1. Beggiato A., Peyre H., Maruani A., Scheid I., Rastam M., Amsellem F., et al. (2017). Gender differences in autism spectrum disorders: Divergence among specific core symptoms. Autism Res. 10 680–689. 10.1002/aur.1715 - DOI - PubMed
    1. Chanda S., Ang C. E., Lee Q. Y., Ghebrial M., Haag D., Shibuya Y., et al. (2019). Direct reprogramming of human neurons identifies MARCKSL1 as a pathogenic mediator of valproic acid-induced teratogenicity. Cell Stem Cell 25 103–119.e106. 10.1016/j.stem.2019.04.021 - DOI - PMC - PubMed

LinkOut - more resources