. 2021 Apr 30:15:657465.
doi: 10.3389/fnins.2021.657465. eCollection 2021.

Novel Insight Into the Role of Immune Dysregulation in Amyotrophic Lateral Sclerosis Based on Bioinformatic Analysis

Affiliations

Novel Insight Into the Role of Immune Dysregulation in Amyotrophic Lateral Sclerosis Based on Bioinformatic Analysis

Yongzhi Xie et al. Front Neurosci. .

Abstract

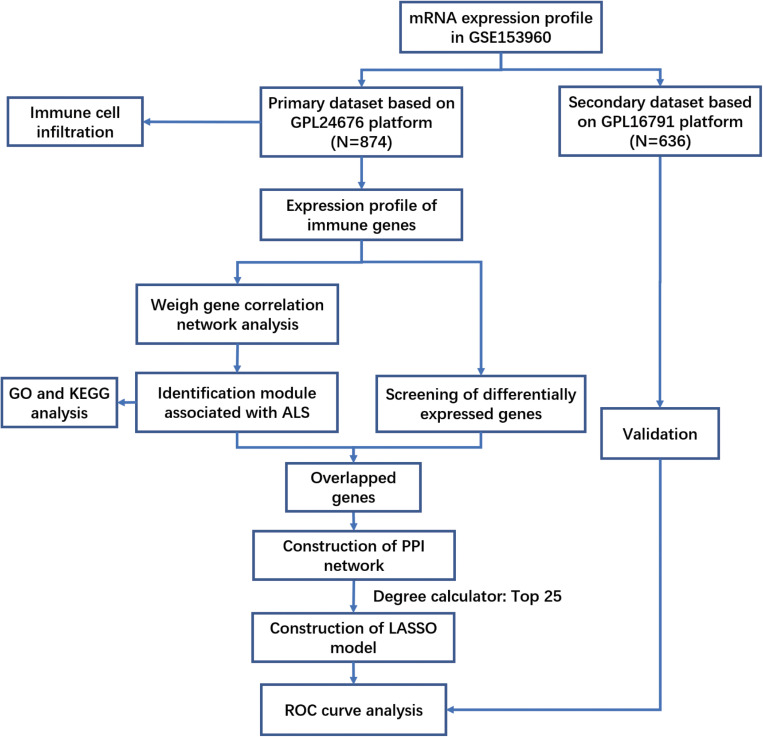
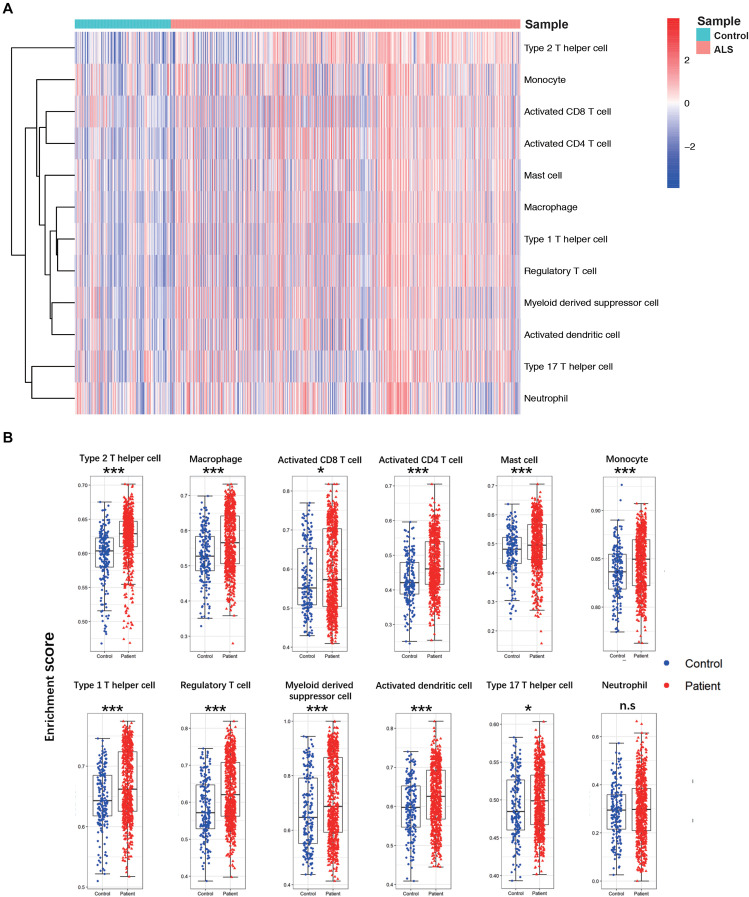
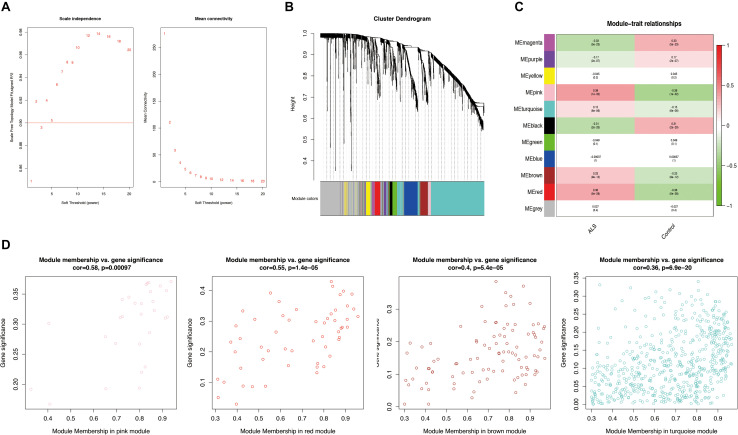
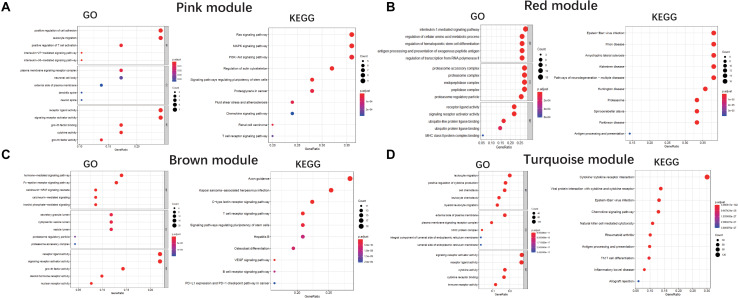
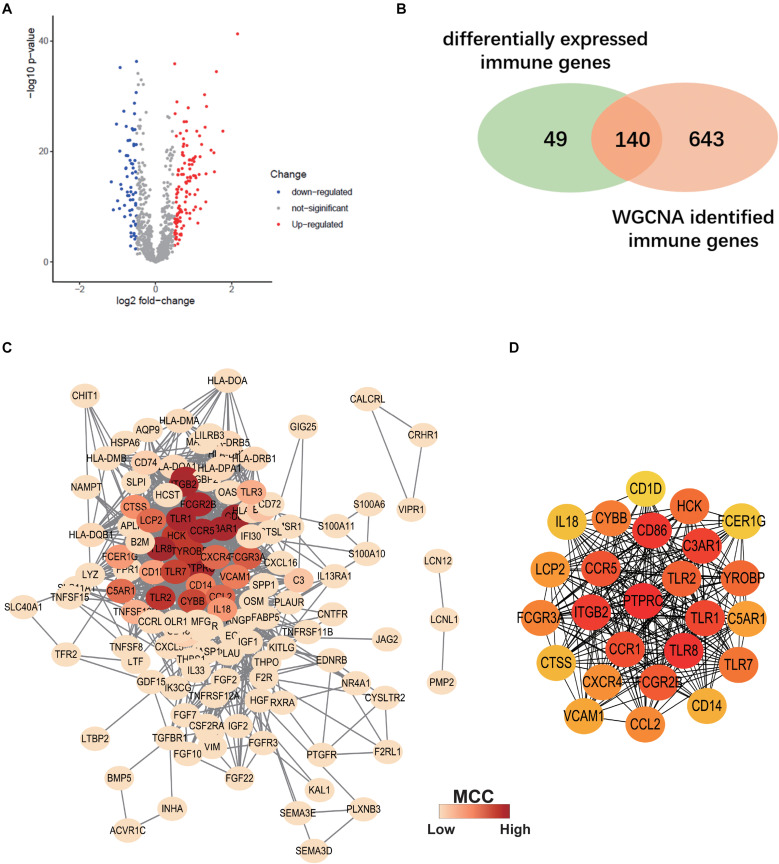
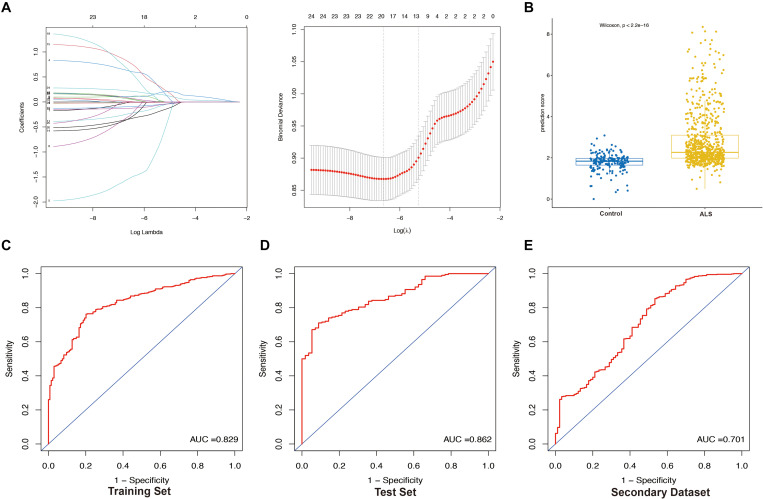
Amyotrophic lateral sclerosis (ALS) is a fatal neurodegenerative disorder characterized by the progressive degeneration of motor neurons. The causative pathogenic mechanisms in ALS remain unclear, limiting the development of treatment strategies. Neuroinflammation and immune dysregulation were involved in the disease onset and progression of several neurodegenerative disorders, including ALS. In this study, we carried out a bioinformatic analysis using publicly available datasets from Gene Expression Omnibus (GEO) to investigate the role of immune cells and genes alterations in ALS. Single-sample gene set enrichment analysis revealed that the infiltration of multiple types of immune cells, including macrophages, type-1/17 T helper cells, and activated CD4 + /CD8 + T cells, was higher in ALS patients than in controls. Weighted gene correlation network analysis identified immune genes associated with ALS. The Gene Ontology analysis revealed that receptor and cytokine activities were the most highly enriched terms. Pathway analysis showed that these genes were enriched not only in immune-related pathways, such as cytokine-cytokine receptor interaction, but also in PI3K-AKT and MAPK signaling pathways. Nineteen immune-related genes (C3AR1, CCR1, CCR5, CD86, CYBB, FCGR2B, FCGR3A, HCK, ITGB2, PTPRC, TLR1, TLR2, TLR7, TLR8, TYROBP, VCAM1, CD14, CTSS, and FCER1G) were identified as hub genes based on least absolute shrinkage and selection operator analysis. This gene signature could differentiate ALS patients from non-neurological controls (p < 0.001) and predict disease occurrence (AUC = 0.829 in training set; AUC = 0.862 in test set). In conclusion, our study provides potential biomarkers of ALS for disease diagnosis and therapeutic monitoring.

Keywords: LASSO; WGCNA; amyotrophic lateral sclerosis; bioinformatics; immune; ssGSEA.


Conflict of interest statement

The authors declare that the research was conducted in the absence of any commercial or financial relationships that could be construed as a potential conflict of interest.

Figures

FIGURE 1
FIGURE 1
The workflow of this study.
FIGURE 2
FIGURE 2
The landscape of immune cell infiltration between ALS patients and non-neurological control subjects. (A) A heatmap of 12 immune cell infiltration based on single-sample gene set enrichment analysis. (B) Boxplot of comparisons of 12 immune-cell enrichment scores. The enrichment score of macrophages, Tregs, Th1, Th2, Th17, activated CD4 + T cells, activated CD8 + T cells, monocytes, activated dendritic cells, and mast cells myeloid-derived suppressor cells were higher in ALS patients than non-neurological control. *p < 0.05, **p < 0.01, ***p < 0.001.
FIGURE 3
FIGURE 3
Weighted gene correlation network analysis (WGCNA). (A) Analysis of the scale-free network for various soft-thresholding powers (β). A power with the degree of scale independence > 0.9 was considered suitable for constructing the network. (B) Identification of co-expression gene modules. The branches of the dendrogram cluster into 11 modules and each one was labeled in a unique color. (C) A heatmap showing the correlation between each module eigengene and phenotype. Four modules were positively correlated with ALS-namely, pink, turquoise, brown, and red modules. Red indicates positive correlation and green indicates negative correlation. (D) Scatter plot of module eigengenes in the pink, red, brown, and turquoise modules. All these four modules significantly correlated with ALS (p < 0.05).
FIGURE 4
FIGURE 4
GO and KEGG analysis. Gene Ontology and KEGG enrichment analysis of pink module (A), red module (B), brown module (C), and turquoise module (D), respectively. The color indicates the adjusted p value, and the size of dots represents the number of the genes. BP, biological process; CC, cellular component; MF, molecular function.
FIGURE 5
FIGURE 5
Construction of Protein-protein interaction (PPI) Network. (A) Volcano plot of differentially expressed immune-related genes (IRGs) between ALS patients and non-neurological control subjects. Blue dots represent down-regulated genes (66 genes), red dots represent upregulated genes (123 genes), and gray dots represent no significantly differentially expressed genes. (B) Venn diagram of overlapping differentially expressed IRGs and ALS-related IRGs derived from WGCNA. (C) The PPI network consists of 130 nodes and 1066 edges. Color represents the degree of Maximal Clique Centrality (MCC) calculated by Cytohubba. Red indicates nodes with high MCC score. (D) Twenty-five genes with the highest MCC score in this PPI network and their interactions.
FIGURE 6
FIGURE 6
Construction and validation of LASSO model. (A) Construction of LASSO model. (B) Boxplot was used to visualize the predictive performance of model. Each dot represents the prediction score of each person based on LASSO analysis. Receiver operating characteristic (ROC) curves analysis of predicting the occurrence of ALS. The area under the curve (AUC) was 0.829 in the training set (N = 614) (C); 0.862 in the test set (N = 260) (D); 0.701 in the secondary dataset (N = 636) (E).

References

    1. Andersson A., Remnestål J., Nellgård B., Vunk H., Kotol D., Edfors F., et al. (2019). Development of parallel reaction monitoring assays for cerebrospinal fluid proteins associated with Alzheimer’s disease. Clin. Chim. Acta 494 79–93. 10.1016/j.cca.2019.03.243 - DOI - PubMed
    1. Andrés-Benito P., Moreno J., Domínguez R., Aso E., Povedano M., Ferrer I. (2017). Inflammatory gene expression in whole peripheral blood at early stages of sporadic amyotrophic lateral sclerosis. Front. Neurol. 8:546. 10.3389/fneur.2017.00546 - DOI - PMC - PubMed
    1. Barbie D. A., Tamayo P., Boehm J. S., Kim S. Y., Moody S. E., Dunn I. F., et al. (2009). Systematic RNA interference reveals that oncogenic KRAS-driven cancers require TBK1. Nature 462 108–112. 10.1038/nature08460 - DOI - PMC - PubMed
    1. Barrett T., Wilhite S. E., Ledoux P., Evangelista C., Kim I. F., Tomashevsky M., et al. (2013). NCBI GEO: archive for functional genomics data sets–update. Nucleic Acids Res. 41 D991–D995. 10.1093/nar/gks1193 - DOI - PMC - PubMed
    1. Beers D. R., Appel S. H. (2019). Immune dysregulation in amyotrophic lateral sclerosis: mechanisms and emerging therapies. Lancet Neurol. 18 211–220. 10.1016/s1474-4422(18)30394-6 - DOI - PubMed