. 2021 Apr 30:15:658480.
doi: 10.3389/fncel.2021.658480. eCollection 2021.

An Evolutionary Microcircuit Approach to the Neural Basis of High Dimensional Sensory Processing in Olfaction

Affiliations

An Evolutionary Microcircuit Approach to the Neural Basis of High Dimensional Sensory Processing in Olfaction

Gordon M Shepherd et al. Front Cell Neurosci. .

Abstract

Odor stimuli consist of thousands of possible molecules, each molecule with many different properties, each property a dimension of the stimulus. Processing these high dimensional stimuli would appear to require many stages in the brain to reach odor perception, yet, in mammals, after the sensory receptors this is accomplished through only two regions, the olfactory bulb and olfactory cortex. We take a first step toward a fundamental understanding by identifying the sequence of local operations carried out by microcircuits in the pathway. Parallel research provided strong evidence that processed odor information is spatial representations of odor molecules that constitute odor images in the olfactory bulb and odor objects in olfactory cortex. Paleontology provides a unique advantage with evolutionary insights providing evidence that the basic architecture of the olfactory pathway almost from the start ∼330 million years ago (mya) has included an overwhelming input from olfactory sensory neurons combined with a large olfactory bulb and olfactory cortex to process that input, driven by olfactory receptor gene duplications. We identify a sequence of over 20 microcircuits that are involved, and expand on results of research on several microcircuits that give the best insights thus far into the nature of the high dimensional processing.

Keywords: content addressable memory; evolution; lateral inhibition; mammalian paleontology; microcircuit; neuronal microcircuits; olfactory processing; sensory dimensionality.


Conflict of interest statement

The authors declare that the research was conducted in the absence of any commercial or financial relationships that could be construed as a potential conflict of interest.

Figures

FIGURE 1
FIGURE 1
The cellular composition and basic connectivity of the mammalian olfactory pathway according to Ramon y Cajal. A, olfactory sensory neuron; B, olfactory axon endings in olfactory glomerulus; C, mitral cell; D, granule cell; E, lateral olfactory tract; a, tufted cell; b, terminals of mitral cell recurrent axon branch; c, granule cell dendritic branches; e, mitral cell recurrent axon. On the right, the beginning of the anterior olfactory cortex and piriform cortex. Ramon y Cajal, Cajal Institute. From Cajal (1894); see also Figueres-Oñate et al. (2014).
FIGURE 2
FIGURE 2
Orderly spatial activity patterns elicited in the rodent glomerular sheet by different odor molecular types using different methods. (A) Schematic view of olfactory epithelium divided into four zones, with representative OSNs projecting to a single glomerulus in the olfactory bulb (OB). In the OB, fMRI activity patterns are elicited in the entire glomerular sheet by a four carbon aldehyde. Red: strong response; yellow: moderate response; blue: weak response. (B) Maps of activity elicited in the whole OB by 4, 5, and 6 carbon aldehydes. Brackets show the part of the lateral OB seen in (A). (C) Results of optical experiment limited to the rodent dorsal OB, recording intrinsic signals of responses to aldehydes of increasing carbon length, from short (red), medium (green), and long (blue) carbon chains. Map orientation of the dorsal OB is lateral up, medial down, anterior left, posterior right. (D) Intrinsic signals in the dorsal OB for stimulation with odors due to alcohols of increasing carbon lengths. The experiments confirmed burst firing of cells recorded in the circled areas. (A,B) Xu et al. (2003); (C,D) Uchida et al. (2000).
FIGURE 3
FIGURE 3
Microcircuit organization of a glomerular unit. B, Blanes (deep short- axon) cell; c, centrifugal axon; ET, external tufted cell; Gm, mitral connected granule cell; Gt, tufted cell connected granule cell; M, mitral cell; PGe, periglomerular cell (input from ET cell); PGo, periglomerular cell (input from OSN); sSA, superficial short-axon cell; T, middle tufted cell. Excitatory actions shown by red cells and terminals; inhibitory by blue cells and terminals. All cells except the M and T cells turn over during life. Note the multiple layers for lateral inhibitory and related processing actions. The complex patterns of glomerular synapses are under active investigation. From Shepherd et al. (2020), representing a synthesis of studies by multiple authors, including Cleland and Sethupathy (2006); Wachowiak and Shipley (2006), Migliore et al. (2010); Nagayama et al. (2014), Burton and Urban (2015), and Cavarretta et al. (2016).
FIGURE 4
FIGURE 4
Example of a microcircuit function: lateral inhibition in the retina and olfactory bulb. (A) Lateral inhibition in the retina; central excitation of a retinal ganglion cell is surrounded by inhibition, a classical example of spatial contrast enhancement, a fundamental operation in processing spatial patterns in sensory systems. From Kuffler (1953). Center-surround inhibition also underlies color contrast mechanisms in the retina (see text). (B) Example of contrast enhancement by “lateral” inhibition in the olfactory bulb, in a chemical series of aldehydes of differing carbon lengths, which heightens contrast between odor molecules by excitation of a mitral cell by one odor molecule type (n-hexylaldehyde 6CHO) and inhibiting responses to neighboring related odor molecules (4)CHO and (8)CHO in the series. Based on Yokoi et al. (1995).
FIGURE 5
FIGURE 5
Update of Cajal’s olfactory pathway in Figure 1 based on new knowledge of microcircuits. Close interactions between olfactory bulb and olfactory cortex can be seen to form a multiregional multidimensional processing unit underlying olfactory perception. Red indicates excitatory synaptic action, blue inhibitory synaptic action. Arrows indicate direction of impulse propagation and synaptic action. GLOM, glomeruli; GC, granule cell; INH, inhibitory interneuron; LOT, lateral olfactory tract; MOD, modulatory systems; MT, mitral/tufted cell; PN, pyramidal neuron; OFC, orbitofrontal cortex. Asterisk denotes excitatory inputs to the granule cell from multiple sources (see text). Note that lateral circuits in the olfactory cortex for processing the sensory input from the LOT are in the excitatory and inhibitory layers closest to the LOT, whereas circuits for associative processing are closest to the PN cell bodies. Feedforward inhibition predominates in the APC, inhibitory feedback in the PPC. Based on many authors (see text).
FIGURE 6
FIGURE 6
(A) Overview of mitral cell axon projecting to the posterior piriform cortex (PPC), and reconstructed axonal arbors of two neighboring layer II pyramidal cells. Stained by in vivo intracellular injection in the rat. Note that association axons extend through most of the piriform cortex as well as to distant regions with different output functions. (B) Plots of depth of association fibers of 5 identified layer II pyramidal cells. Note that fibers from posterior piriform cortex are densest in layer III among pyramidal cell bodies and basal dendrites and inhibitory interneurons, whereas association fibers from anterior piriform cortex connect to apical dendrites near the sensory input from the LOT. AON, anterior olfactory nucleus; APC, anterior piriform cortex; PPC, posterior piriform cortex; and olfactory tubercle are three-layer cortex, Neocortex is six-layer cortex. See text. From Haberly (2001).
FIGURE 7
FIGURE 7
Early evolution of the forebrain dominated by the olfactory cortex. (A) Dorsal view of the forebrain of a reptile (turtle), showing the three main areas: olfactory, hippocampal, and dorsal (visual). (B) Lateral view of reconstructed mammalian “ancestral forebrain cortex”: OF, orbitofrontal area; MF, medial frontal area; S1, S2, RS, CS: primary, secondary, dorsal and caudal somatosensory areas; g, gustatory area; V1, V2, T: primary, secondary and temporal visual areas; Aud, auditory areas; CCv, CCd; ventral and dorsal cingulate areas; RSg, RSa, retrosplenial granular area and agranular areas; SC, superior colliculus; IC, inferior colliculus. (A) Based on Shepherd (2011). (B) Based on Molnar et al. (2014).
FIGURE 8
FIGURE 8
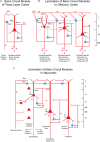
From three-layer to six-layer cortical microcircuits. (A) Simplified basic cortical module of ancestral three-layer olfactory cortex, hippocampus and dorsal cortex. This is the basic cell organization of these three areas shown in Figure 7. Based on Kriegstein and Connors (1986) and Shepherd (2011). PC, pyramidal cell. Abbreviations of functional actions: ffexc, feedforward excitation; ffinh, feedforward inhibition; fbexc, feedback excitation; fbinh, feedback inhibition; lexc, lateral excitation; linh, lateral inhibition. (B) Olfactory cortex: lamination of basic circuit modules. (C) Mammalian neocortex: lamination of basic circuit modules. Abbreviations as in (A). Laminae for the cell types are indicated. Presumed excitatory cells shown in red, inhibitory cells shown in blue. Based on Shepherd (1988) and Shepherd and Rowe (2017). Martin-Lopez et al. (2019) have shown how the piriform laminae follow a selective developmental and migratory program established by cell lineage.

Similar articles

Cited by

References

    1. Allison A. C. (1953). The morphology of the olfactory system in vertebrates. Biol. Rev. 28 195–277. 10.1111/j.1469-185x.1953.tb01376.x - DOI
    1. Araneda R. C., Kini A. D., Firestein S. (2000). The molecular receptive range of an odorant receptor. Nat. Neurosci. 3 1248–1255. 10.1038/81774 - DOI - PubMed
    1. Aungst J. L., Heyward P. M., Puche A. C., Karnup S. V., Hayar A., Szabo G., et al. (2003). Centre-surround inhibition among olfactory bulb glomeruli. Nature 426 623–629. 10.1038/nature02185 - DOI - PubMed
    1. Bai J., Ramos R. L., Paramasivam M., Siddiqi F., Ackman J. B., LoTurco J. J. (2008). The role of DCX and LIS1 in migration through the lateral cortical stream of developing forebrain. Dev. Neurosci. 30 144–156. 10.1159/000109859 - DOI - PubMed
    1. Balu R., Pressler R. T., Strowbridge B. W. (2007). Multiple modes of synaptic excitation of olfactory bulb granule cells. J. Neurophysiol. 27 5621–5632. 10.1523/jneurosci.4630-06.2007 - DOI - PMC - PubMed

LinkOut - more resources