. 2021 Apr 28:15:643287.
doi: 10.3389/fnana.2021.643287. eCollection 2021.

TRPM4 Expression During Postnatal Developmental of Mouse CA1 Pyramidal Neurons

Affiliations

TRPM4 Expression During Postnatal Developmental of Mouse CA1 Pyramidal Neurons

Denise Riquelme et al. Front Neuroanat. .

Abstract

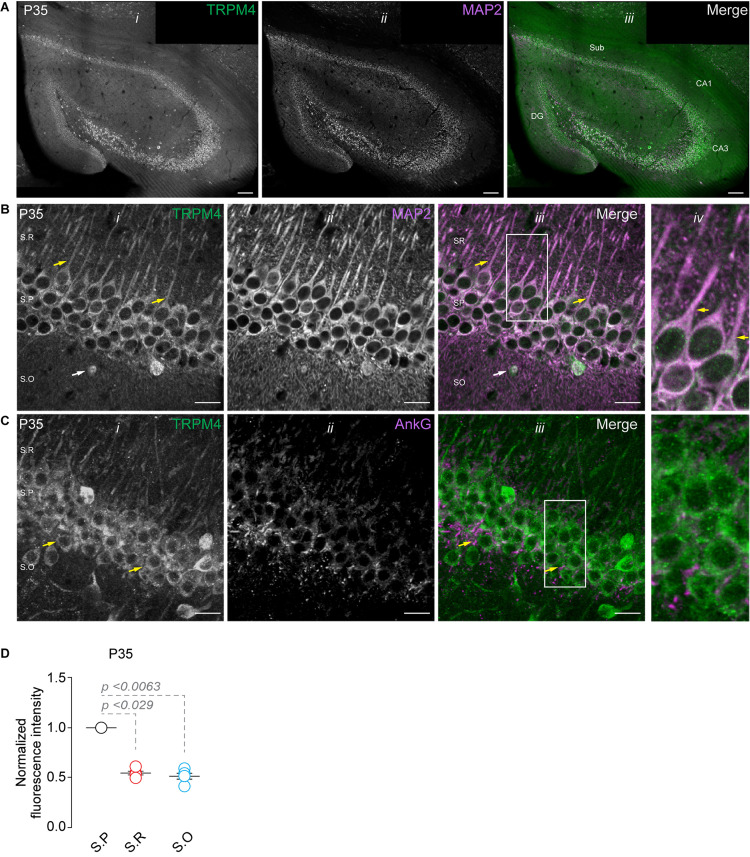
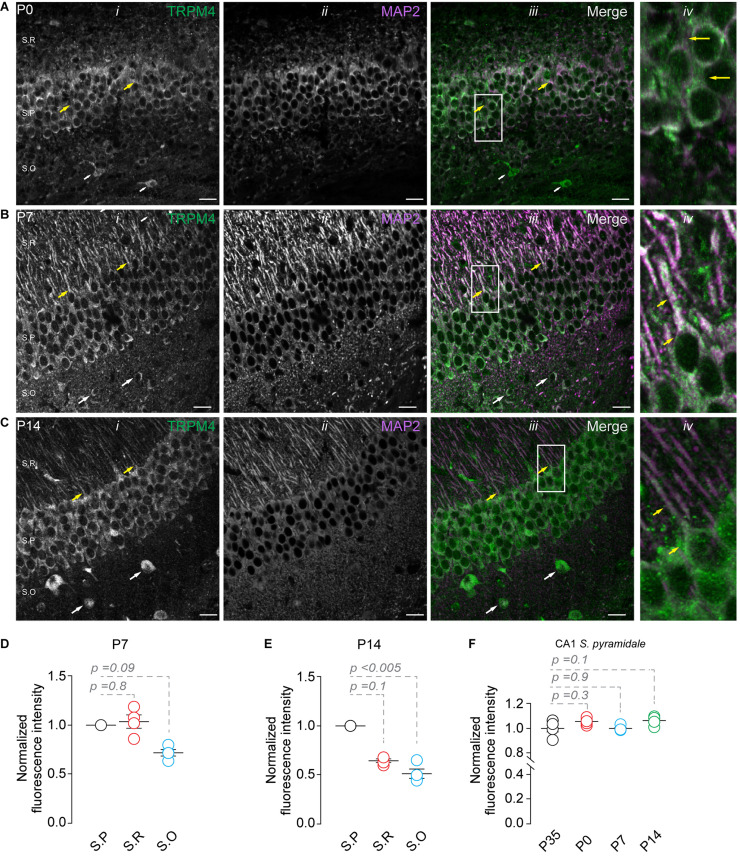
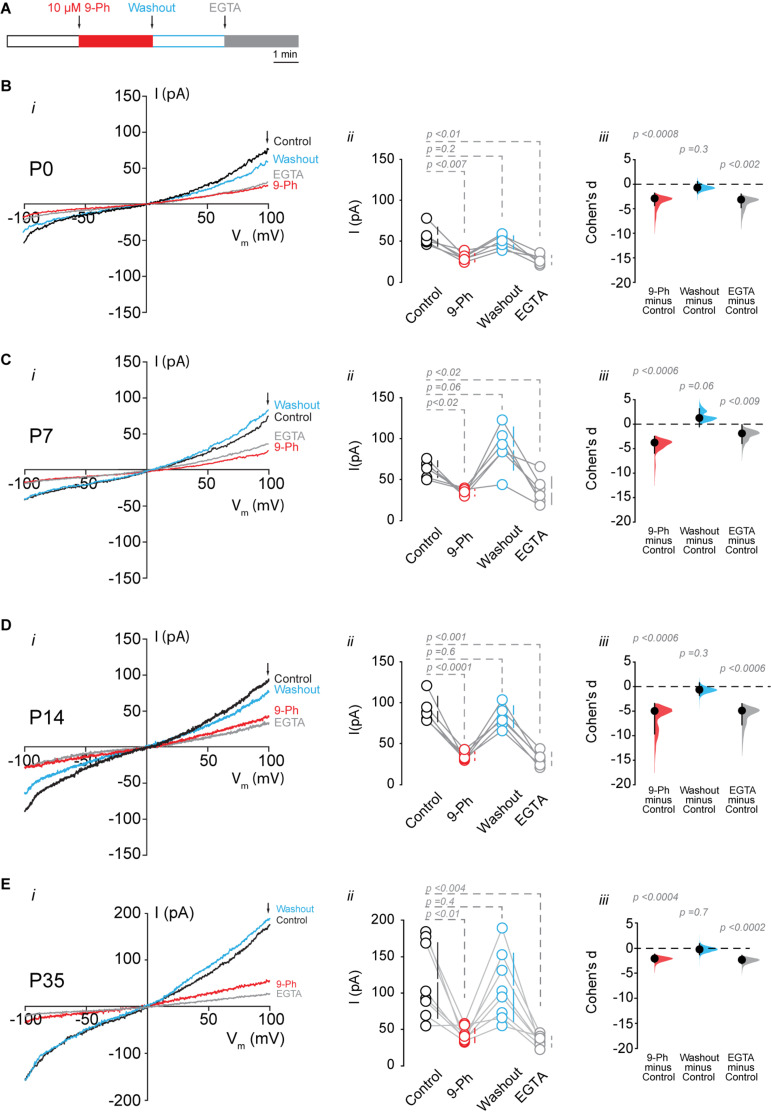
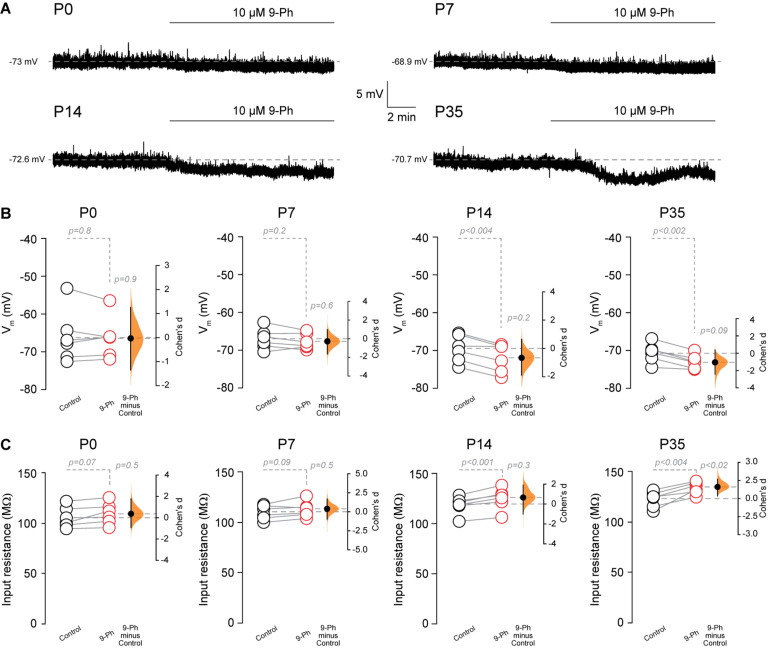
TRPM4 is a non-selective cation channel activated by intracellular calcium and permeable to monovalent cations. This channel participates in the control of neuronal firing, neuronal plasticity, and neuronal death. TRPM4 depolarizes dendritic spines and is critical for the induction of NMDA receptor-dependent long-term potentiation in CA1 pyramidal neurons. Despite its functional importance, no subcellular localization or expression during postnatal development has been described in this area. To examine the localization and expression of TRPM4, we performed duplex immunofluorescence and patch-clamp in brain slices at different postnatal ages in C57BL/6J mice. At P0 we found TRPM4 is expressed with a somatic pattern. At P7, P14, and P35, TRPM4 expression extended from the soma to the apical dendrites but was excluded from the axon initial segment. Patch-clamp recordings showed a TRPM4-like current active at the resting membrane potential from P0, which increased throughout the postnatal development. This current was dependent on intracellular Ca2+ (I CAN ) and sensitive to 9-phenanthrol (9-Ph). Inhibiting TRPM4 with 9-Ph hyperpolarized the membrane potential at P14 and P35, with no effect in earlier stages. Together, these results show that TRPM4 is expressed in CA1 pyramidal neurons in the soma and apical dendrites and associated with a TRPM4-like current, which depolarizes the neurons. The expression, localization, and function of TRPM4 throughout postnatal development in the CA1 hippocampal may underlie an important mechanism of control of membrane potential and action potential firing during critical periods of neuronal development, particularly during the establishment of circuits.

Keywords: CA1; ICAN; TRPM4; hippocampus; pyramidal neurons.


Conflict of interest statement

The authors declare that the research was conducted in the absence of any commercial or financial relationships that could be construed as a potential conflict of interest.

Figures

FIGURE 1
FIGURE 1
TRPM4 expression in CA1 pyramidal neurons at P35. Confocal images showing double labeling of (A) TRPM4 (Alexa 488, green, i) with MAP2 (Alexa 546, magenta, ii), merged signals (iii), in the whole hippocampal area. (B) Shows the expression of TRPM4 (i) MAP2 (ii) and the merged signals (iii) in area CA1, and (iv) shows a zoomed area (white rectangle); yellow arrowheads show neurons in the stratum pyramidale and the distribution in the soma and proximal apical dendrite, white arrowhead show the distribution in the stratum oriens, showing the expression in the somatic region of the neurons. (C) Shows the expression of TRPM4 (Alexa 488, green, i) and AnkG (Alexa 546, magenta, ii) and the merged signals (iii), and (iv) shows a zoomed area (white rectangle). (D) Graph of normalized fluorescence intensity of TRPM4 in S.P, S.R, and S.O of area CA1. Fluorescence intensity values were normalized to CA1 S.P for each mouse. Each point corresponds to an individual mouse (Kruskal–Wallis followed by Dunn’s post hoc test vs. CA1 S.P; n = 5 mice). S.P, stratum pyramidale; S.R, stratum radiatum; and S.O, stratum oriens. Calibration bars = 100 μm in (A), and 20 μm in (B,C).
FIGURE 2
FIGURE 2
TRPM4 expression in CA1 pyramidal neurons during postnatal development. Confocal images showing double labeling of TRPM4 (Alexa 488, green, i) with MAP2 (Alexa 546, magenta, ii), the merged signals (iii), and (iv) shows a zoomed area (white rectangle), yellow arrowheads showed neurons in the stratum pyramidale and the distribution in the soma and proximal apical dendrite; white arrowhead shows the distribution in the stratum oriens, showing the expression in the somatic region of the neurons. (A) Shows the expression of TRPM4 and MAP 2 at P0, (B) Shows the expression at P7, and (C) Shows the expression at P14. (D,E) Graphs of normalized fluorescence intensity of TRPM4 in S.P, S.R, and S.O of area CA1 of P7 and P14. Fluorescence intensity values were normalized to CA1 S.P. for each mouse. Each point corresponds to an individual mouse (Kruskal Wallis followed by Dunn’s post hoc test vs. CA1 S.P; n = 4 mice). (F) Graph of normalized fluorescence intensity of TRPM4 in S.P, from P0, P7, P14, and P35 mice. Fluorescence intensity values were normalized to mean intensity values of CA1 S.P of P35 mice. Each point corresponds to an individual mouse (Kruskal Wallis followed by Dunn’s post hoc test vs. CA1 S.P, P35; n = 4–5 mice). S.P, stratum pyramidale; S.R, stratum radiatum; and S.O, stratum oriens. Calibration bars = 20 μm.
FIGURE 3
FIGURE 3
TRPM4 functional expression in CA1 pyramidal neurons during postnatal development. Current recordings in CA1 pyramidal neurons in response to a somatic voltage-ramp (−100 to 100 mV from a holding potential of −70 mV), glutamatergic transmission and action potential generation was inhibited (see section “Methods”). Neurons were recorded in a nystatin-perforated patch configuration (control, 9-Ph and washout) and after breaking the membrane to enter whole cell configuration, which allows EGTA diffusion (EGTA). (A) Diagram of the experimental protocol used in the electrophysiological recordings. (B) Shows the currents recorded at P0 (n = 6), (C) shows the currents at P7 (n = 6), (D) shows the currents at P14 (n = 6), and (E) shows the currents at P35 (n = 8). (i) Each representative current trace was obtained from CA1 pyramidal neurons (stratum pyramidale) after different treatments (Control, 9-Ph, Washout, EGTA); arrowhead shows where the current was measured. (ii) Summary plot of the current in the different treatments, vertical lines show the 95% CI (statistical difference were determined using a one-way ANOVA, p-values are show above each group). (iii) Cohen’s d for 3 comparisons against the shared control. Mean difference is depicted as a dot, the vertical bar shows the 95% CI as indicated by the end of the vertical error bars, and the p-values are shown above each point, depicting results of a two-sided permutation t-test. Each point corresponds to an individual mouse (1 slice per mouse).
FIGURE 4
FIGURE 4
TRPM4 inhibition hyperpolarizes CA1 pyramidal neurons during postnatal development. (A) Representative perforated-patch voltage trace recorded in pyramidal neurons showing the effect of 10 μM 9-Ph at P0, P7, P14, and P35. (B) Summary plots showing resting membrane potential and the effect of 10 μM 9-Ph at P0 (n = 6), P7 (n = 6), P14 (n = 6), and P35 (n = 6). (C) Summary plots showing the effect of 9-Ph on the input resistance at P0 (n = 6), P7 (n = 6), P14 (n = 6), and P35 (n = 6; statistical difference were determined using a one-way ANOVA, p-values are show above each group). On the right side of each plot the paired mean difference between the conditions is shown; the mean difference is depicted as a dot; the 95% confidence interval is indicated by the end of the vertical error bar. Statistical differences were evaluated using paired t-test and p-values are shown above. Each point corresponds to an individual mouse (1 slice per mouse).

Similar articles

Cited by

References

    1. Andersen P., Morris R., Amaral D., Bliss T., O’Keefe J. (2006). The Hippocampus Book. Illustrated Edition. Oxford: Oxford University Press.
    1. Arrigoni E., Greene R. W. (2004). Schaffer collateral and perforant path inputs activate different subtypes of NMDA receptors on the same CA1 pyramidal cell. Br. J. Pharmacol. 142 317–322. 10.1038/sj.bjp.0705744 - DOI - PMC - PubMed
    1. Bender R. A., Galindo R., Mameli M., Gonzalez-Vega R., Valenzuela C. F., Baram T. Z. (2005). Synchronized network activity in developing rat hippocampus involves regional hyperpolarization-activated cyclic nucleotide-gated (HCN) channel function. Eur. J. Neurosci. 22 2669–2674. 10.1111/j.1460-9568.2005.04407.x - DOI - PMC - PubMed
    1. Bovet-Carmona M., Krautwald K., Menigoz A., Vennekens R., Balschun D., Angenstein F. (2019). Low frequency pulse stimulation of Schaffer collaterals in Trpm4-/- knockout rats differently affects baseline BOLD signals in target regions of the right hippocampus but not BOLD responses at the site of stimulation. Neuroimage 188 347–356. 10.1016/j.neuroimage.2018.12.020 - DOI - PubMed
    1. Bovet-Carmona M., Menigoz A., Pinto S., Tambuyzer T., Krautwald K., Voets T., et al. (2018). Disentangling the role of TRPM4 in hippocampus-dependent plasticity and learning: an electrophysiological, behavioral and FMRI approach. Brain Struct. Funct. 223 3557–3576. 10.1007/s00429-018-1706-1 - DOI - PubMed