Review
. 2021 Apr 28:15:665052.
doi: 10.3389/fnsys.2021.665052. eCollection 2021.

A Neural Model of Intrinsic and Extrinsic Hippocampal Theta Rhythms: Anatomy, Neurophysiology, and Function

Affiliations
Review

A Neural Model of Intrinsic and Extrinsic Hippocampal Theta Rhythms: Anatomy, Neurophysiology, and Function

Stephen Grossberg. Front Syst Neurosci. .

Abstract

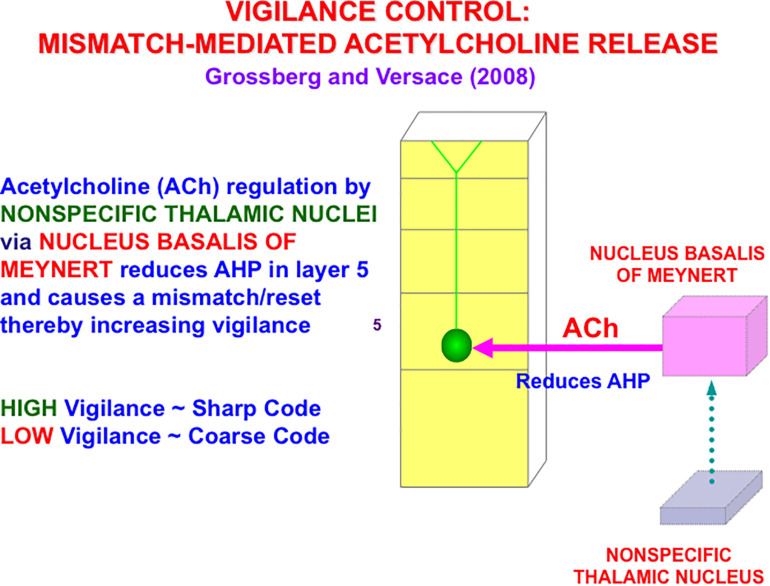
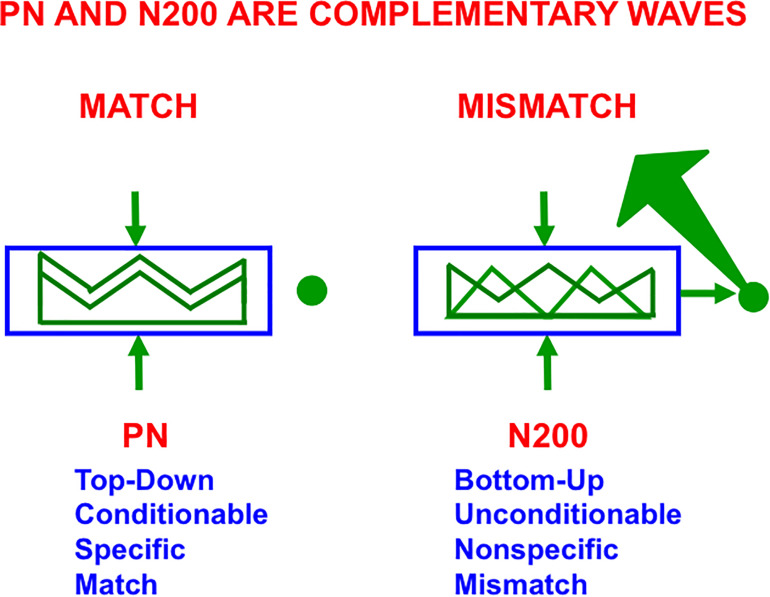
This article describes a neural model of the anatomy, neurophysiology, and functions of intrinsic and extrinsic theta rhythms in the brains of multiple species. Topics include how theta rhythms were discovered; how theta rhythms organize brain information processing into temporal series of spatial patterns; how distinct theta rhythms occur within area CA1 of the hippocampus and between the septum and area CA3 of the hippocampus; what functions theta rhythms carry out in different brain regions, notably CA1-supported functions like learning, recognition, and memory that involve visual, cognitive, and emotional processes; how spatial navigation, adaptively timed learning, and category learning interact with hippocampal theta rhythms; how parallel cortical streams through the lateral entorhinal cortex (LEC) and the medial entorhinal cortex (MEC) represent the end-points of the What cortical stream for perception and cognition and the Where cortical stream for spatial representation and action; how the neuromodulator acetylcholine interacts with the septo-hippocampal theta rhythm and modulates category learning; what functions are carried out by other brain rhythms, such as gamma and beta oscillations; and how gamma and beta oscillations interact with theta rhythms. Multiple experimental facts about theta rhythms are unified and functionally explained by this theoretical synthesis.

Keywords: Adaptive Resonance Theory; adaptively timed learning; entorhinal cortex; grid cell; hippocampus; learning; place cell; spatial navigation.


Conflict of interest statement

The author declares that the research was conducted in the absence of any commercial or financial relationships that could be construed as a potential conflict of interest.

Figures

FIGURE 1
FIGURE 1
Simulated responses of illustrative model (A) stripe cells, (B) grid cells, and (C) place cells in the spiking self-organizing map (SOM) model. The first column shows the realistic trajectory of the animat (blue lines and curves) on which are superimposed spikes (red dots) of firing cells. The second and third columns show unsmoothed and smoothed spatial rate maps of the cells, respectively. Color coding from blue (minimum) to red (maximum) firing generates each rate map (reprinted with permission from Pilly and Grossberg, 2013).
FIGURE 2
FIGURE 2
The GridPlaceMap is defined by a hierarchy of self-organizing maps (SOM) whereby grid cells and place cells are learned and activated. Stripe cells Sdps occur in the deeper layer of medial entorhinal cortex (MEC), grid cells Gjs occur in layer II of MEC, and place cells Pk occur in hippocampal area CA3. Multiple stripe cells drive learning of individual grid cells, and multiple grid cells drive learning of individual place cells. Place cells can thereupon represent movements in large spaces in response to internally generated linear velocity [v(t)] and angular velocity [Φ(t)] movements through the environment. Bigger stripe fields and spacings occur from dorsal to ventral positions in the model (reprinted with permission from Grossberg and Pilly, 2014).
FIGURE 3
FIGURE 3
Linear velocity path integration. (A) Linear velocity path integration signals input to a ring attractor neural circuit that translates them into an activity bump that moves from cell to cell along the ring. (B) Firing rate map of an illustrative stripe cell with a spacing of 35 cm whose firing fields respond to translational movement with a component along either 135o or −45o. (C) Activities of stripe cells of five different spatial phases (see colors) as a function of displacement from the origin along their preferred direction. (D) Real rat trajectory from Sargolini et al. (2006) of ∼10 min in a 100 cm × 100 cm environment that was used to train the model. The red segment depicts the straight path prefixed to the original trajectory to ensure the animat starts from the midpoint of the environment (reprinted with permission from Pilly and Grossberg, 2012).
FIGURE 4
FIGURE 4
Data showing effects of medial septum (MS) inactivation on grid cells and network theta oscillations in medial entorhinal cortex (MEC). (A) Examples of disruption of the hexagonal grid structure of two grid cells (Brandon et al., 2011). (B) Temporal reduction in the power and frequency of network theta oscillations (Koenig et al., 2011). (C) Temporary reduction in the gridness score, mean firing rate, and spatial stability of grid cells (Koenig et al., 2011) (data reprinted with permission from Brandon et al., 2011 and Koenig et al., 2011).
FIGURE 5
FIGURE 5
Data and computer simulation of effects of septal inactivation on grid cells. (A) Each row shows data and different data-derived measures of grid cell responsiveness, starting from the left with the baseline response to the middle column with maximal inhibition (Data reprinted with permission from Brandon et al., 2011). (B) Data showing the temporary reduction in the gridness scores during septal inactivation, followed by recovery (Data reprinted with permission from Koenig et al., 2011). (C) Simulation of gridness collapse due to reduction in cell response rates that mimic reduced cholinergic transmission. (D) Simulations of gridness score reduction by reducing cell response rates. (E) Simulations of gridness score reduction by changing leak conductance [simulations in (C–E) reprinted with permission from Grossberg and Pilly, 2014].
FIGURE 6
FIGURE 6
The entorhi nal-hippocampal system has properties of an Adaptive Resonance Theory, or ART, spatial category learning system. Hippocampal place cells learn spatial recognition categories in this system. Learned grid cell and place cell receptive fields are dynamically stabilized by top-down feedback that obeys the ART Matching Rule from CA1 place cells to entorhinal cortex (adapted with permission from Mhatre et al., 2012).
FIGURE 7
FIGURE 7
(A) The ART hypothesis testing and category learning cycle begins when an input pattern I is stored across feature detectors at level F1 as an activity pattern X, which is shown in yellow. For simplicity, arrays of connections between processing stages are represented by a single connection. While X is getting instated in F1, I also send excitatory signals via parallel pathways to the orienting system (the triangle with gain parameter ρ inside it). The gain parameter ρ is the vigilance parameter. As activity pattern X is instated in F1, it activates two output signal pathways: A bottom-up excitatory input pattern S to category level F2, and inhibitory inputs ρI to the orienting system. There are as many excitatory inputs as inhibitory inputs to the orienting system, because inputs I activate pattern X. The net input to the orienting system is ρ/I/ – /X/, where // denotes the size of each total input. This net input is not positive because ρ ≤ 1, so the orienting system remains quiet. Before activating a category in F2, bottom-up signals S are multiplied by learned adaptive weights (in the hemispherical synapses) to generate the input pattern T to category level F2. Inputs T are contrast-enhanced and normalized within F2 by a recurrent shunting on-center off-surround network that activates and stores a small number of cells within F2 that receive the largest inputs. The chosen cells represent category Y that codes feature pattern at F1. (B) Category Y generates top-down signals U that are multiplied by adaptive weights to form a prototype, critical feature pattern, or expectation V of what learned feature pattern to attend at F1. Expectation V delivers an excitatory modulatory signal to F1 cells in its on-center, while inhibiting F1 cells in its off-surround. Together, these signals embody the ART Matching Rule for object attention. The ART Matching Rule circuit ensures that category learning does not suffer from catastrophic forgetting. (C) If V mismatches I at F1, then the ART Matching Rule chooses a new STM activity pattern X* (the yellow pattern) at cells where the bottom-up and top-down patterns match. Mismatched features (white area) are inhibited. If the pattern X* of attended features across F1 represents a big enough mismatch to activate the orienting system (that is, if ρ/I/ – /X/ > 0), then a novelty-sensitive nonspecific arousal burst is activated there (cf. the N200 in Figure 10), which resets, or inhibits, the currently active category Y and drives hypothesis testing and memory search until another category is chosen (D) that supports a good enough match to keep the orienting system quiet while category learning occurs. If, however, in (B) a good enough match occurs between I and V to keep the orienting system quiet, then it reactivates the pattern Y at F2 which, in turn, reactivates X* at F1. Positive feedback loop hereby dynamically links, or binds, X* with Y. In both of these latter cases, a feature-category resonance focuses attention on the active critical feature pattern while learning it in both the bottom-up adaptive filter and top-down learned expectation (adapted with permission from Carpenter and Grossberg, 1987a).
FIGURE 8
FIGURE 8
The Synchronous Matching ART, or SMART, model describes how spiking neurons in a laminar cortical hierarchy interact with specific and nonspecific thalamic nuclei to learn perceptual or cognitive categories (reprinted with permission from Grossberg and Versace, 2008).
FIGURE 9
FIGURE 9
A big enough thalamocortical and corticocortical mismatch activates the nonspecific thalamic nucleus, which in turn activates the nucleus basalis of Meynert. The nucleus basalis then and releases acetylcholine (ACh) into deeper layers, notably layer 5, of multiple cortical areas. ACh release increases vigilance by reducing afterhyperpolarization (AHP) currents (reprinted with permission from Grossberg and Versace, 2008).
FIGURE 10
FIGURE 10
The Processing Negativity, or PN, event-related potential obeys computationally complementary laws to the N200 event-related potential (see the text for details; reprinted with permission from Grossberg, 2017b).
FIGURE 11
FIGURE 11
(A) Multiple movement gaits are generated by suitably connected recurrent shunting on-center off-surround networks when they are activated by a volitional GO signal of variable size. Abbreviations in (B): LH, left hind; LF, left front; RH, right hind; RF, right front (see the text for details; reprinted with permission from Pribe et al., 1997).
FIGURE 12
FIGURE 12
A recurrent associative dipole, or READ, circuit is a recurrent shunting opponent processing network with habituative transmitter gates. The large closed disks represent opponent ON and OFF cells. The vertical rectangular bars that abut from them represent dendritic trees. Excitatory network pathways end in arrows. Inhibitory pathways end in closed disks. Habituative pathways end in squares. A nonspecific arousal input I equally excites the ON and OFF cells. A phasic input J activates only the ON cell in this circuit, but different phasic inputs can in general activate ON and OFF cells. Sensory cues Si sample the dendrites with LTM traces wi1 and wi2 and thereby become conditioned reinforcers when their abutting dendrite is activated by a back-propagating action potential (upward red arrow). Read-out from a conditioned reinforcer travels down the dendrite to the corresponding cell body (downward red arrow) (see the text for details; adapted with permission from Grossberg and Schmajuk, 1987).
FIGURE 13
FIGURE 13
Illustration of how the ON and OFF cells in a READ circuit or, more generally, the category learning cells in a SOM, interact with cue-activated adaptive signals on their dendritic trees. Each dendritic tree possesses dendritic spines upon which a large number of cue-activated adaptive signals can converge. When a cell is active, it can generate retrograde, or back-propagating, action potentials that act as teaching signals for the adaptive weights, or long-term memory (LTM) traces, of currently active cue-activated pathways at its dendritic spines (reprinted with permission from Grossberg, 2021).
FIGURE 14
FIGURE 14
Activation and learning dynamics on the dendritic spines of cells in a READ circuit or SOM. Green arrows depict currently active excitatory signals. Red arrows depict currently active inhibitory signals. The sizes of the arrows depict the relative strength of their signals (see the text for details; reprinted with permission from Grossberg, 2021).
FIGURE 15
FIGURE 15
The neurotrophic START, or nSTART, model. Multiple types of learning and neurotrophic mechanisms of memory consolidation cooperate in these circuits to generate adaptively timed responses. Connections from sensory cortex to orbitofrontal cortex support category learning. Reciprocal connections from orbitofrontal cortex to sensory cortex support attention. Habituative transmitter gates modulate excitatory conductances at all processing stages. Connections from sensory cortex to amygdala connections support conditioned reinforcer learning. Connections from amygdala to orbitofrontal cortex support incentive motivation learning. Hippocampal adaptive timing and brain-derived neurotrophic factor (BDNF) bridge temporal delays between CS offset and US onset during trace conditioning acquisition. BDNF also supports long-term memory (LTM) consolidation within sensory cortex to hippocampal pathways and from hippocampal to orbitofrontal pathways. The pontine nuclei serve as a final common pathway for reading-out conditioned responses. Cerebellar dynamics are not simulated in nSTART. arrowhead = excitatory synapse; hemidisk = adaptive weight; square = habituative transmitter gate (reprinted with permission from Grossberg, 2021).

Similar articles

Cited by

References

    1. Amaral D. G. (1993). Emerging principles of intrinsic hippocampal organization. Curr. Opin. Neurobiol. 3 225–229. 10.1016/0959-4388(93)90214-j - DOI - PubMed
    1. Amaral D. G., Witter M. P. (1989). The three-dimensional organization of the hippocampal formation: a review of anatomical data. Neuroscience 31 571–591. 10.1016/0306-4522(89)90424-7 - DOI - PubMed
    1. Ames H., Grossberg S. (2008). Speaker normalization using cortical strip maps: a neural model for steady state vowel categorization. J. Acoust. Soc. Am. 124 3918–3936. 10.1121/1.2997478 - DOI - PubMed
    1. Aminoff E., Gronau N., Bar M. (2007). The parahippocampal cortex mediates spatial and nonspatial associations. Cereb. Cortex 17 1493–1503. 10.1093/cercor/bhl078 - DOI - PubMed
    1. Banquet J.-P., Gaussier P., Cuperlier N., Hok V., Save T., Pucet B., et al. (2020). Time as the fourth dimension in the hippocampus. Prog. Neurobiol. 199:101920. 10.1016/j.pneurobio.2020.101920 - DOI - PubMed

LinkOut - more resources