

Case Report: Chemotherapy Indication in a Case of Neurofibromatosis Type 1 Presenting Optic Pathway Glioma: A One-Year Clinical Case Study Using Differential Tractography Approach
- PMID: 33994974
- PMCID: PMC8115022
- DOI: 10.3389/fnhum.2021.620439
Case Report: Chemotherapy Indication in a Case of Neurofibromatosis Type 1 Presenting Optic Pathway Glioma: A One-Year Clinical Case Study Using Differential Tractography Approach
Abstract
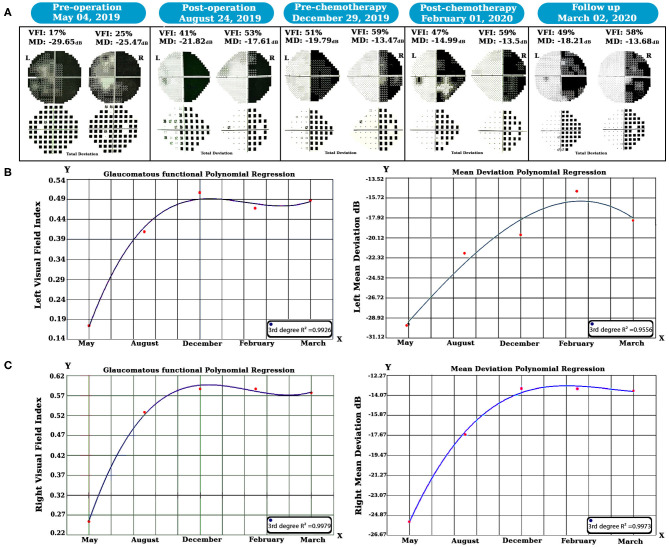
Neurofibromatosis type 1 (NF1) is associated with peripheral and central nervous system tumors. It is noteworthy that the regions in which these tumors frequently arise are the optic pathways (OPs) and the brainstem. Thus, we decided to trace the procedure of diffusion Magnetic Resonance Imaging (dMRI) alterations along with Short-Wavelength Automated Perimetry (SWAP) examinations of the OPs after surgery and chemotherapy over 1 year, which enabled us to evaluate chemotherapy's efficacy in an NF1 patient with an OP tumor. In this study, a 25-year-old woman with NF1 and left optic radiation (OR) glioma underwent surgery to remove the glioma. Immunohistochemistry (IHC) revealed a Pilocytic Astrocytoma (PA) WHO grade I. Post-operation chemotherapy done using nine treatment cycles of administering Temozolomide (TMZ) for 5 days every 4 weeks. Applying the region of interest (ROI) differential tractography method and SWAP four times every 3 months allowed us to follow the patient's visual acuity alterations longitudinally. The differential deterministic tractography method and statistical analyses enabled us to discover the white matter (WM) tracts anisotropy alterations over time. Furthermore, statistical analyses on the SWAP results along time illustrated possible alterations in visual acuity. Then, we could compare and associate the findings with the SWAP examinations and patient symptoms longitudinally. Statistical analyses of SWAP tests revealed a significant improvement in visual fields, and longitudinal differential tractography showed myelination and dense axonal packing in the left OR after 1 year of treatment. In this study, we examined an old hypothesis suggesting that chemotherapy is more effective than radiotherapy for NF1 patients with OP gliomas (OPGs) because of the radiation side effects on the visual field, cognition, and cerebrovascular complications. Our longitudinal clinical case study involving dMRI and SWAP on a single NF1-OPG patient showed that chemotherapy did not suppress the OP myelination over time. However, it should be noted that this is a clinical case study, and, therefore, the generalization of results is limited. Future investigations might focus on genetic-based imaging, particularly in more cases. Further, meta-analyses are recommended for giving a proper Field Of View (FOV) to researchers as a subtle clue regarding precision medicine.
Keywords: diffusion tensor imaging; immunohistochemistry; low-grade glioma; neurofibromatosis type 1; optic pathway glioma; short-wavelength automated perimetry; temozolomide; visual field index.
Copyright © 2021 Pajavand, Sharifi, Anvari, Bidari-Zerehpoosh, Shamsi, Nateghinia and Meybodi.
Conflict of interest statement
The authors declare that the research was conducted in the absence of any commercial or financial relationships that could be construed as a potential conflict of interest.
Figures


References
-
- Anderson D. R., Patella V. M. (1999). Automated Static Perimetry. 2nd Edn. St. Louis, MO, 147–159. Available online: https://zenodo.org/record/3747737#.X-SnxthKhPY (accessed on 13 September 2020).
-
- Bedre R. (2020). Bioinformatics Data Analysis and Visualization Toolkit. Zenodo.
Publication types
LinkOut - more resources
Full Text Sources
Other Literature Sources
Research Materials
Miscellaneous