. 2021 Apr 28:12:643605.
doi: 10.3389/fphar.2021.643605. eCollection 2021.

Sodium Monoiodoacetate Dose-Dependent Changes in Matrix Metalloproteinases and Inflammatory Components as Prognostic Factors for the Progression of Osteoarthritis

Affiliations

Sodium Monoiodoacetate Dose-Dependent Changes in Matrix Metalloproteinases and Inflammatory Components as Prognostic Factors for the Progression of Osteoarthritis

Marta Bryk et al. Front Pharmacol. .

Abstract

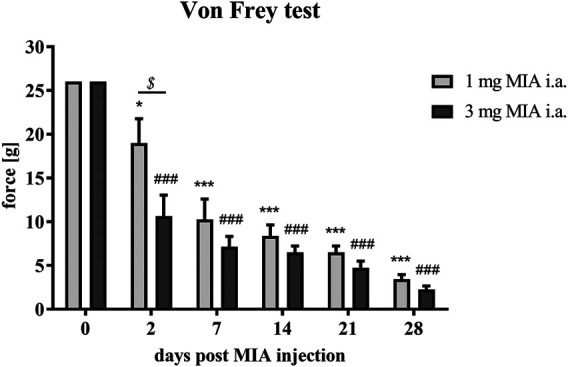
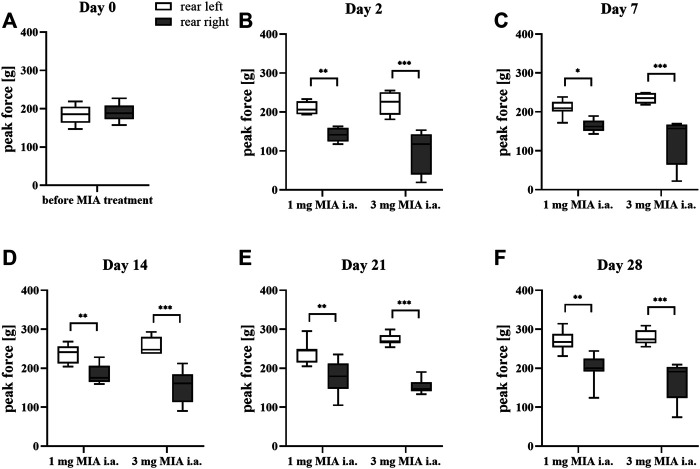
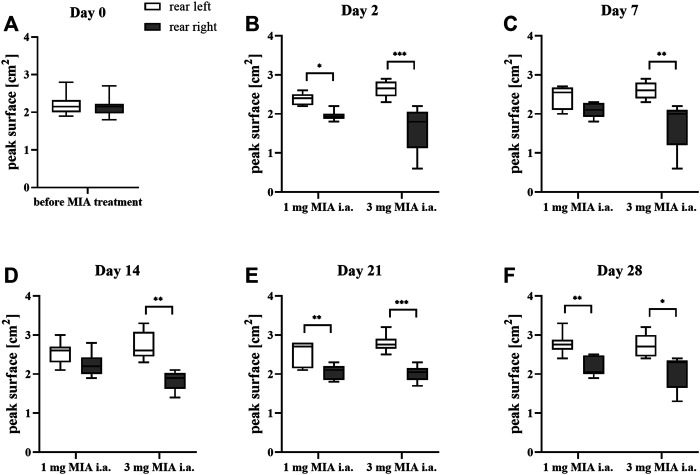
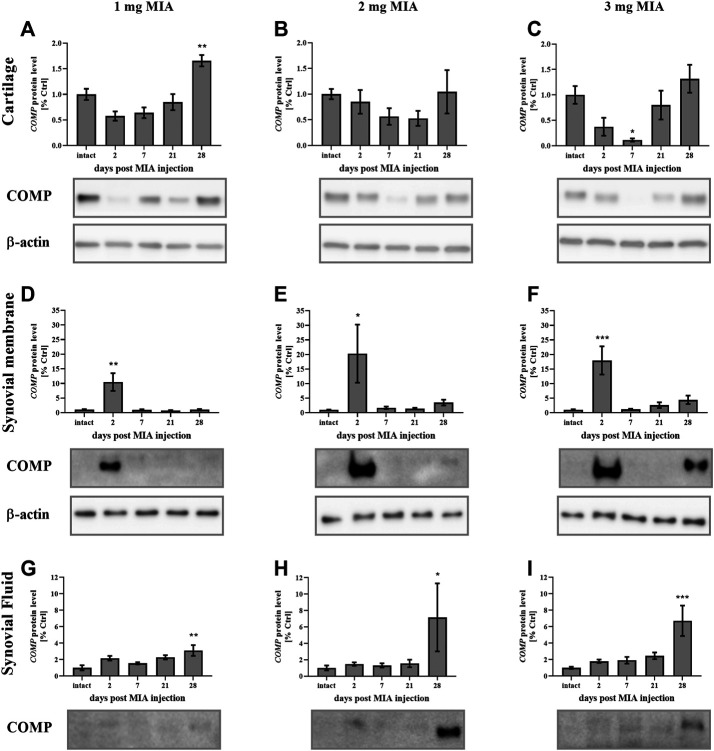
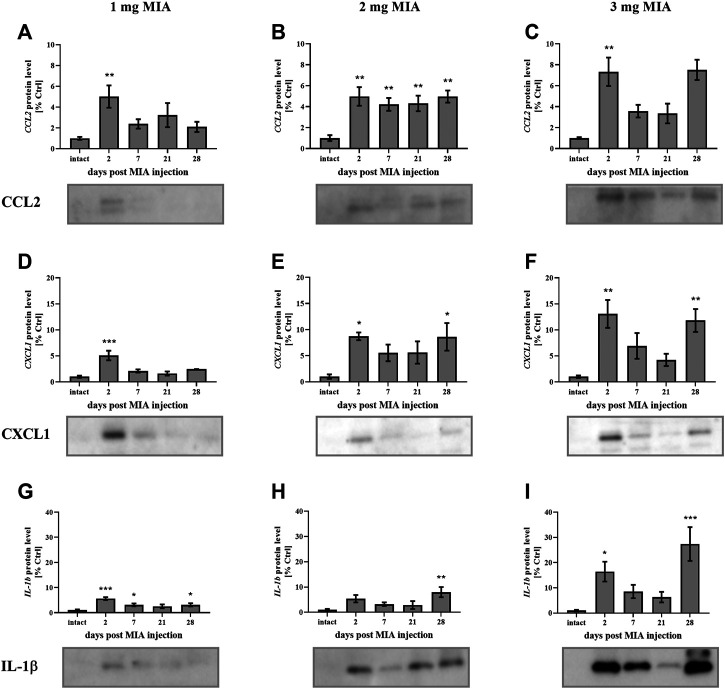
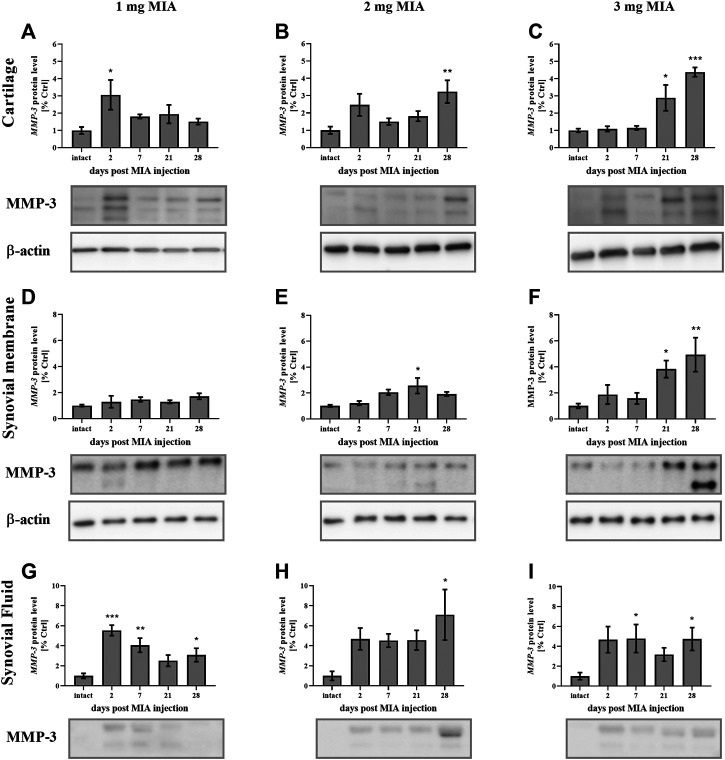
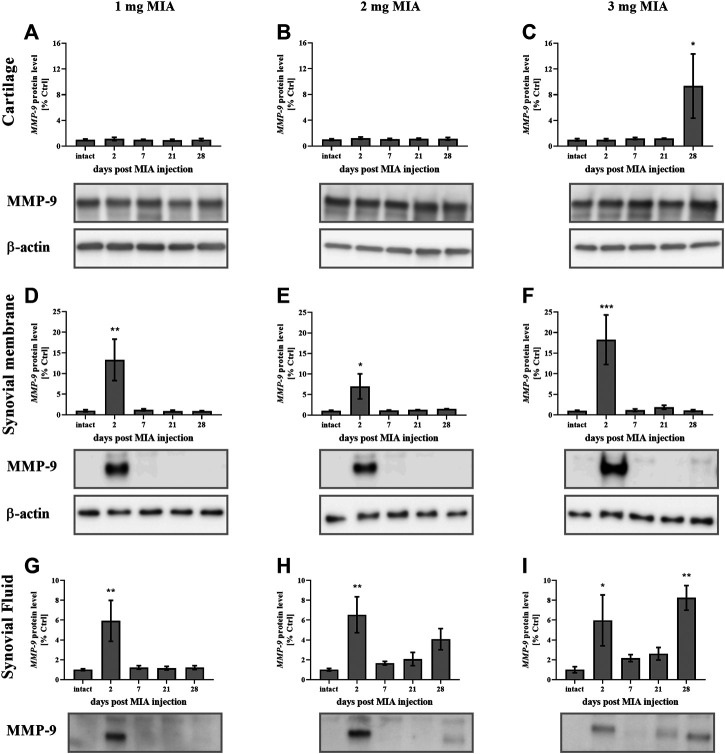
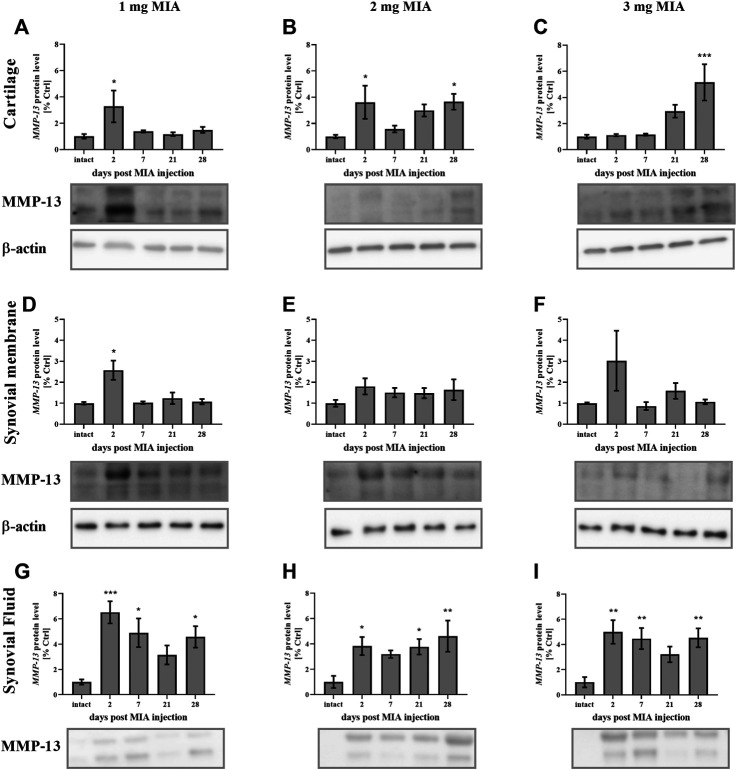
Osteoarthritis (OA) is a degenerative joint disease that primarily affects people over 65 years old. During OA progression irreversible cartilage, synovial membrane and subchondral bone degradation is observed, which results in the development of difficult-to-treat chronic pain. One of the most important factors in OA progression is joint inflammation. Both proinflammatory and anti-inflammatory factors, as well as extracellular matrix degradation enzymes (matrix metalloproteinases (MMPs), play an important role in disease development. One of the most widely used animal OA models involves an intra-articular injection of sodium monoiodoacetate (MIA) directly into the joint capsule, which results in glycolysis inhibition in chondrocytes and cartilage degeneration. This model mimics the degenerative changes observed in OA patients. However, the dose of MIA varies in the literature, ranging from 0.5 to 4.8 mg. The aim of our study was to characterize grading changes after injection of 1, 2 or 3 mg of MIA at the behavioral and molecular levels over a 28-day period. In the behavioral studies, MIA injection at all doses resulted in a gradual increase in tactile allodynia and resulted in abnormal weight bearing during free walking sequences. At several days post-OA induction, cartilage, synovial membrane and synovial fluid samples were collected, and qPCR and Western blot analyses were performed. We observed significant dose- and time-dependent changes in both gene expression and protein secretion levels. Inflammatory factors (CCL2, CXCL1, IL-1β, COMP) increased at the beginning of the experiment, indicating a transient inflammatory state connected to the MIA injection and, in more severe OA, also in the advanced stages of the disease. Overall, the results in the 1 mg MIA group were not consistently clear, indicating that the lowest tested dose may not be sufficient to induce long-lasting OA-like changes at the molecular level. In the 2 mg MIA group, significant alterations in the measured factors were observed. In the 3 mg MIA group, MMP-2, MMP-3, MMP-9, and MMP-13 levels showed very strong upregulation, which may cause overly strong reactions in animals. Therefore, a dose of 2 mg appears optimal, as it induces significant but not excessive OA-like changes in a rat model.

Keywords: cartilage; chronic pain; inflammation; matrix metalloproteinases; osteoarthritis; pain; synovial fluid; synovial membrane.


Conflict of interest statement

The authors declare that the research was conducted in the absence of any commercial or financial relationships that could be construed as a potential conflict of interest.

Figures

FIGURE 1
FIGURE 1
Mechanical allodynia measured by quantifying tactile sensitivity during OA developme with MIA grading. Pain sensitivity was measured with von Frey filaments in the ipsilateral paw (rear right) prior to MIA injection and 2, 7, 14, 21, and 28 days post-MIA treatment (1 or 3 mg intra-articular injection; i. a.; n = 8 animals per group). Two-way ANOVA and Tukey’s HSD post-hoc testing was performed. * denotes p < 0.05; *** denotes p < 0.001 in each day vs. day 0 in the 1 mg group; ### denotes p < 0.001 in each day vs. day 0 in the 3 mg group, $ denotes p < 0.05 1 mg vs. the 3 mg group.
FIGURE 2
FIGURE 2
Gait analysis in OA rats recorded with KWB by measuring the distribution of paw force applied to the ground during a free walk (for 1 and 3 mg of MIA i.a. groups) during a free walk. Measurements taken prior to the MIA injection (day 0; A) and 2, 7, 14, 21, and 28 days (B–F) post-MIA treatment (n = 5–8 animals per group). One-way ANOVA on day 0 or two-way ANOVA on the following experimental days and Tukey’s HSD post-hoc tests were performed. * denotes p < 0.05; ** denotes p < 0.01; *** denotes p < 0.001.
FIGURE 3
FIGURE 3
Gait analysis in OA rats recorded with KWB by measuring the distribution of paw surfaces applied to the ground during free walks (for 1 and 3 mg of MIA i.a. groups) during a free walk. Measurements taken prior to the MIA injection (day 0; A) and 2, 7, 14, 21, and 28 days (B–F) post MIA treatment (n = 5–8 animals per group). One-way ANOVA on day 0 or two-way ANOVA on the following experimental days and Tukey’s HSD post hoc test were performed. * denotes p < 0.05; ** denotes p < 0.01; *** denotes p < 0.001.
FIGURE 4
FIGURE 4
Changes in COMP protein levels in cartilage (A–C), synovial membrane (D–F) and synovial fluid (G–I) samples from osteoarthritic rats as measured by Western blot assay. Tissues were collected 2, 7, 21 or 28 days after OA induction. Results are presented as mean group fold change ± SEM in comparison to the control group (healthy animals), n = 4–5 samples per group. Data were analyzed with one-way ANOVA followed by Dunnett’s post-hoc test. * denotes p < 0.05; ** denotes p < 0.01; *** denotes p < 0.001 vs. intact animals.
FIGURE 5
FIGURE 5
Changes in the protein levels of the inflammation-related factors CCL2 (A–C), CXCL1 (D–F), and IL-1β (G–I) in the synovial fluid of osteoarthritic rats, as measured by Western blot assay. Tissues were collected 2, 7, 21 or 28 days after OA induction. The results are presented as the mean group fold change ± SEM in comparison to the control group (healthy animals), n = 5–6 samples per group. Data were analyzed with one-way ANOVA followed by Dunnett’s post hoc test. * denotes p < 0.05; ** denotes p < 0.01; *** denotes p < 0.001 vs. intact animals.
FIGURE 6
FIGURE 6
Changes in MMP-2 protein levels in cartilage (A–C), synovial membrane (D–F) and synovial fluid (G–I) samples of osteoarthritic rats as measured by Western blot assay. Tissues were collected 2, 7, 21 or 28 days after OA induction. The results are presented as the mean group fold change ± SEM in comparison to the control group (healthy animals), n = 4–5 samples per group. Data were analyzed with one-way ANOVA followed by Dunnett’s post-hoc test. * denotes p < 0.05; ** denotes p < 0.01; *** denotes p < 0.001 vs. intact animals.
FIGURE 7
FIGURE 7
Changes in MMP-3 protein levels in cartilage (A–C), synovial membrane (D–F) and synovial fluid (G–I) samples of osteoarthritic rats as measured by Western blot assay. Tissues were collected 2, 7, 21 or 28 days after OA induction. The results are presented as the mean group fold change ± SEM in comparison to the control group (healthy animals), n = 4–5 samples per group. Data were analyzed with one-way ANOVA followed by Dunnett’s post-hoc test. * denotes p < 0.05; ** denotes p < 0.01; *** denotes p < 0.001 vs. intact animals.
FIGURE 8
FIGURE 8
Changes in MMP-9 protein levels in cartilage (A–C), synovial membrane (D–F) and synovial fluid (G–I) samples of osteoarthritic rats as measured by Western blot assay. Tissues were collected 2, 7, 21 or 28 days after OA induction. The results are presented as the mean group fold change ± SEM in comparison to the control group (healthy animals), n = 4–5 samples per group. Data were analyzed with one-way ANOVA followed by Dunnett’s post-hoc test. * denotes p < 0.05; ** denotes p < 0.01; *** denotes p < 0.001 vs. intact animals.
FIGURE 9
FIGURE 9
Changes in MMP-13 protein levels in cartilage (A–C), synovial membrane (D–F) and synovial fluid (G–I) samples of osteoarthritic rats as measured by Western blot assay. Tissues were collected 2, 7, 21 or 28 days after OA induction. The results are presented as the mean group fold change ± SEM in comparison to the control group (healthy animals), n = 4–5 samples per group. Data were analyzed with one-way ANOVA followed by Dunnett’s post-hoc test. * denotes p < 0.05; ** denotes p < 0.01; *** denotes p < 0.001 vs. intact animals.

Similar articles

Cited by

References

    1. Allen J., Imbert I., Havelin J., Henderson T., Stevenson G., Liaw L., et al. (2017). Effects of treadmill exercise on advanced osteoarthritis pain in rats. Arthritis Rheumatol. 69 (7), 1407–1417. 10.1002/art.40101 - DOI - PMC - PubMed
    1. Alunno A., Falcinelli E., Luccioli F., Petito E., Bartoloni E., Momi S., et al. (2017). Platelets contribute to the accumulation of matrix metalloproteinase type 2 in synovial fluid in osteoarthritis. Thromb. Haemost. 117 (11), 2116–2124. 10.1160/TH17-06-0379 - DOI - PubMed
    1. Andereya S., Streich N., Schmidt-Rohlfing B., Mumme T., Müller-Rath R., Schneider U. (2006). Comparison of modern marker proteins in serum and synovial fluid in patients with advanced osteoarthrosis and rheumatoid arthritis. Rheumatol. Int. 26 (5), 432–438. 10.1007/s00296-005-0006-2 - DOI - PubMed
    1. Baker K., Grainger A., Niu J., Clancy M., Guermazi A., Crema M., et al. (2010). Relation of synovitis to knee pain using contrast-enhanced MRIs. Ann. Rheum. Dis. 69 (10), 1779–1789. 10.1136/ard.2009.121426 - DOI - PMC - PubMed
    1. Berlinberg A., Ashbeck E. L., Roemer F. W., Guermazi A., Hunter D. J., Westra J., et al. (2019). Diagnostic performance of knee physical exam and participant-reported symptoms for MRI-detected effusion-synovitis among participants with early or late stage knee osteoarthritis: data from the Osteoarthritis Initiative. Osteoarthr. Cartilage 27 (1), 80–89. 10.1016/j.joca.2018.09.004 - DOI - PubMed

LinkOut - more resources