

The Endocannabinoid Anandamide Attenuates Acute Respiratory Distress Syndrome by Downregulating miRNA that Target Inflammatory Pathways
- PMID: 33995054
- PMCID: PMC8113864
- DOI: 10.3389/fphar.2021.644281
The Endocannabinoid Anandamide Attenuates Acute Respiratory Distress Syndrome by Downregulating miRNA that Target Inflammatory Pathways
Abstract
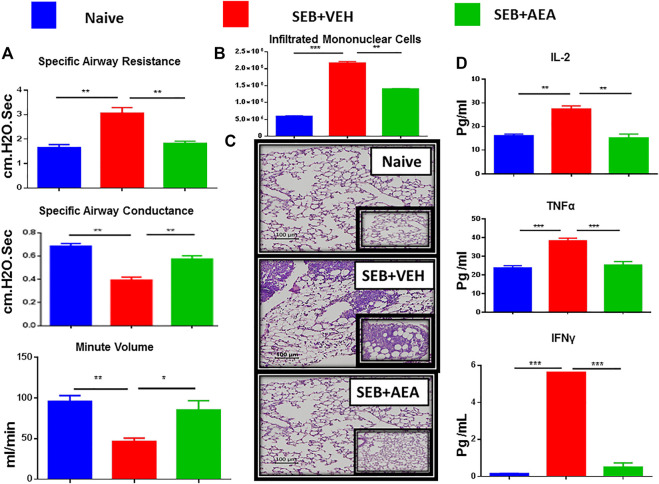
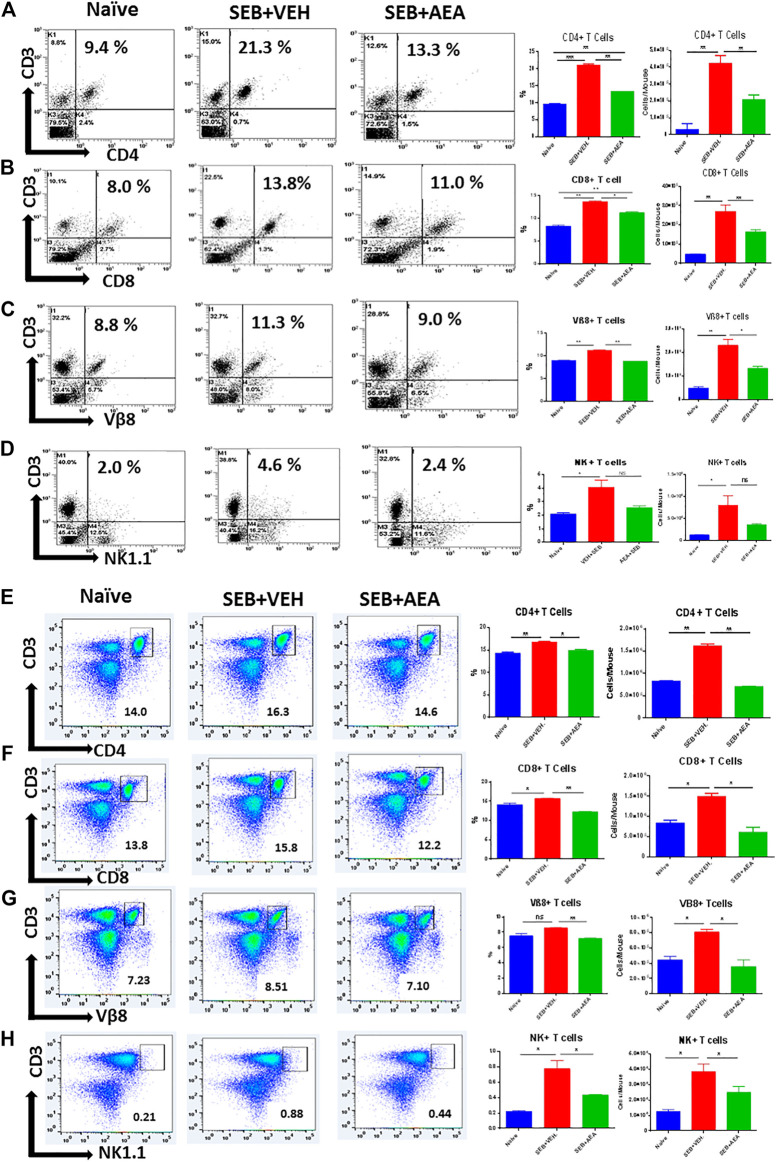
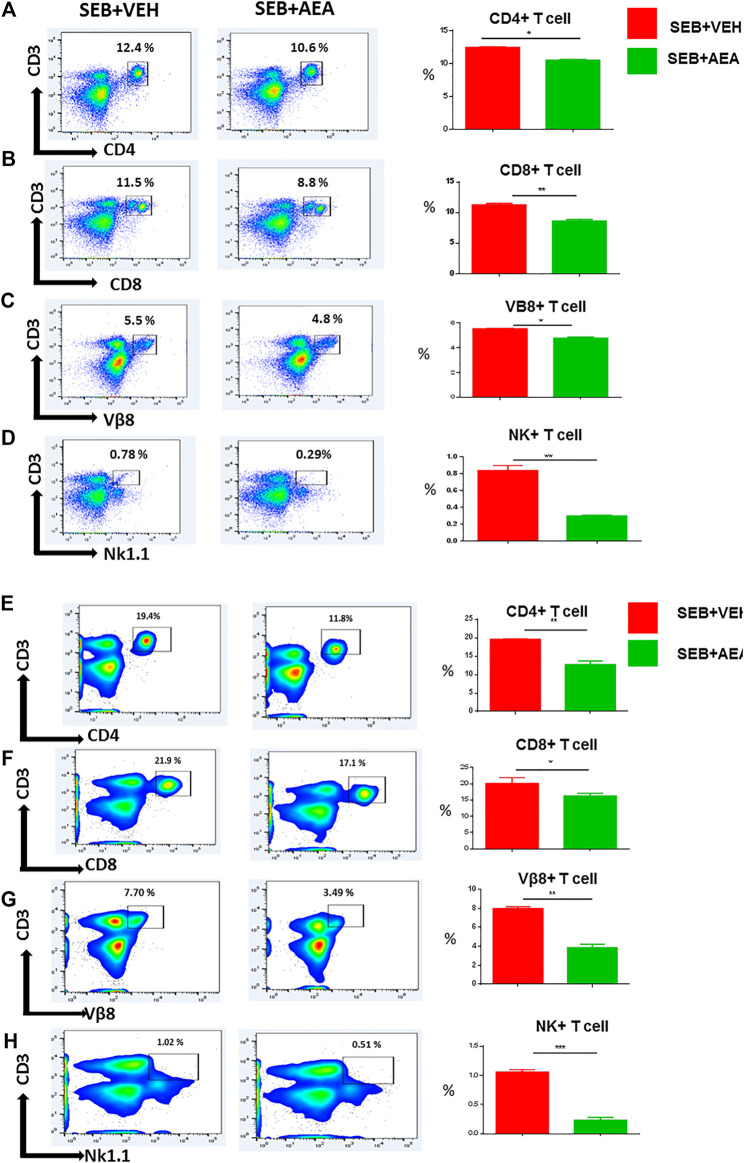
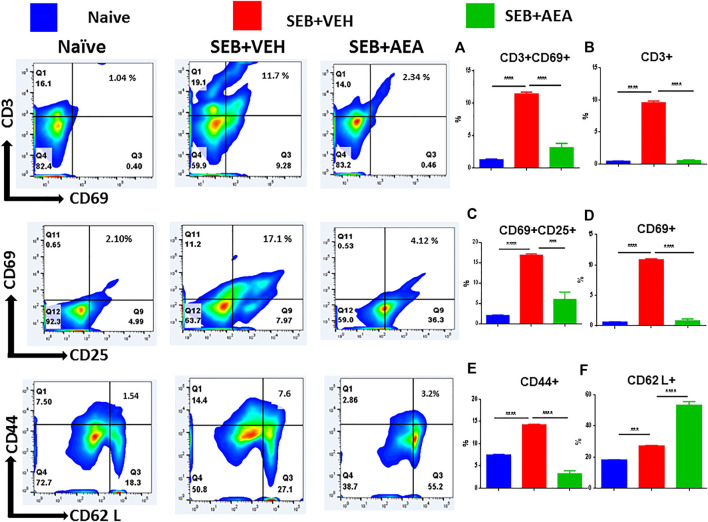
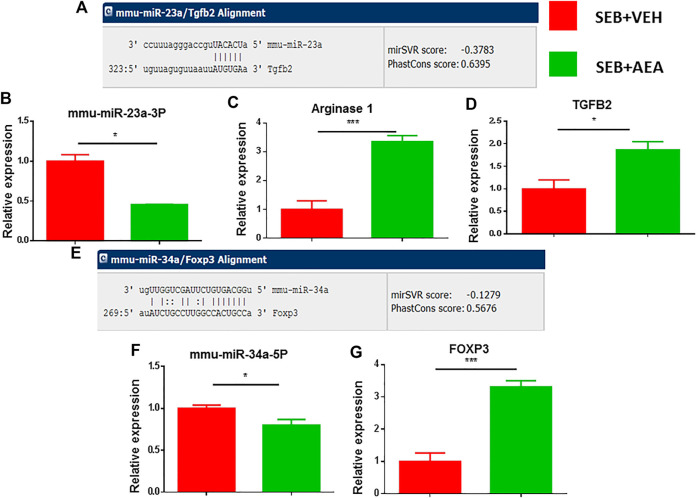
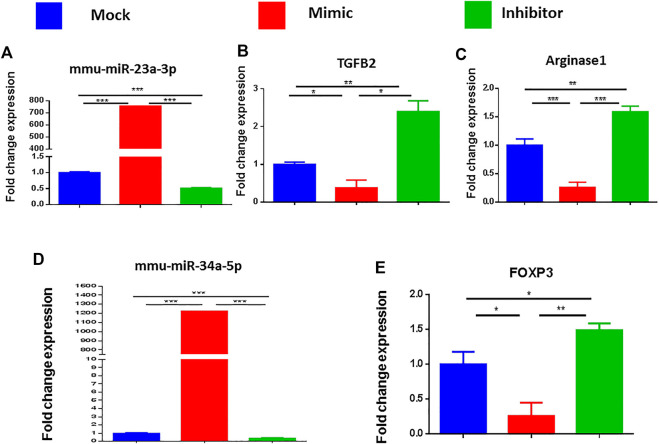
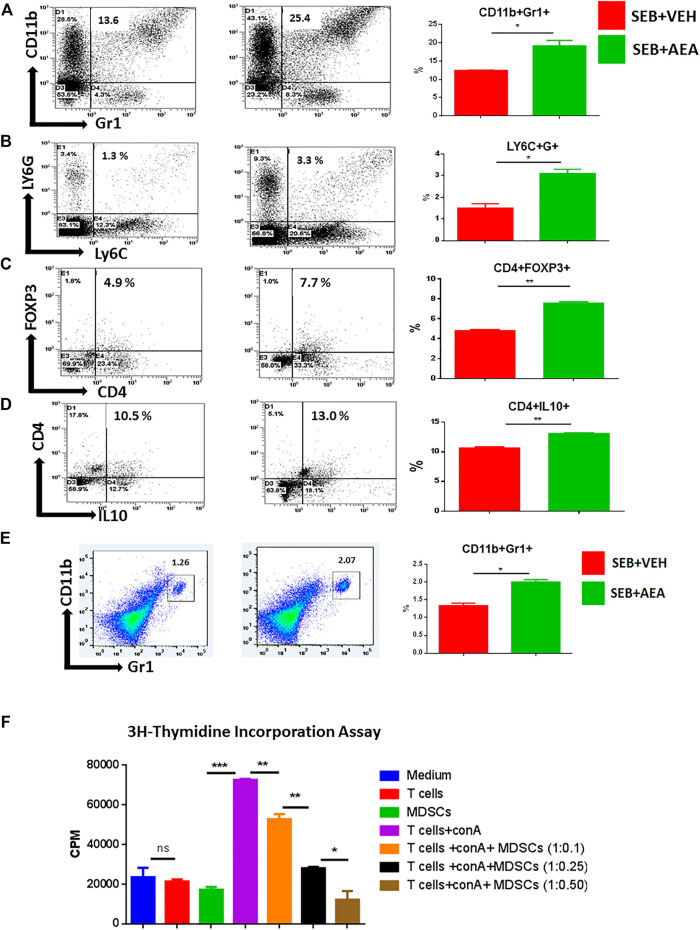
Acute respiratory distress syndrome (ARDS) is defined as a type of respiratory failure that is caused by a variety of insults such as pneumonia, sepsis, trauma and certain viral infections. In this study, we investigated the effect of an endocannabinoid, anandamide (AEA), on ARDS induced in the mouse by Staphylococcus Enterotoxin B (SEB). Administration of a single intranasal dose of SEB in mice and treated with exogenous AEA at a dose of 40 mg/kg body weight led to the amelioration of ARDS in mice. Clinically, plethysmography results indicated that there was an improvement in lung function after AEA treatment accompanied by a decrease of inflammatory cell infiltrate. There was also a significant decrease in pro-inflammatory cytokines IL-2, TNF-α, and IFN-γ, and immune cells including CD4+ T cells, CD8+ T cells, Vβ8+ T cells, and NK+ T cells in the lungs. Concurrently, an increase in anti-inflammatory phenotypes such as CD11b + Gr1+ Myeloid-derived Suppressor Cells (MDSCs), CD4 + FOXP3 + Tregs, and CD4+IL10 + cells was observed in the lungs. Microarray data showed that AEA treatment in ARDS mice significantly altered numerous miRNA including downregulation of miRNA-23a-3p, which caused an upregulation of arginase (ARG1), which encodes for arginase, a marker for MDSCs, as well as TGF-β2, which induces Tregs. AEA also caused down-regulation of miRNA-34a-5p which led to induction of FoxP3, a master regulator of Tregs. Transfection of T cells using miRNA-23a-3p or miRNA-34a-5p mimics and inhibitors confirmed that these miRNAs targeted ARG1, TGFβ2 and FoxP3. In conclusion, the data obtained from this study suggests that endocannabinoids such as AEA can attenuate ARDS induced by SEB by suppressing inflammation through down-regulation of key miRNA that regulate immunosuppressive pathways involving the induction of MDSCs and Tregs.
Keywords: T regulatory cells (T regs); acute respiratory distress syndrome (ARDS); anandamide (AEA); miRNA-23a-3p; miRNA-34a-5p; micro-RNA (miRNA/miR); myeloid derived suppressor cells (MDSC); staphylococcus enterotoxin B (SEB).
Copyright © 2021 Sultan, Alghetaa, Mohammed, Abdulla, Wisniewski, Singh, Nagarkatti and Nagarkatti.
Conflict of interest statement
The authors declare that the research was conducted in the absence of any commercial or financial relationships that could be construed as a potential conflict of interest.
Figures

Similar articles
-
Endocannabinoid Anandamide Attenuates Acute Respiratory Distress Syndrome through Modulation of Microbiome in the Gut-Lung Axis.Cells. 2021 Nov 25;10(12):3305. doi: 10.3390/cells10123305. Cells. 2021. PMID: 34943813 Free PMC article.
-
Administration of Δ9-Tetrahydrocannabinol (THC) Post-Staphylococcal Enterotoxin B Exposure Protects Mice From Acute Respiratory Distress Syndrome and Toxicity.Front Pharmacol. 2020 Jun 16;11:893. doi: 10.3389/fphar.2020.00893. eCollection 2020. Front Pharmacol. 2020. PMID: 32612530 Free PMC article.
-
Resveratrol-mediated attenuation of superantigen-driven acute respiratory distress syndrome is mediated by microbiota in the lungs and gut.Pharmacol Res. 2021 May;167:105548. doi: 10.1016/j.phrs.2021.105548. Epub 2021 Mar 15. Pharmacol Res. 2021. PMID: 33722710 Free PMC article.
-
Regulation of the MIR155 host gene in physiological and pathological processes.Gene. 2013 Dec 10;532(1):1-12. doi: 10.1016/j.gene.2012.12.009. Epub 2012 Dec 14. Gene. 2013. PMID: 23246696 Review.
-
Disruption of CCR5 signaling to treat COVID-19-associated cytokine storm: Case series of four critically ill patients treated with leronlimab.J Transl Autoimmun. 2021;4:100083. doi: 10.1016/j.jtauto.2021.100083. Epub 2021 Jan 6. J Transl Autoimmun. 2021. PMID: 33521616 Free PMC article. Review.
Cited by
-
Endocannabinoid Anandamide Attenuates Acute Respiratory Distress Syndrome through Modulation of Microbiome in the Gut-Lung Axis.Cells. 2021 Nov 25;10(12):3305. doi: 10.3390/cells10123305. Cells. 2021. PMID: 34943813 Free PMC article.
-
Resveratrol attenuates staphylococcal enterotoxin B-activated immune cell metabolism via upregulation of miR-100 and suppression of mTOR signaling pathway.Front Pharmacol. 2023 Feb 24;14:1106733. doi: 10.3389/fphar.2023.1106733. eCollection 2023. Front Pharmacol. 2023. PMID: 36909201 Free PMC article.
-
The Interplay among Glucocorticoid Therapy, Platelet-Activating Factor and Endocannabinoid Release Influences the Inflammatory Response to COVID-19.Viruses. 2023 Feb 19;15(2):573. doi: 10.3390/v15020573. Viruses. 2023. PMID: 36851787 Free PMC article.
-
Diversified Effects of COVID-19 as a Consequence of the Differential Metabolism of Phospholipids and Lipid Peroxidation Evaluated in the Plasma of Survivors and Deceased Patients upon Admission to the Hospital.Int J Mol Sci. 2022 Oct 5;23(19):11810. doi: 10.3390/ijms231911810. Int J Mol Sci. 2022. PMID: 36233111 Free PMC article.
-
Role of Gut Microbiota in Cannabinoid-Mediated Suppression of Inflammation.Adv Drug Alcohol Res. 2022;2:10550. doi: 10.3389/adar.2022.10550. Epub 2022 Jul 14. Adv Drug Alcohol Res. 2022. PMID: 36776218 Free PMC article.
References
-
- Abohalaka R., Bozkurt T. E., Nemutlu E., Onder S. C., Sahin-Erdemli I. (2020). The effects of fatty acid amide hydrolase and monoacylglycerol lipase inhibitor treatments on lipopolysaccharide-induced airway inflammation in mice. Pulm. Pharmacol. Ther. 62, 101920. 10.1016/j.pupt.2020.101920 - DOI - PubMed
-
- Al-Ghezi Z. Z., Miranda K., Nagarkatti M., Nagarkatti P. S. (2019). Combination of cannabinoids, delta9-tetrahydrocannabinol and cannabidiol, ameliorates experimental multiple sclerosis by suppressing neuroinflammation through regulation of miRNA-mediated signaling pathways. Front. Immunol. 10, 1921. 10.3389/fimmu.2019.01921 - DOI - PMC - PubMed
LinkOut - more resources
Full Text Sources
Other Literature Sources
Research Materials
Miscellaneous