. 2021 Apr 29:12:665894.
doi: 10.3389/fphar.2021.665894. eCollection 2021.

The Protective Effects of Sulforaphane on High-Fat Diet-Induced Obesity in Mice Through Browning of White Fat

Affiliations

The Protective Effects of Sulforaphane on High-Fat Diet-Induced Obesity in Mice Through Browning of White Fat

Yaoli Liu et al. Front Pharmacol. .

Abstract

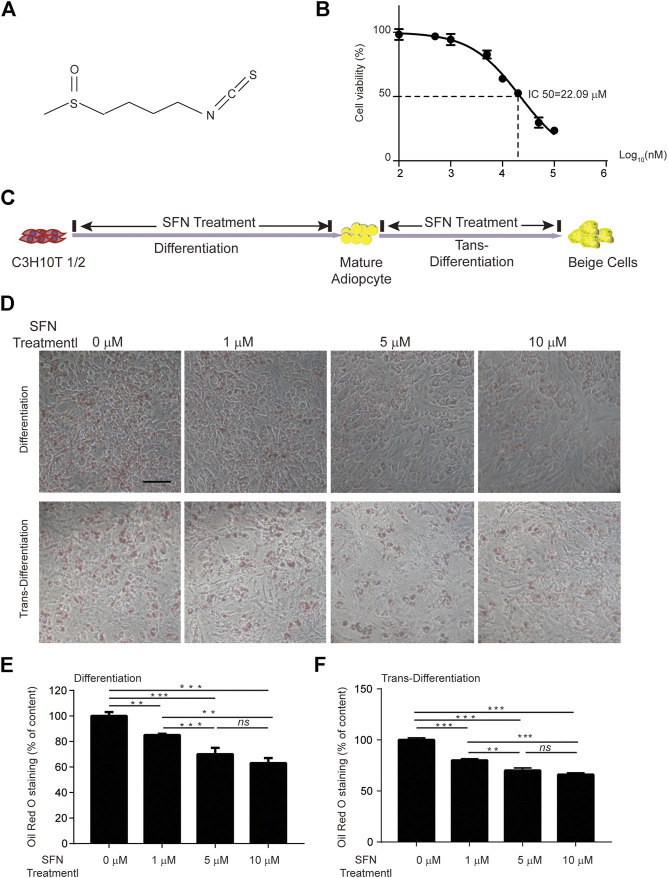
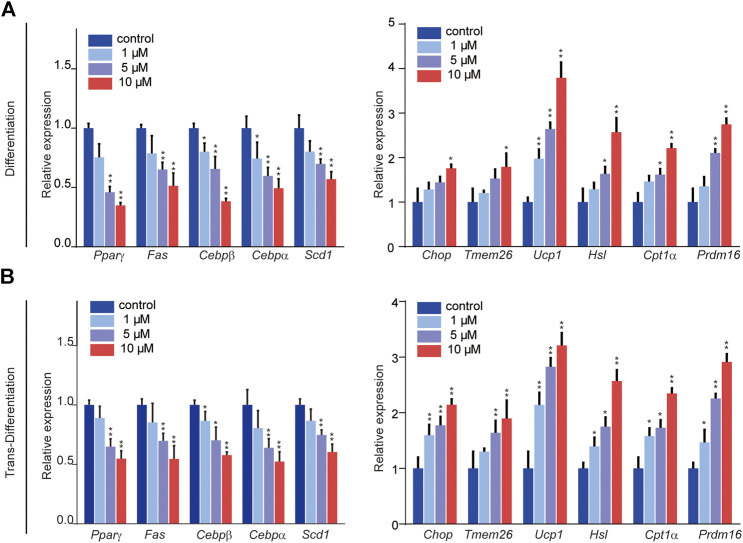
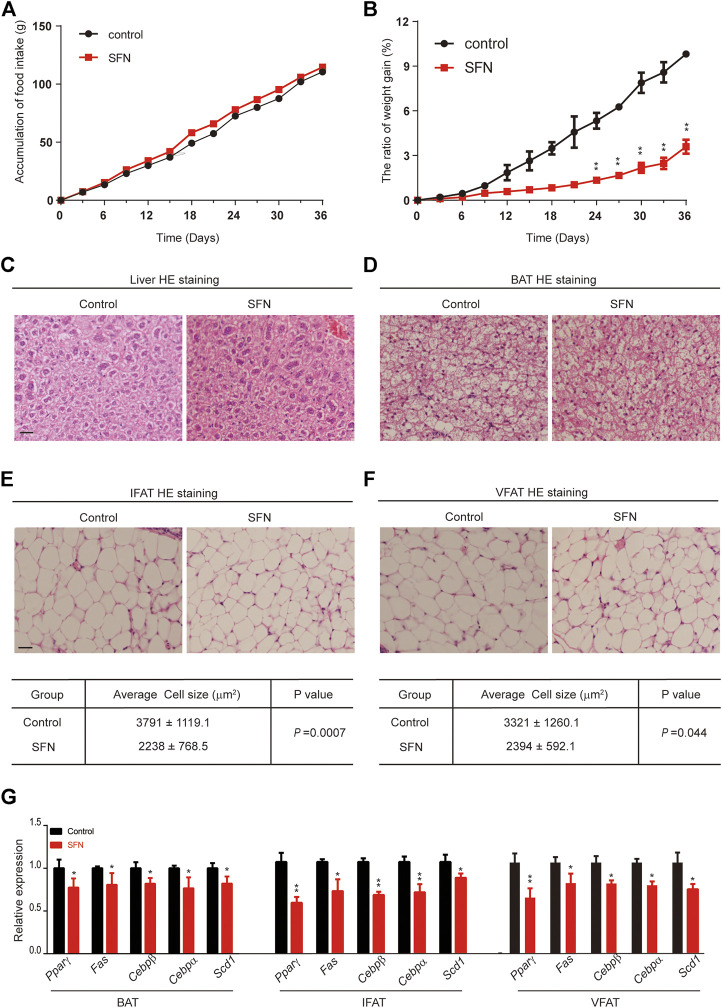
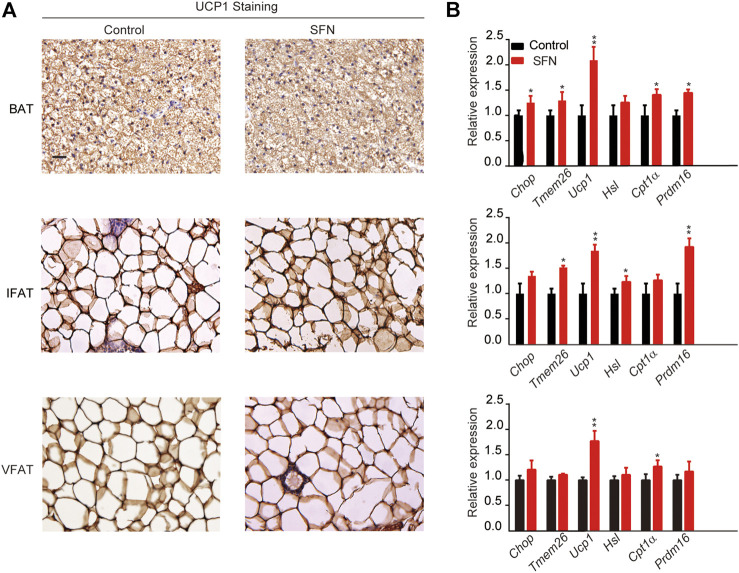
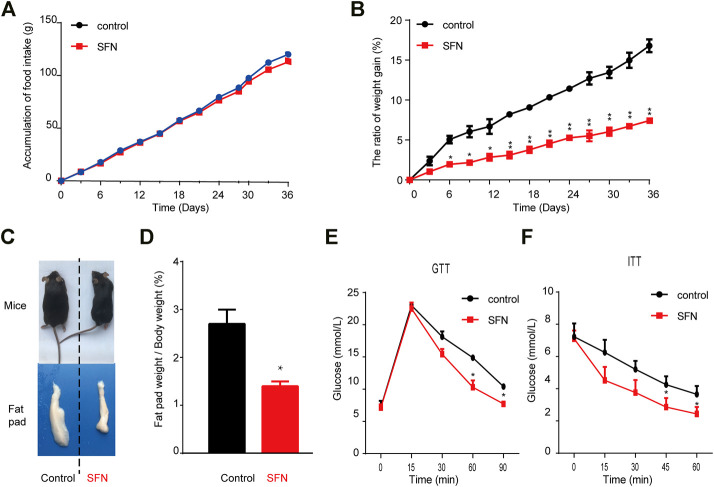
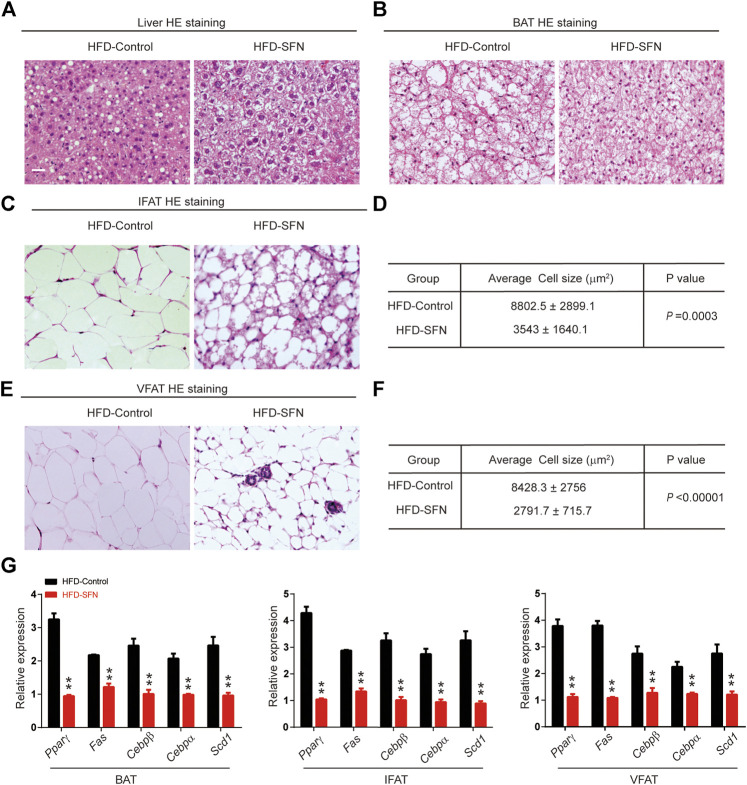
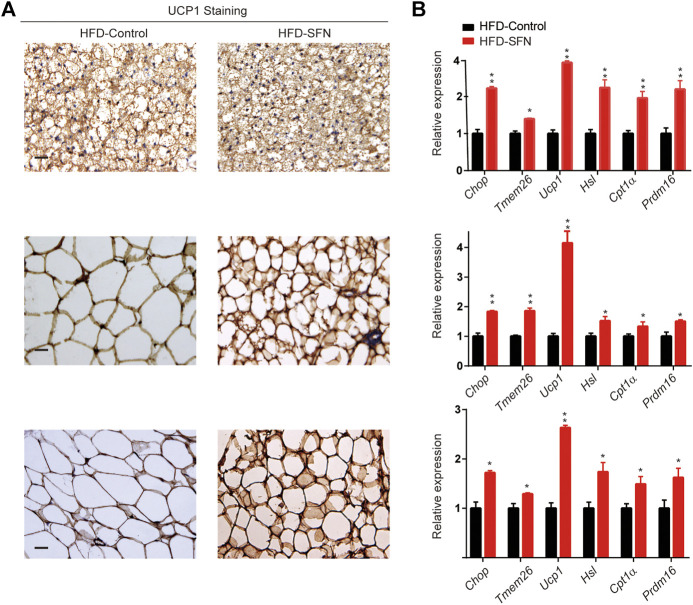
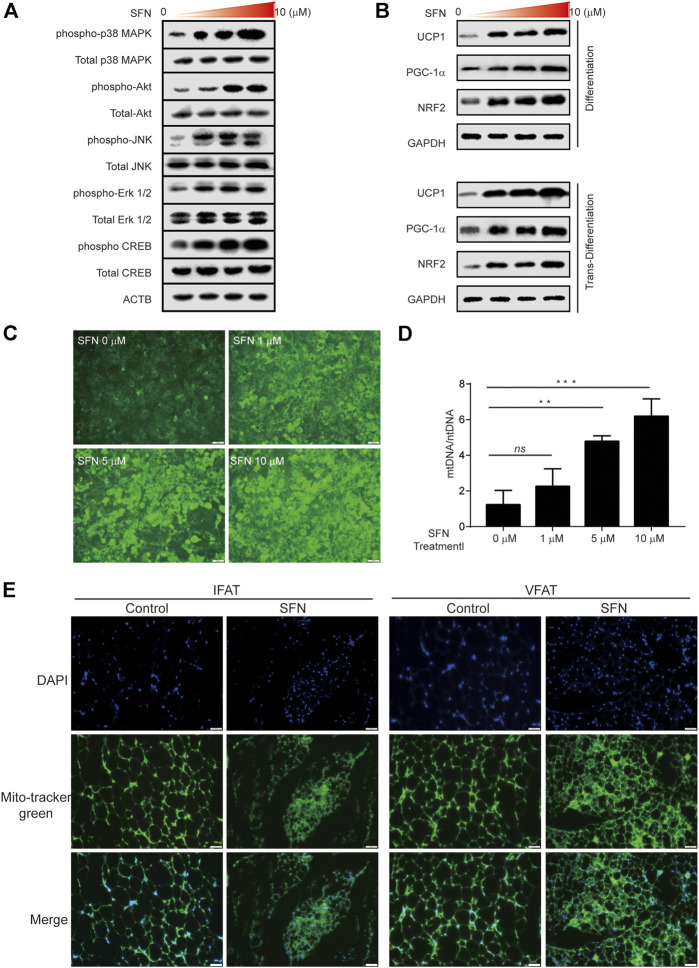
Background: Sulforaphane (SFN), an isothiocyanate naturally occurring in cruciferous vegetables, is a potent indirect antioxidant and a promising agent for the control of metabolic disorder disease. The glucose intolerance and adipogenesis induced by diet in rats was inhibited by SFN. Strategies aimed at induction of brown adipose tissue (BAT) could be a potentially useful way to against obesity. However, in vivo protective effect of SFN against obesity by browning white adipocyte has not been reported. Our present study is aimed at evaluation the efficacy of the SFN against the high-fat induced-obesity mice and investigating the potential mechanism. Methods: High-Fat Diet-induced obese female C57BL/6 mice were intraperitoneally injected with SFN (10 mg/kg) daily. Body weight was recorded every 3 days. 30 days later, glucose tolerance test (GTT) and insulin tolerance test (ITT) were performed. At the end of experiment, fat mass were measured and the adipogenesis as well as browning associated genes expression in white adipose tissue (WAT) were determined by RT-qPCR and western blot. Histological examination of the adipose tissue samples were carried out with hematoxylin-eosin (HE) staining and immunofluorescence staining method. In vitro, pre-adipocytes C3H10T1/2 were treated with SFN to investigate the direct effects on adipogenesis. Results: SFN suppressed HFD-induced body weight gain and reduced the size of fat cells in mice. SFN suppressed the expression of key genes in adipogenesis, inhibited lipid accumulation in C3H10T1/2 cells, increased the expression of brown adipocyte-specific markers and mitochondrial biogenesis in vivo and in vitro, and decreased cellular and mitochondrial oxidative stress. These results suggested that SFN, as a nutritional factor, has great potential role in the battle against obesity by inducing the browning of white fat. Conclusion: SFN could significantly decrease the fat mass, and improve glucose metabolism and increase insulin sensitivity of HFD-induced obese mice by promoting the browning of white fat and enhancing the mitochondrial biogenesis in WAT. Our study proves that SFN could serve as a potential medicine in anti-obesity and related diseases.

Keywords: browning; high-fat diet; obesity; sulforaphane; white adipose browning.


Conflict of interest statement

The authors declare that the research was conducted in the absence of any commercial or financial relationships that could be construed as a potential conflict of interest.

Figures

FIGURE 1
FIGURE 1
Effects of SFN on lipid droplet biogenesis during the differentiation or trans-differentiation of C3H10T1/2 cells. (A) Chemical structure of SFN. (B) IC50 of SFN on C3H10T1/2 cells. (C) Flow diagram of the experimental design (D) SFN inhibited the lipid accumulation in the differentiation of C3H10T1/2 cells and enhanced the trans-differentiation of adipocytes. Cells were fixed and stained with Oil red O. (E,F) Oil red O staining was quantified. Scar bar = 50 μm. All the results were expressed in graph with mean ± SD. Statistical significance was evaluated by ANOVA test. *, ** and *** represent the significant difference at p < 0.05, p < 0.001 and p < 0.0001. ns represent not significant.
FIGURE 2
FIGURE 2
Effects of SFN on the expression of key adipocyte-specific markers (left) and browning-specific markers (right) in C3H10T1/2 adipocytes. (A,B) Total RNA was extracted at the end of the differentiation and trans-differentiation processes. mRNA expression was analyzed by real-time qPCR. The results were normalized to β-actin. All the results were expressed in graph with mean ± SD. Statistical significance was evaluated by Student t test. * and ** represent the significant difference at p < 0.05, p < 0.01 vs control group.
FIGURE 3
FIGURE 3
SFN impairs adipose cell differentiation in mice fed with normal diet. (A,B) SFN did not influence food intake but decreased weight gain. n = 7/group, **p < 0.01 vs. control. (C,D) Histology analysis of the effect of SFN on the cell morphology of the liver and BAT. (E,F) SFN decreased the adipose cell size of IWAT and VWAT. (G) SFN decreased the adipogenesis gene expression in WAT. Scar bar = 50 μm. All the results were expressed in graph with mean ± SD. Statistical significance was evaluated by Student t test. * and ** represent the significant difference at p < 0.05, p < 0.01 vs control group.
FIGURE 4
FIGURE 4
SFN promotes WAT browning in HFD-induced mice. (A) Immunostaining for UCP1 in the adipose tissue sections of BAT, IWAT, and VWAT from experiment mice. (B) SFN enhanced the browning gene expression in BAT, IWAT, and VWAT as determined by real-time qPCR assay. Scar bar = 50 μm. All the results were expressed in graph with mean ± SD. Statistical significance was evaluated by Student t test. * and ** represent the significant difference at p < 0.05, p < 0.01 vs control group.
FIGURE 5
FIGURE 5
SFN prevented HFD-induced obesity. (A,B) SFN had no effect on food intake but decreased body weight gain, n = 7/group, *p < 0.05, **p < 0.01 vs. control. (C) Representative photograph of HFD-induced mice and SFN-treated HFD-induced mice (D) Percent of fat pad weight to the whole body weight. (E,F) GTT and ITT in control and SFN-treated groups. n = 7/group. All the results were expressed in graph with mean ± SD. Statistical significance was evaluated by Student t test. * and ** represent the significant difference at p < 0.05, p < 0.01 vs control group.
FIGURE 6
FIGURE 6
SFN prevented lipid accumulation in HFD-induced mice. (A,B) HE staining showed the effect of SFN on the liver and BAT. (C–F) SFN reduced the lipid droplets and the size of adipose cell from IWAT and VWAT. (G) Changes in the expression adipogenesis genes in different adipose tissues from HFD-induced obese mice without SFN treatment. Scar bar = 50 μm. All the results were expressed in graph with mean ± SD. Statistical significance was evaluated by Student t test. * and ** represent the significant difference at p < 0.05, p < 0.01 vs control group.
FIGURE 7
FIGURE 7
SFN induced WAT browning in HFD-induced mice. (A) Immunostaining for UCP1 in adipose tissue sections of BAT, IWAT, and VWAT from experiment mice. (B) SFN enhanced the expression of browning genes in BAT, IWAT, and VWAT as determined by real-time qPCR assay. Scar bar = 50 μm. All the results were expressed in graph with mean ± SD. Statistical significance was evaluated by Student t test. * and ** represent the significant difference at p < 0.05, p < 0.001 vs control group.
FIGURE 8
FIGURE 8
SFN promoted the browning of adipocytes through mitochondrial biogenesis. (A) SFN activated the MAPK and PKA–CREB pathway. (B) SFN promoted the expression of UCP1, PGC-1α, and NRF2 in the adipocyte differentiation and trans-differentiation periods. (C) Distribution of adipocyte mitochondria as assessed by MitoTracker Green staining. (D) The copy number of mtDNA per adipocyte was assessed by real-time qPCR. (E). Scar bar = 50 μm. The content of adipocyte mitochondria assessed by MitoTracker Green staining in the adipose tissue section of HFD-induced mice. All the results were expressed in graph with mean ± SD. Statistical significance was evaluated by ANOVA test. *, ** and *** represent the significant difference at p < 0.05, p < 0.001 and p < 0.0001. ns represent not significant.

Similar articles

Cited by

References

    1. Ahima R. S., Lazar M. A. (2013). The Health Risk of Obesity-Better Metrics Imperative. Science 341 (6148), 856–858. 10.1126/science.1241244 - DOI - PubMed
    1. Bae I.-S., Kim S. H. (2020). Sinapic Acid Promotes Browning of 3T3-L1 Adipocytes via P38 MAPK/CREB Pathway. Biomed. Res. Int. 2020, 1–8. 10.1155/2020/5753623 - DOI - PMC - PubMed
    1. Bargut T. C. L., Souza-Mello V., Aguila M. B., Mandarim-de-Lacerda C. A. (2017). Browning of White Adipose Tissue: Lessons from Experimental Models. Horm. Mol. Biol. Clin. Investig. 31 (1), 1–13. 10.1515/hmbci-2016-0051 - DOI - PubMed
    1. Bartelt A., Heeren J. (2014). Adipose Tissue Browning and Metabolic Health. Nat. Rev. Endocrinol. 10 (1), 24–36. 10.1038/nrendo.2013.204 - DOI - PubMed
    1. Brunetta H. S., Politis-Barber V., Petrick H. L., Dennis K. M. J. H., Kirsh A. J., Barbeau P. A., et al. (2020). Nitrate Attenuates High Fat Diet-Induced Glucose Intolerance in Association with Reduced Epididymal Adipose Tissue Inflammation and Mitochondrial Reactive Oxygen Species Emission. J. Physiol. 598 (16), 3357–3371. 10.1113/jp279455 - DOI - PubMed