. 2021 Apr 29:12:667524.
doi: 10.3389/fphar.2021.667524. eCollection 2021.

Pseudoginsenoside F11 Enhances the Viability of Random-Pattern Skin Flaps by Promoting TFEB Nuclear Translocation Through AMPK-mTOR Signal Pathway

Affiliations

Pseudoginsenoside F11 Enhances the Viability of Random-Pattern Skin Flaps by Promoting TFEB Nuclear Translocation Through AMPK-mTOR Signal Pathway

Feiya Zhou et al. Front Pharmacol. .

Abstract

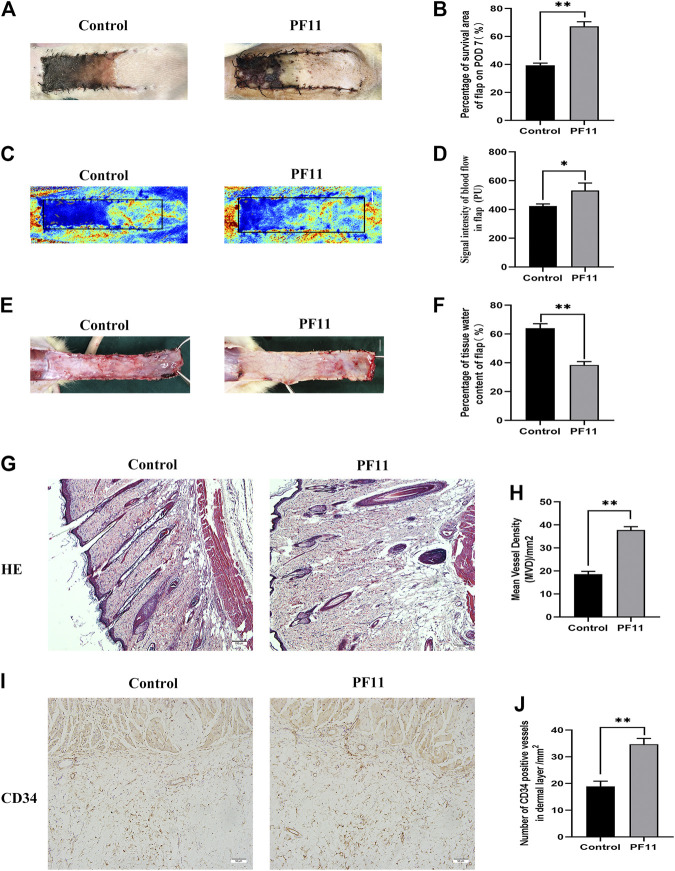
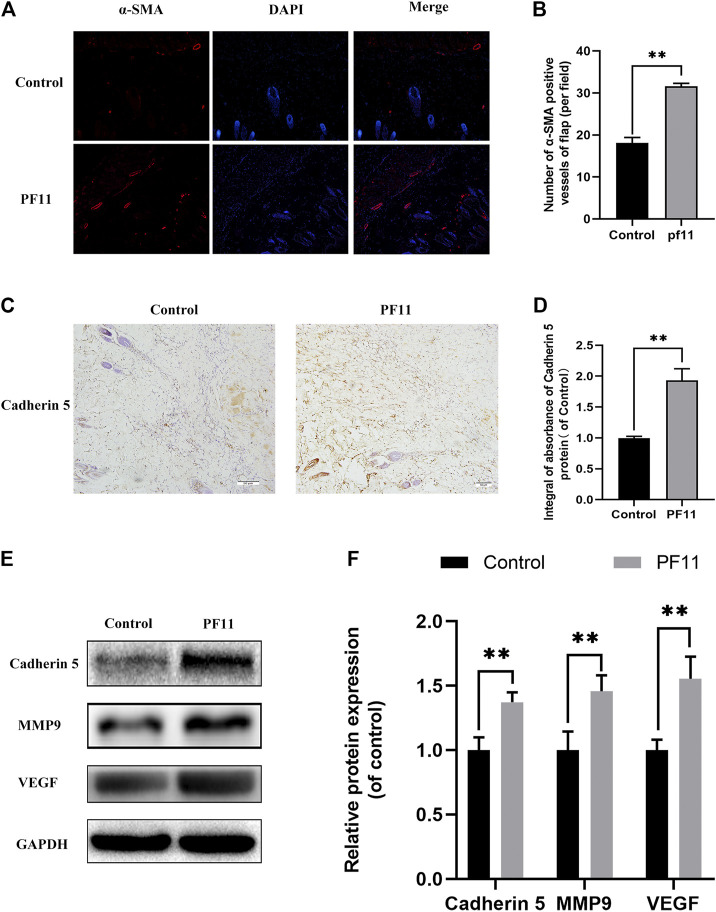
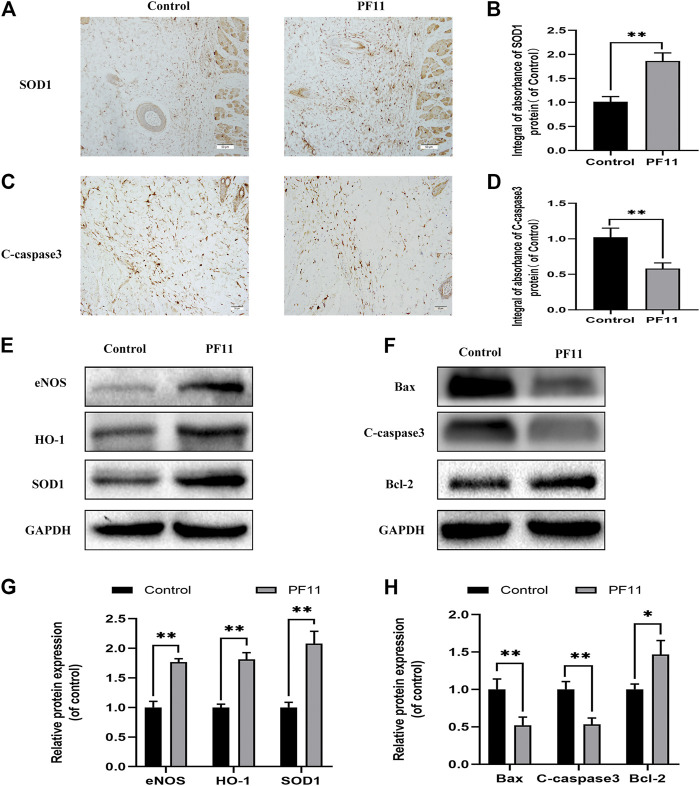
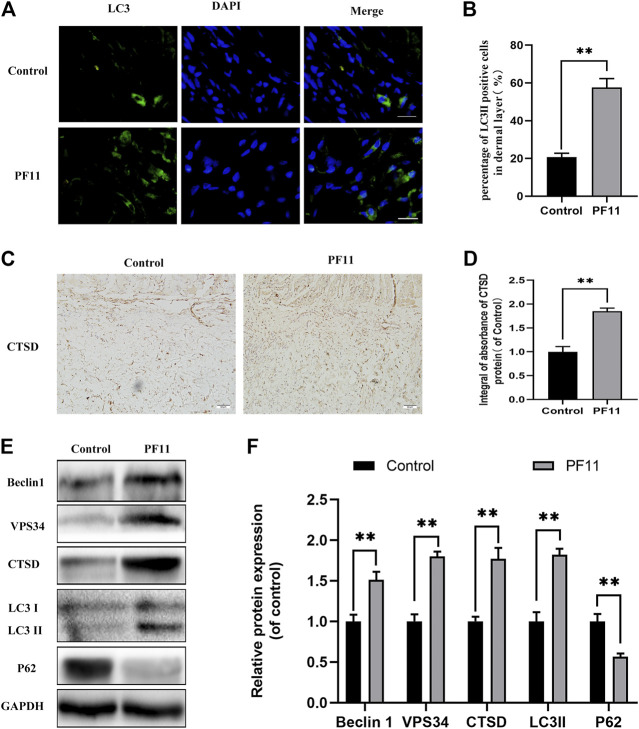
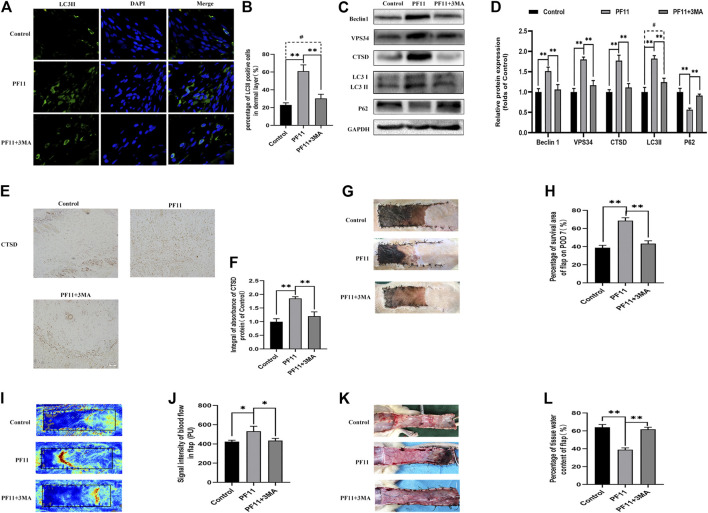
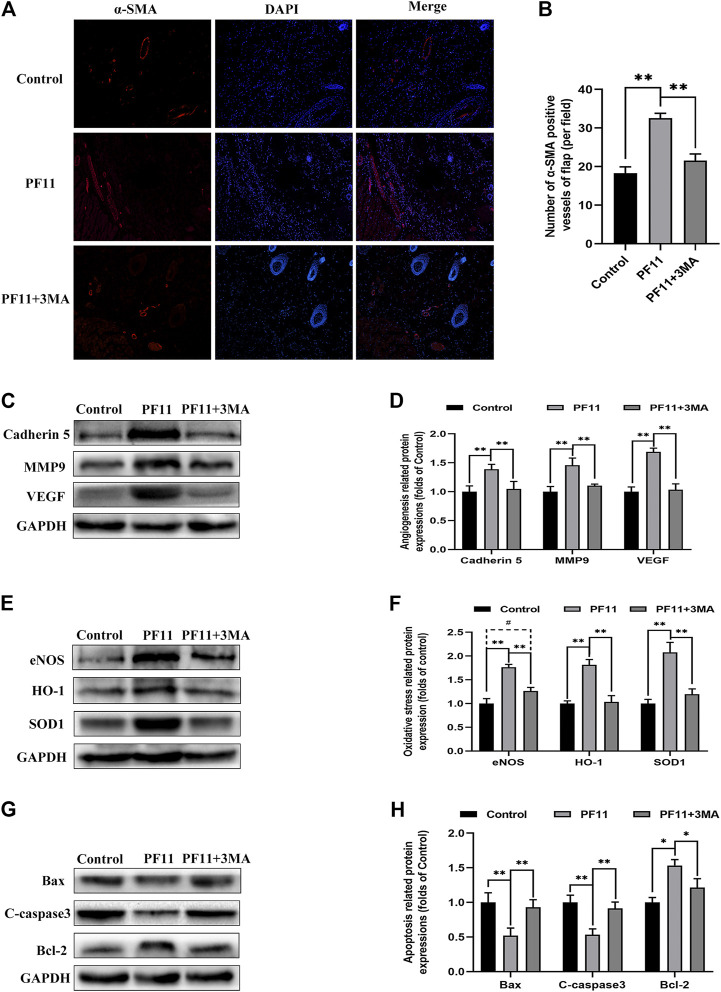
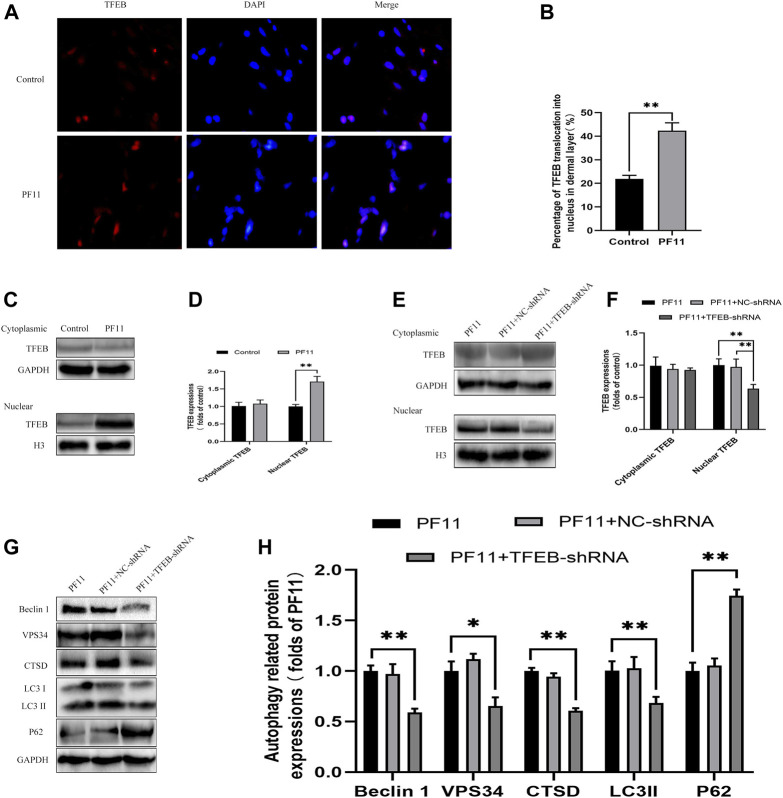
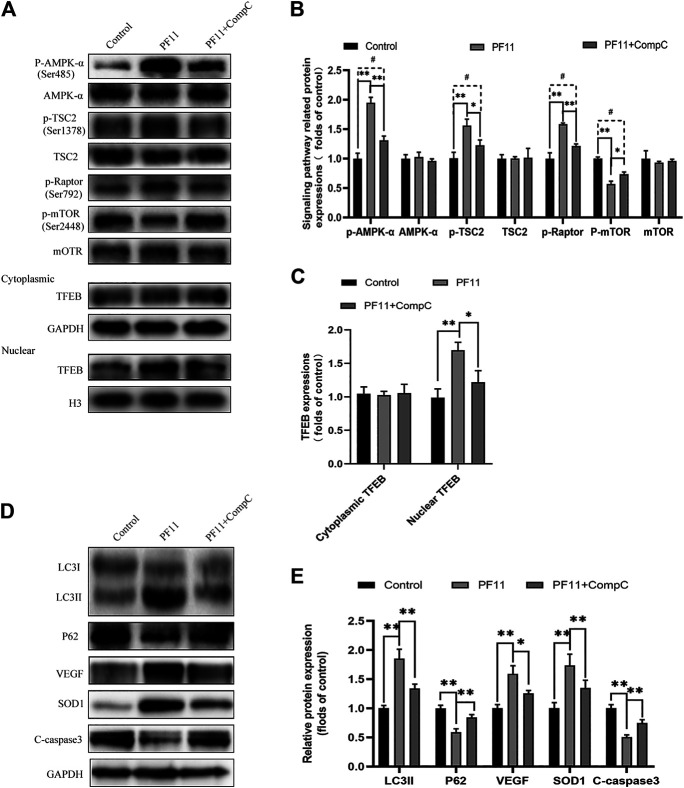
Random-pattern skin flap is widely used in tissue reconstruction. However, necrosis occurring in the distal part of the flap limits its clinical application to some extent. Activation of autophagy has been considered as an effective approach to enhance the survival of skin flaps. Pseudoginsenoside F11 (PF11), an ocotillol-type saponin, is an important component of Panax quinquefolium which has been shown to confer protection against cerebral ischemia and alleviate oxidative stress. However, it is currently unknown whether PF11 induces autophagy to improve the survival of skin flaps. In this study, we investigated the effects of PF11 on blood flow and tissue edema. The results of histological examination and western blotting showed that PF11 enhanced angiogenesis, alleviated apoptosis and oxidative stress, thereby improving the survival of the flap. Further experiments showed that PF11 promoted nuclear translocation of TFEB and by regulating the phosphorylation of AMPK. In summary, this study demonstrates that PF11 activates autophagy through the AMPK-TFEB signal pathway in skin flaps and it could be a promising strategy for enhancing flap viability.

Keywords: AMPK-mTOR signaling pathway; TFEB; angiogenesis; apoptosis; autophagy; oxidative stress; pseudoginsenoside F11; random-pattern skin flaps.


Conflict of interest statement

The authors declare that the research was conducted in the absence of any commercial or financial relationships that could be construed as a potential conflict of interest.

Figures

FIGURE 1
FIGURE 1
(A) Digital photographs of flap on the 7th POD (scale bar, 1 cm). (B) The histogram showing the percentage of survival area of the flap on the 7th POD. (C) Laser Doppler images showing vascular network and blood supply on the 7th POD in the control and PF11 groups (scale bar, 1 cm). (D) Histogram showing the signal intensity of blood flow. (E) Photograph showing edema on the inner side of the skin flap (scale bar, 1 cm). (F) Histogram showing the percentage of tissue water content (G,H) H&E staining showing MVD in Area II of flaps in the control and PF11 groups (original magnification ×100; scan bar, 100 μm). (I,J) IHC results showing the density of CD34 labeled vessels (/mm2). Values are expressed as means ± SD, n = 6 per Group. *p < 0.05 and **p < 0.01, vs. control group.
FIGURE 2
FIGURE 2
PF11 enhances angiogenesis in random skin flaps. (A) Immunofluorescence staining for α-SMA labeled microvessels (scale bar: 20 µm). (B) Histogram showing the percentages of a-SMA positive microvessels in the control and PF11 groups. (C) IHC results showing the Cadherin 5 expression in random skin flaps (scan bar, 50 μm). (D) A histogram exhibiting the integral absorbance of Cadherin 5. (E) Results of western blotting showing the expression of MMP9, VEGF, Cadherin 5, and GAPDH. Cropped blots are shown. (F) Histogram showing optical density values of MMP9, VEGF, and Cadherin5 in the control and PF11 group in the flaps. Values are expressed as means ± SD, n = 6 per Group. *p < 0.05 and **p < 0.01, vs. control group.
FIGURE 3
FIGURE 3
PF11 reduces oxidative stress and alleviates apoptosis in skin flaps. (A) IHC was performed to assess the level of SOD1 positive cells in skin flaps (scan bar, 50 μm). (B) The integral absorbance of SOD1 in the dermal layer. (C) The expression of C-caspase3 was evaluated by IHC in Area II of skin flaps (scan bar, 50 μm). (D) The integral absorbance of C-caspase3 was quantified by Image-Pro Plus. (E,F) Results of western blotting showing the expression of SOD1, eNOS, HO1, Bax, Bcl-2, and C-caspase3. Cropped blots are shown. (G,H) The optical density values of SOD1, eNOS, HO1, Bax, Bcl-2, and C-caspase3 expression in the flaps. Values are expressed as means ± SD, n = 6 per Group. *p < 0.05 and **p < 0.01, vs. control group.
FIGURE 4
FIGURE 4
PF11 increased autophagy flux in random skin flaps. (A) Results of immunofluorescence staining for LC3II positive cells in the dermal layer showing the autophagosomes (red) in cells in Area II of flaps (scale bar: 20 μm). (B) Histogram showing the percentages of LC3II positive cells. (C) IHC results showing the level of CTSD in the control and PF11 groups (scan bar, 50 μm). (D) The integral absorbance of CTSD protein in the dermal layer. (E,F) Results of western blotting showing the expression of Beclin1, VPS34, CTSD, p62, and LC3II. Values are expressed as means ± SD, n = 6 per Group. *p < 0.05 and **p < 0.01, vs. control group.
FIGURE 5
FIGURE 5
Inhibition of autophagy reverses the positive effects of PF11 on random-pattern skin flap. (A,B) Immunofluorescence staining for LC3II positive cells in Area II of flaps (scale bar: 20 μm). (B) A histogram showing the percentage of LC3II positive cells. (C,D) Western blotting was performed to assess the expression of autophagy-related protein Beclin1, VPS34, CTSD, p62, and LC3II. (E,F) IHC results showing the expression of CTSD in the control, PF11, and PF11 + 3MA groups (scan bar, 50 μm). (G,H) Digital photographs showing the percentage of survival area of the flap on the 7th POD (scale bar, 1 cm). (I,J) The signal intensity of blood flow as detected by Laser Doppler on the 7th POD (scale bar, 1 cm). (K,L) Photograph exhibiting edema and vascular network on the inner side of the skin flap (scale bar, 1 cm). Values are expressed as means ± SD, n = 6 per group. *p < 0.05 and **p < 0.01, vs. PF11 group. #p < 0.05 and ##p < 0.01, vs. control group.
FIGURE 6
FIGURE 6
Inhibition of autophagy abolished the positive effects of PF11 on angiogenesis, apoptosis, oxidative stress in skin flaps. (A,B) Immunofluorescence staining showed the α-SMA positive microvessels in the control, PF11, and PF11 + 3MA groups (scale bar: 20 µm). (C,D) Western blotting results exhibited the expression of angiogenesis-related protein MMP9, VEGF, and Cadherin 5. (E,F) Western blotting results exhibited the expression of oxidative stress-related protein SOD1, HO1, and eNOS in the control, PF11, and PF11 + 3MA groups. (G,H) Western blotting results exhibited the expression of apoptosis-related protein Bax, Bcl-2, and C-caspase3. Values are expressed as means ± SD, n = 6 per group. *p < 0.05 and **p < 0.01, vs. PF11 group. #p < 0.05 and ##p < 0.01, vs. control group. #p < 0.05 and ##p < 0.01, vs. control group.
FIGURE 7
FIGURE 7
PF11 augments autophagy by promoting nuclear translocation of TFEB. (A,B) Immunofluorescence staining for nuclear translocation of TFEB (red) in cells of flaps in the control and PF11 groups (scale bar, 20 μm). (C,D) Western blotting was performed to assess the expression of cytoplasmic and nuclear TFEB in the control and PF11 group. (E,F) The level of cytoplasmic and nuclear TFEB in the PF11, PF11 + NC-shRNA, and PF11 + TFEB-shRNA groups were evaluated by western blotting assay (G,H) Western blotting was used to assess the expression level of p62, Beclin1, VPS34, CTSD, and LC3II in the PF11, PF11 + NC-shRNA, and PF11 + TFEB-shRNA groups. Cropped blots are shown. Values are expressed as means ± SD, n = 6 per group. *p < 0.05 and **p < 0.01, vs. PF11 group.
FIGURE 8
FIGURE 8
PF11 regulates AMPK-mTOR signaling pathway in flaps. (A–C) Western blotting results showed the expression of AMPK-α, p-AMPK-α, TSC2, p-TSC2, p-Raptor mTOR, p-mTOR, cytoplasmic TFEB, and nuclear TFEB in the control, PF11, and PF11 + CC groups. (D,E) Expression and quantification of LC3II, p62, VEGF, SOD1, and C-caspase3 in each group. Values are expressed as means ± SD, n = 6 per group. *p < 0.05 and **p < 0.01, vs. PF11 group. #p < 0.05 and ##p < 0.01, vs. control group.

Similar articles

Cited by

References

    1. Bain J., Plater L., Elliott M., Shpiro N., Hastie C. J., McLauchlan H., et al. (2007). The Selectivity of Protein Kinase Inhibitors: a Further Update. Biochem. J. 408 (3), 297–315. 10.1042/bj20070797 - DOI - PMC - PubMed
    1. Bell E. S., Coelho P. P., Park M. (2020). LC3C Mediates Selective Autophagy of the MET RTK, Inhibiting Cancer Cell Invasion. Autophagy 16 (5), 959–961. 10.1080/15548627.2020.1728099 - DOI - PMC - PubMed
    1. Betin V. M. S., Lane J. D. (2009). Caspase Cleavage of Atg4D Stimulates GABARAP-L1 Processing and Triggers Mitochondrial Targeting and Apoptosis. J. Cel Sci. 122 (14), 2554–2566. 10.1242/jcs.046250 - DOI - PMC - PubMed
    1. Bruiners N., Dutta N. K., Guerrini V., Salamon H., Yamaguchi K. D., Karakousis P. C., et al. (2020). The Anti-tubercular Activity of Simvastatin Is Mediated by Cholesterol-Driven Autophagy via the AMPK-mTORC1-TFEB axis. J. lipid Res. 61 (12), 1617–1628. 10.1194/jlr.RA120000895 - DOI - PMC - PubMed
    1. Chang C.-H., Yen M.-C., Liao S.-H., Hsu Y.-L., Lai C.-S., Kuo Y.-R., et al. (2017). Dual Role of MiR-21-Mediated Signaling in HUVECs and Rat Surgical Flap under Normoxia and Hypoxia Condition. Ijms 18 (9), 1917. 10.3390/ijms18091917 - DOI - PMC - PubMed

LinkOut - more resources