. 2021 Apr 28:12:668657.
doi: 10.3389/fphar.2021.668657. eCollection 2021.

Protein Kinases Mediate Anti-Inflammatory Effects of Cannabidiol and Estradiol Against High Glucose in Cardiac Sodium Channels

Affiliations

Protein Kinases Mediate Anti-Inflammatory Effects of Cannabidiol and Estradiol Against High Glucose in Cardiac Sodium Channels

Mohamed A Fouda et al. Front Pharmacol. .

Abstract

Background: Cardiovascular anomalies are predisposing factors for diabetes-induced morbidity and mortality. Recently, we showed that high glucose induces changes in the biophysical properties of the cardiac voltage-gated sodium channel (Nav1.5) that could be strongly correlated to diabetes-induced arrhythmia. However, the mechanisms underlying hyperglycemia-induced inflammation, and how inflammation provokes cardiac arrhythmia, are not well understood. We hypothesized that inflammation could mediate the high glucose-induced biophyscial changes on Nav1.5 through protein phosphorylation by protein kinases A and C. We also hypothesized that this signaling pathway is, at least partly, involved in the cardiprotective effects of cannabidiol (CBD) and 17β-estradiol (E2). Methods and Results: To test these ideas, we used Chinese hamster ovarian (CHO) cells transiently co-transfected with cDNA encoding human Nav1.5 α-subunit under control, a cocktail of inflammatory mediators or 100 mM glucose conditions (for 24 h). We used electrophysiological experiments and action potential modeling. Inflammatory mediators, similar to 100 mM glucose, right shifted the voltage dependence of conductance and steady-state fast inactivation and increased persistent current leading to computational prolongation of action potential (hyperexcitability) which could result in long QT3 arrhythmia. We also used human iCell cardiomyocytes derived from inducible pluripotent stem cells (iPSC-CMs) as a physiologically relevant system, and they replicated the effects produced by inflammatory mediators observed in CHO cells. In addition, activators of PK-A or PK-C replicated the inflammation-induced gating changes of Nav1.5. Inhibitors of PK-A or PK-C, CBD or E2 mitigated all the potentially deleterious effects provoked by high glucose/inflammation. Conclusion: These findings suggest that PK-A and PK-C may mediate the anti-inflammatory effects of CBD and E2 against high glucose-induced arrhythmia. CBD, via Nav1.5, may be a cardioprotective therapeutic approach in diabetic postmenopausal population.

Keywords: cannabidiol; diabetes; estradiol; high glucose; inflammation; protein kinase A; protein kinase C; sodium ion channels.


Conflict of interest statement

The authors declare that the research was conducted in the absence of any commercial or financial relationships that could be construed as a potential conflict of interest.

Figures

FIGURE 1
FIGURE 1
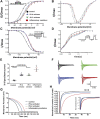
(A) Effect of a cocktail of inflammatory mediators or 100 mM glucose or their vehicle (for 24 h) on conductance curve of Nav1.5 transfected CHO cells with the insert showing the protocol (n = 5, each). (B) IV curves (C) Effect of a cocktail of inflammatory mediators or 100 mM glucose or their vehicle (for 24 h) on SSFI of Nav1.5 transfected CHO cells with the insert showing the protocol (n = 5, each). (D) Effect of a cocktail of inflammatory mediators or 100 mM glucose or their vehicle (for 24 h) on recovery from fast inactivation of Nav1.5 transfected CHO cells with the insert showing the protocol (n = 5, each). (E) Effect of a cocktail of inflammatory mediators or 100 mM glucose or their vehicle (for 24 h) on the percentage of persistent sodium currents of Nav1.5 transfected CHO cells with the insert showing the protocol (n = 5, each). (F) Representative families of macroscopic currents. (G) In silico action potential duration of Nav1.5 transfected CHO cells incubated in inflammatory mediators or 100 mM glucose or the vehicle for 24 h. (H) Representative persistent currents across conditions. Currents were normalized to peak current amplitude. Bar above current traces indicates period during which persistent current was measured. Inset shows non-normalized currents. *p < 0.05 vs. corresponding “Control” values using one-way ANOVA along with post hoc testing.
FIGURE 2
FIGURE 2
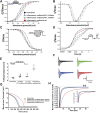
(A) Effect of inflammatory mediators (for 24 h) or PK-A activator (CPT-cAMP; 1 μM, for 20 min) or PK-C activator (PMA; 10 nM, for 20 min) on conductance curve Nav1.5 transfected CHO cells with the insert showing the protocol (n = 5, each). (B) IV curves (C) Effect of inflammatory mediators (for 24 h) or PK-A activator (CPT-cAMP; 1 μM, for 20 min) or PK-C activator (PMA; 10 nM, for 20 min) on SSFI of Nav1.5 transfected CHO cells with the insert showing the protocol (n = 5, each). (D) Effect of inflammatory mediators (for 24 h) or PK-A activator (CPT-cAMP; 1 μM, for 20 min) or PK-C activator (PMA; 10 nM, for 20 min) on recovery from fast inactivation of Nav1.5 transfected CHO cells with the insert showing the protocol (n = 5, each). (E) Effect of inflammatory mediators (for 24 h) or PK-A activator (CPT-cAMP; 1 μM, for 20 min) or PK-C activator (PMA; 10 nM, for 20 min) on the percentage of persistent sodium currents of Nav1.5 transfected CHO cells with the insert showing the protocol (n = 5, each). (F) Representative families of macroscopic currents. (G) Effect of PK-A activator (CPT-cAMP; 1 µM for 20 min), PK-C activator (PMA; 10 nM, for 20 min) or inflammatory mediators (for 24 h) on the In silico action potential duration of Nav1.5 transfected CHO cells. (H) Representative persistent currents across conditions. Currents were normalized to peak current amplitude. Bar above current traces indicates period during which persistent current was measured. Inset shows non-normalized currents. *p < 0.05 vs. corresponding “Control” values using one-way ANOVA along with post hoc testing.
FIGURE 3
FIGURE 3
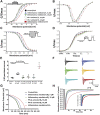
(A) Effect of PK-A inhibitor (H-89, 2 µM for 20 min) or PK-C inhibitor (Gö 6,983, 1 µM for 20 min) or their vehicle on the conductance curve Nav1.5 transfected CHO cells incubated in the inflammatory mediators for 24 h with the insert showing the protocol (n = 5, each). (B) IV curves (C) Effect of PK-A inhibitor (H-89, 2 µM for 20 min) or PK-C inhibitor (Gö 6,983, 1 µM for 20 min) or their vehicle on SSFI of Nav1.5 transfected CHO cells incubated in the inflammatory mediators for 24 h with the insert showing the protocol (n = 5, each). (D) Effect of PK-A inhibitor (H-89, 2 µM for 20 min) or PK-C inhibitor (Gö 6,983, 1 µM for 20 min) or their vehicle on recovery from fast inactivation of Nav1.5 transfected CHO cells incubated in the inflammatory mediators for 24 h with the insert showing the protocol (n = 5, each). (E) Effect of PK-A inhibitor (H-89, 2 µM for 20 min) or PK-C inhibitor (Gö 6,983, 1 µM for 20 min) or their vehicle on the percentage of persistent sodium currents of Nav1.5 transfected CHO cells incubated in the inflammatory mediators for 24 h with the insert showing the protocol (n = 5, each). (F) Representative families of macroscopic currents. (G) Effect of PK-A inhibitor (H-89, 2 µM for 20 min) or PK-C inhibitor (Gö 6,983, 1 µM for 20 min) on the In silico action potential duration of Nav1.5 transfected CHO cells incubated in inflammatory mediators for 24 h. (H) Representative persistent currents across conditions. Currents were normalized to peak current amplitude. Bar above current traces indicates period during which persistent current was measured Inset shows non-normalized currents. *p < 0.05 vs. corresponding “Control/Veh” values using one-way ANOVA along with post hoc testing. # p < 0.05 vs. corresponding “inflammatory mediators/Veh” values using Student’s t-test.
FIGURE 4
FIGURE 4
(A) Effect of CBD (5 μM, perfusion) on the conductance curve of Nav1.5 transfected CHO cells incubated with inflammatory mediators (24 h) or PK-A activator (CPT-cAMP; 1 μM, for 20 min) or PK-C activator (PMA; 10 nM, for 20 min) with the insert showing the protocol (n = 5, each). (B) IV curves (C) Effect of CBD (5 μM, perfusion) on SSFI of Nav1.5 transfected CHO cells incubated with inflammatory mediators (24 h) or PK-A activator (CPT-cAMP; 1 μM, for 20 min) or PK-C activator (PMA; 10 nM, for 20 min) with the insert showing the protocol (n = 5, each). (D) Effect of CBD (5 μM, perfusion) on recovery from fast inactivation of Nav1.5 transfected CHO cells incubated with inflammatory mediators (24 h) or PK-A activator (CPT-cAMP; 1 μM, for 20 min) or PK-C activator (PMA; 10 nM, for 20 min) with the insert showing the protocol (n = 5, each). (E) Effect of CBD (5 μM, perfusion) on the percentage of persistent sodium currents of Nav1.5 transfected CHO cells incubated with inflammatory mediators (24 h) or PK-A activator (CPT-cAMP; 1 μM, for 20 min) or PK-C activator (PMA; 10 nM, for 20 min) with the insert showing the protocol (n = 5, each). (F) Representative families of macroscopic currents. (G) Effect of CBD (5 μM, perfusion) on the In silico action potential duration of Nav1.5 transfected CHO cells incubated in inflammatory mediators (24 h) or PK-A activator (CPT-cAMP; 1 μM, for 20 min) or PK-C activator (PMA; 10 nM, for 20 min). (H) Representative persistent currents across conditions. Currents were normalized to peak current amplitude. Bar above current traces indicates period during which persistent current was measured. Inset shows non-normalized currents. *p < 0.05 vs. corresponding “Control/Veh” values using one-way ANOVA along with post hoc testing.
FIGURE 5
FIGURE 5
(A) Effect of CBD (5 μM, perfusion) or its vehicle on the conductance curve measured from human iCell cardiomyocytes (hIPSC-CMs) incubated with inflammatory mediators (24 h) or their vehicle with the insert showing the protocol (n = 5, each). (B) IV curves (C) Effect of CBD (5 μM, perfusion) or its vehicle on SSFI of human iCell cardiomyocytes (hIPSC-CMs) incubated with inflammatory mediators (24 h) or their vehicle with the insert showing the protocol (n = 5, each). (D) Effect of CBD (5 μM, perfusion) or its vehicle on the percentage of persistent sodium currents of human iCell cardiomyocytes (hIPSC-CMs) incubated with inflammatory mediators (24 h) or their vehicle with the insert showing the protocol (n = 5, each). (E) Effect of CBD (5 μM, perfusion) or its vehicle on the In silico action potential duration of human iCell cardiomyocytes (hIPSC-CMs) incubated in inflammatory mediators (24 h) or their vehicle. (F) Representative families of macroscopic currents. (G) Representative persistent currents across conditions. Currents were normalized to peak current amplitude. Bar above current traces indicates period during which persistent current was measured. Inset shows non-normalized currents. *p < 0.05 vs. corresponding “Control” values using one-way ANOVA along with post hoc testing.
FIGURE 6
FIGURE 6
(A) Effect of E2 (5 or 10 µM) on conductance curve of Nav1.5 transfected CHO cells incubated in 100 mM glucose (for 24 h) with the insert showing the protocol (n = 5, each). (B) IV curves (C) Effect of E2 (5 or 10 µM) on SSFI of Nav1.5 transfected CHO cells in 100 mM glucose (for 24 h) with the insert showing the protocol (n = 5, each). (D) Effect of E2 (5 or 10 µM) on recovery from fast inactivation of Nav1.5 transfected CHO cells in 100 mM glucose (for 24 h) with the insert showing the protocol (n = 5, each). (E) Effect of E2 (5 or 10 µM) on the percentage of persistent sodium currents of Nav1.5 transfected CHO cells in 100 mM glucose (for 24 h) with the insert showing the protocol (n = 5, each). (F) Representative families of macroscopic currents. (G) Effect of E2 (5 or 10 µM) on the In silico action potential duration of Nav1.5 transfected CHO cells incubated in 100 mM glucose (for 24 h). (H) Representative persistent currents across conditions. Currents were normalized to peak current amplitude. Bar above current traces indicates period during which persistent current was measured. Inset shows non-normalized currents. *p < 0.05 vs. corresponding “Control/Veh” values using one-way ANOVA along with post hoc testing. # p < 0.05 vs. corresponding “100 mM glucose/Veh” values using Student’s t-test.
FIGURE 7
FIGURE 7
(A) Effect of E2 (5 or 10 µM) on conductance curve of Nav1.5 transfected CHO cells incubated in inflammatory mediators (for 24 h), PK-A activator (CPT-cAMP; 1 µM for 20 min) or PK-C activator (PMA; 10 nM, for 20 min) with the insert showing the protocol (n = 5, each). (B) IV curves (C) Effect of E2 (5 or 10 µM) on SSFI of Nav1.5 transfected CHO cells incubated in inflammatory mediators (for 24 h), PK-A activator (CPT-cAMP; 1 µM for 20 min) or PK-C activator (PMA; 10 nM, for 20 min) with the insert showing the protocol (n = 5, each). (D) Effect of E2 (5 or 10 µM) on recovery from fast inactivation of Nav1.5 CHO transfected cells incubated in inflammatory mediators (for 24 h), PK-A activator (CPT-cAMP; 1 µM for 20 min) or PK-C activator (PMA; 10 nM, for 20 min) with the insert showing the protocol (n = 5, each). (E) Effect of E2 (5 or 10 µM) on the percentage of persistent sodium currents of Nav1.5 transfected CHO cells incubated in inflammatory mediators (for 24 h), PK-A activator (CPT-cAMP; 1 µM for 20 min) or PK-C activator (PMA; 10 nM, for 20 min) with the insert showing the protocol (n = 5, each). (F) Representative families of macroscopic currents. (G) Effect of E2 (5 or 10 µM) on the In silico action potential duration of Nav1.5 transfected cells incubated in inflammatory mediators (for 24 h), PK-A activator (CPT-cAMP; 1 µM for 20 min) or PK-C activator (PMA; 10 nM, for 20 min). (H) Representative persistent currents across conditions. Currents were normalized to peak current amplitude. Bar above current traces indicates period during which persistent current was measured. Inset shows non-normalized currents. *p < 0.05 vs. corresponding “Control/Veh” values using one-way ANOVA along with post hoc testing. # p < 0.05 vs. corresponding “inflammatory mediators/Veh” values using Student’s t-test.
FIGURE 8
FIGURE 8
A schematic of possible cellular pathway involved in the protective effect of CBD, E2 against high glucose induced inflammation and activation of PK-A and PK-C via affecting cardiac voltage-gated sodium channels (Nav1.5).

Similar articles

Cited by

References

    1. Abdelsayed M., Peters C. H., Ruben P. C. (2015). Differential Thermosensitivity in Mixed Syndrome Cardiac Sodium Channel Mutants. J. Physiol. 593, 4201–4223. 10.1113/jp270139 - DOI - PMC - PubMed
    1. Abdelsayed M., Ruprai M., Ruben P. C. (2018). The Efficacy of Ranolazine on Eβ84K Is Altered by Temperature and Calcium. Sci. Rep. 8, 3643. 10.1038/s41598-018-22033-1 - DOI - PMC - PubMed
    1. Adamo L., Rocha-Resende C., Prabhu S. D., Mann D. L. (2020). Reappraising the Role of Inflammation in Heart Failure. Nat. Rev. Cardiol. 17, 269–285. 10.1038/s41569-019-0315-x - DOI - PubMed
    1. Akin E. J., Higerd G. P., Mis M. A., Tanaka B. S., Adi T., Liu S., et al. (2019). Building Sensory Axons: Delivery and Distribution of NaV1.7 Channels and Effects of Inflammatory Mediators. Sci. Adv. 5, eaax4755. 10.1126/sciadv.aax4755 - DOI - PMC - PubMed
    1. Ali R. M., Al Kury L. T., Yang K.-H. S., Qureshi A., Rajesh M., Galadari S., et al. (2015). Effects of Cannabidiol on Contractions and Calcium Signaling in Rat Ventricular Myocytes. Cell Calcium 57, 290–299. 10.1016/j.ceca.2015.02.001 - DOI - PubMed

LinkOut - more resources