. 2021 Apr 27:12:652799.
doi: 10.3389/fphys.2021.652799. eCollection 2021.

Proteomics and Machine Learning Approaches Reveal a Set of Prognostic Markers for COVID-19 Severity With Drug Repurposing Potential

Affiliations

Proteomics and Machine Learning Approaches Reveal a Set of Prognostic Markers for COVID-19 Severity With Drug Repurposing Potential

Kruthi Suvarna et al. Front Physiol. .

Abstract

The pestilential pathogen SARS-CoV-2 has led to a seemingly ceaseless pandemic of COVID-19. The healthcare sector is under a tremendous burden, thus necessitating the prognosis of COVID-19 severity. This in-depth study of plasma proteome alteration provides insights into the host physiological response towards the infection and also reveals the potential prognostic markers of the disease. Using label-free quantitative proteomics, we performed deep plasma proteome analysis in a cohort of 71 patients (20 COVID-19 negative, 18 COVID-19 non-severe, and 33 severe) to understand the disease dynamics. Of the 1200 proteins detected in the patient plasma, 38 proteins were identified to be differentially expressed between non-severe and severe groups. The altered plasma proteome revealed significant dysregulation in the pathways related to peptidase activity, regulated exocytosis, blood coagulation, complement activation, leukocyte activation involved in immune response, and response to glucocorticoid biological processes in severe cases of SARS-CoV-2 infection. Furthermore, we employed supervised machine learning (ML) approaches using a linear support vector machine model to identify the classifiers of patients with non-severe and severe COVID-19. The model used a selected panel of 20 proteins and classified the samples based on the severity with a classification accuracy of 0.84. Putative biomarkers such as angiotensinogen and SERPING1 and ML-derived classifiers including the apolipoprotein B, SERPINA3, and fibrinogen gamma chain were validated by targeted mass spectrometry-based multiple reaction monitoring (MRM) assays. We also employed an in silico screening approach against the identified target proteins for the therapeutic management of COVID-19. We shortlisted two FDA-approved drugs, namely, selinexor and ponatinib, which showed the potential of being repurposed for COVID-19 therapeutics. Overall, this is the first most comprehensive plasma proteome investigation of COVID-19 patients from the Indian population, and provides a set of potential biomarkers for the disease severity progression and targets for therapeutic interventions.

Keywords: COVID-19 plasma; drug-repurposing; host response; machine learning; mass spectrometry; molecular pathways; prognostic biomarkers; proteomics.


Conflict of interest statement

The authors have filed an Indian patent related to this work “Protein markers and method for prognosis of COVID-19 in individuals” (Application number: 202023054753). The authors declare that the research was conducted in the absence of any commercial or financial relationships that could be construed as a potential conflict of interest.

Figures
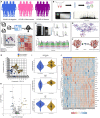
FIGURE 1
FIGURE 1
Schematics of plasma proteomics and proteins dysregulated in the COVID-19 positive when compared with negative. (A) Sample cohort size consisting of 20 COVID-19 negative, 18 COVID-19 non-severe, and 33 COVID-19 severe patients. (B) Schematic workflow of label-free quantification under discovery proteomics. (C) Overview of statistical data analysis. (D) Workflow of validation using multiple reaction monitoring (MRM) approach showing the representative peaks of synthetic peptides. (E,F) Outline of biological network analysis using Metascape and docking study performed using AutoDock Vina, respectively. (G) Partial least squares–discriminant analysis (PLS-DA) of 71 patient samples showing the segregation between COVID-19 positive (including severe and non-severe) and COVID-19 negative samples. (H) Volcano plot showing significant differentially expressed protein between COVID-19 positive and negative. (I) Violin plot of few of the dysregulated host proteins such as SERPIND1, VWF, and MIF protein in COVID-19 positive (***1.00e-04 < p ≤ 1.00e-03). (J) Heatmap of top 27 significant differentially expressed proteins in COVID-19 positive and negative.
FIGURE 2
FIGURE 2
Proteomic analysis of COVID-19 non-severe and COVID-19 severe patients. (A) Heatmap of top 25 differentially expressed proteins in COVID-19 severe when compared with the non-severe (B,C) depicts the PLS-DA clustering and significant differentially expressed proteins in the form of volcano plot in the COVID-19 severe when compared with the non-severe, respectively. (D) Violin plot showing a panel of 8 differentially expressed proteins in the severe vs. non-severe samples (**1.00e-03 < p ≤ 1.00e-02; ***1.00e-04 < p ≤ 1.00e-03; ****p ≤ 1.00e-04).
FIGURE 3
FIGURE 3
Machine learning–based approach for identification of severity classifiers and validation of protein markers using MRM approach. (A) Demonstrates the schematic workflow of machine learning and MRM validation. (B) The parallel coordinate plot and prediction response labels. (C) Depicts the top 20 features and their variable importance in projection (VIP) scores in the X-axis. (D) The confusion matrix plotted from the model prediction. (E) Displays the ROC–AUC curve of SERPINA3, APOB, and FGG from the severity model prediction. (F) MRM analysis of proteins overexpressed in COVID-19 severe vs. COVID-19 non-severe patient samples, as identified in the LFQ analysis and machine learning approach. Peak shapes (as seen in Skyline) of representative peptides of proteins AGT, APOB, SERPINA3, FGG, and SERPING1, respectively. (G) Box plots showing the overexpression of same proteins in severe as compared with non-severe samples in terms of the MRM peak areas (t-test, **p < 0.05; fold change > 3 at a CI of 95–99% determined by Skyline).
FIGURE 4
FIGURE 4
Biological pathways and network analysis of differentially expressed proteins in severe vs. non-severe comparison. (A) Represents the Metascape enriched biological processes with their co-expressed proteins in the form a bipartite network where few proteins have been shown in the form violin plot (ns: 5.00e-02 < p ≤ 1.00e + 00; *1.00e-02 < p ≤ 5.00e-02; **1.00e-03 < p ≤ 1.00e-02; ***1.00e-04 < p ≤ 1.00e-03; ****p ≤ 1.00e-04). (B) The network of enriched terms, generated using String (version 11.0) shows colored clusters, where the nodes that share the same clusters are typically close to each other.
FIGURE 5
FIGURE 5
In silico molecular docking of small molecules against upregulated proteins from different stages of COVID-19 infection. Figure showing the docking results of three different target proteins SERPINA7 (non-severe vs. severe), SERPIND1 (non-severe vs. severe), and S100A9 (COVID-19 positive vs. COVID-19 negative) with two FDA-approved drugs selinexor and ponatinib. (A) The predicted 2D interaction map of selinexor with SERPINA7. (B) The 3D representation of predicted binding pockets of the two drugs to the targeted proteins. The binding affinity of selinexor SERPINA7 is -9.3 kcal/mol, SERPIND1 is -8.7 kcal/mol of binding affinity, and S100A9 is -7.5 kcal/mol. Drug ponatinib binds with SERPINA7 with -9.3 kcal/mol of binding affinity and with SERPIND1 with -8.4 kcal/mol binding affinity.

References

    1. Ahmed Z., Mohamed K., Zeeshan S., Dong X. (2020). Artificial intelligence with multi- functional machine learning platform development for better healthcare and precision medicine. Database 2020:baaa010. - PMC - PubMed
    1. Al-Samkari H., Karp Leaf R. S., Dzik W. H., Carlson J. C. T., Fogerty A. E., Waheed A., et al. (2020). COVID-19 and coagulation: bleeding and thrombotic manifestations of SARS-CoV-2 infection. Blood 136 489–500. 10.1182/blood.2020006520 - DOI - PMC - PubMed
    1. Alsuliman T., Humaidan D., Sliman L. (2020). Machine learning and artificial intelligence in the service of medicine: necessity or potentiality?. Curr. Res. Transl. Med. 68 245–251. - PubMed
    1. Arif M., Niessen W. J., Schoots I. G., Veenland J. F. (2020). Automated classification of significant prostate cancer on MRI: a systematic review on the performance of machine learning applications. Cancers 12:1606. - PMC - PubMed
    1. Arimoto J., Ikura Y., Suekane T., Nakagawa M., Kitabayashi C., Iwasa Y., et al. (2010). Expression of LYVE-1 in sinusoidal endothelium is reduced in chronically inflamed human livers. J. Gastroenterol. 45 317–325. 10.1007/s00535-009-0152-5 - DOI - PubMed

LinkOut - more resources