

Agricultural Soils Amended With Thermally-Dried Anaerobically-Digested Sewage Sludge Showed Increased Risk of Antibiotic Resistance Dissemination
- PMID: 33995330
- PMCID: PMC8113772
- DOI: 10.3389/fmicb.2021.666854
Agricultural Soils Amended With Thermally-Dried Anaerobically-Digested Sewage Sludge Showed Increased Risk of Antibiotic Resistance Dissemination
Abstract
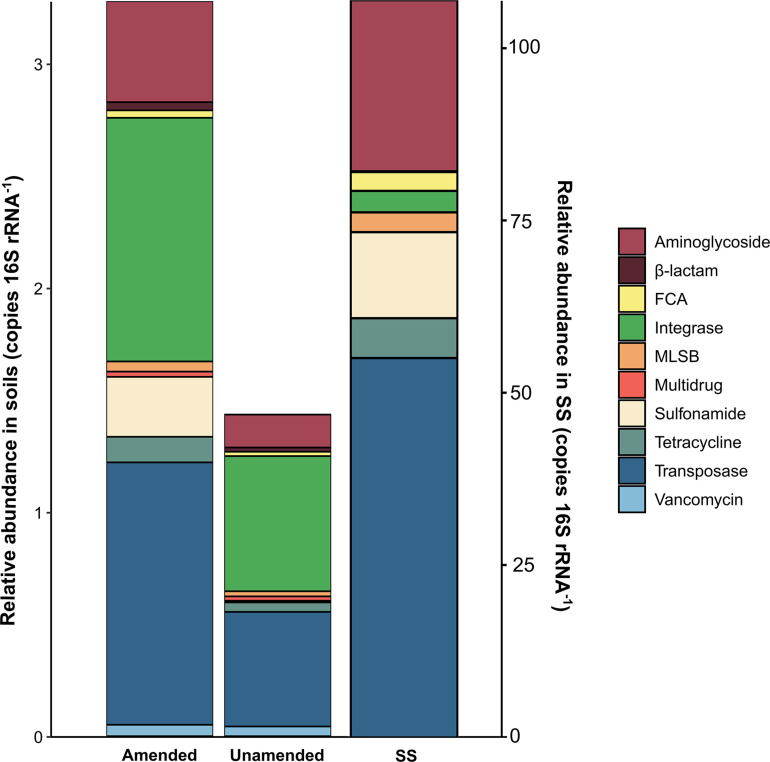
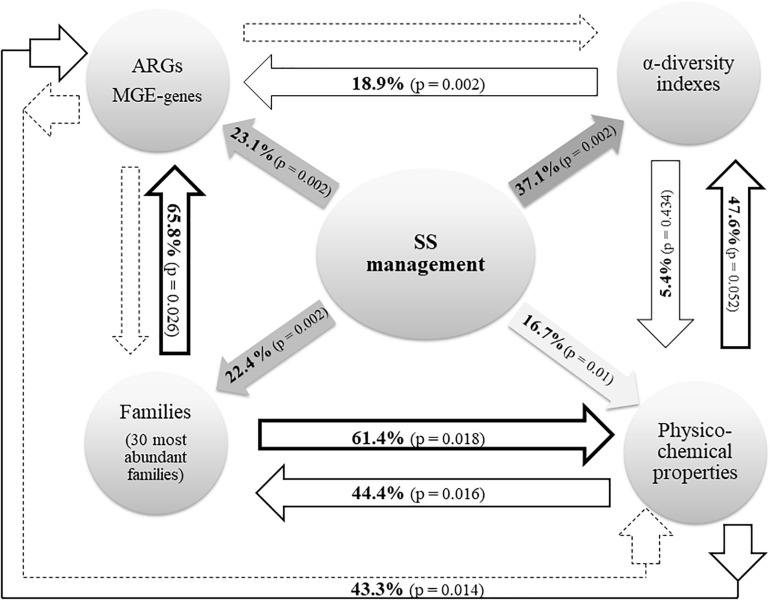
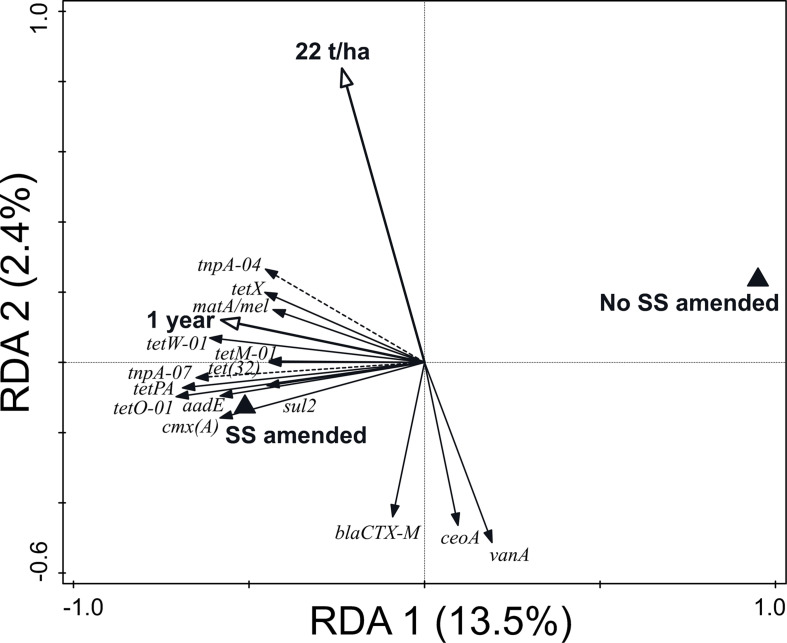
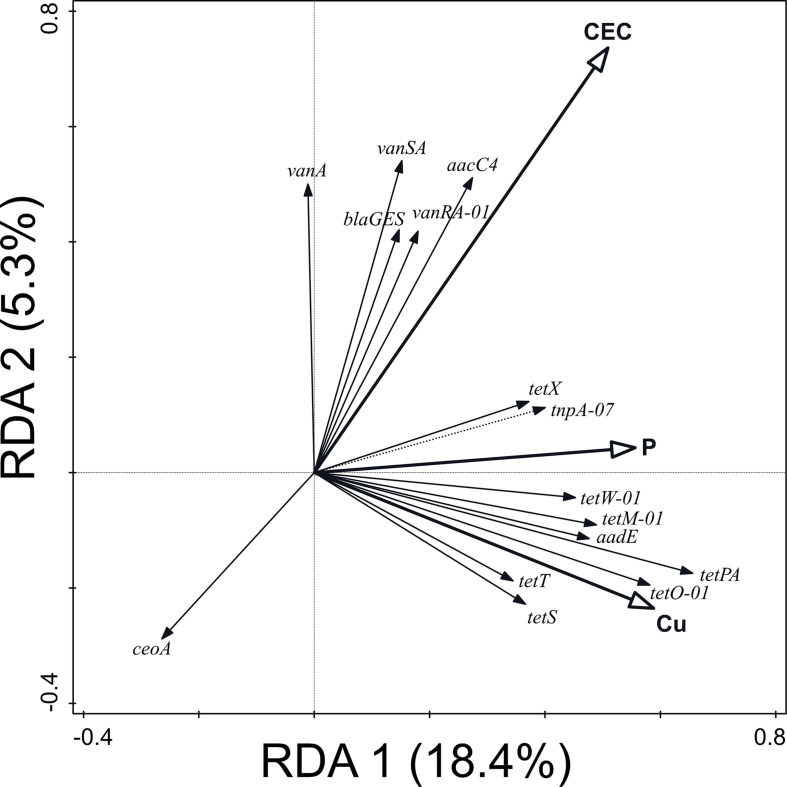
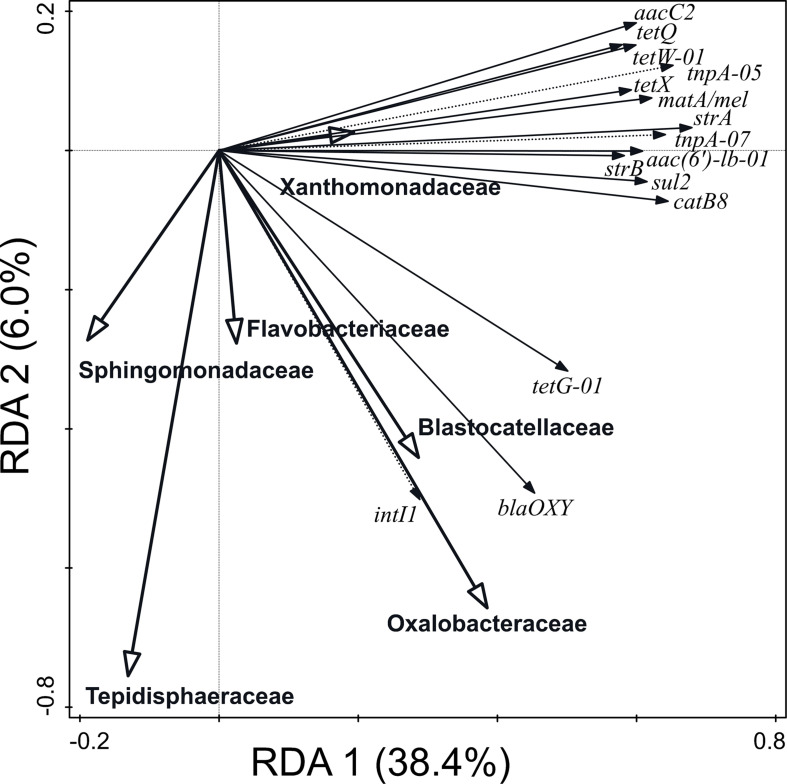
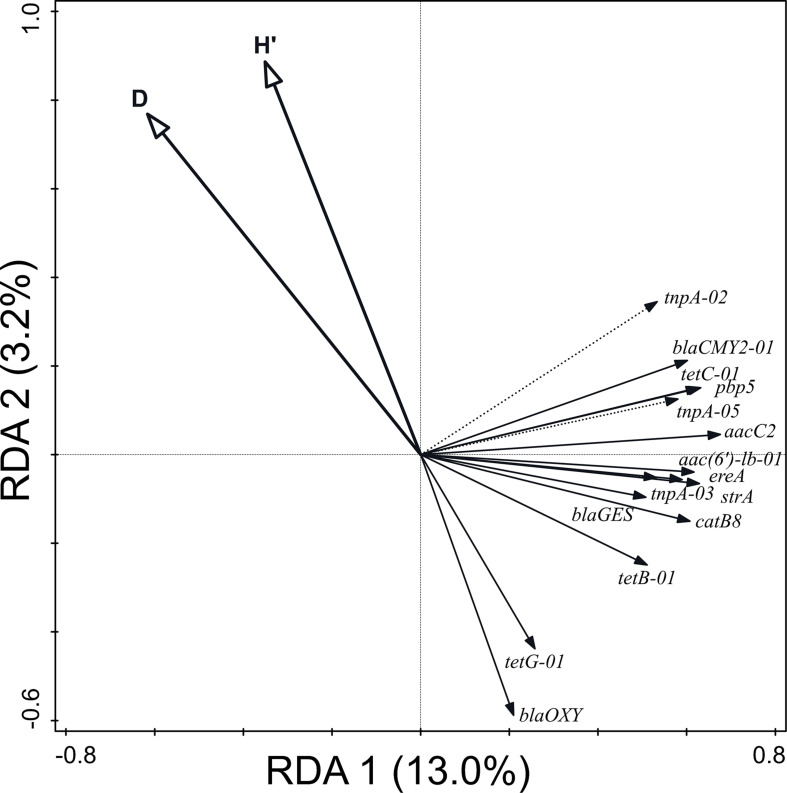
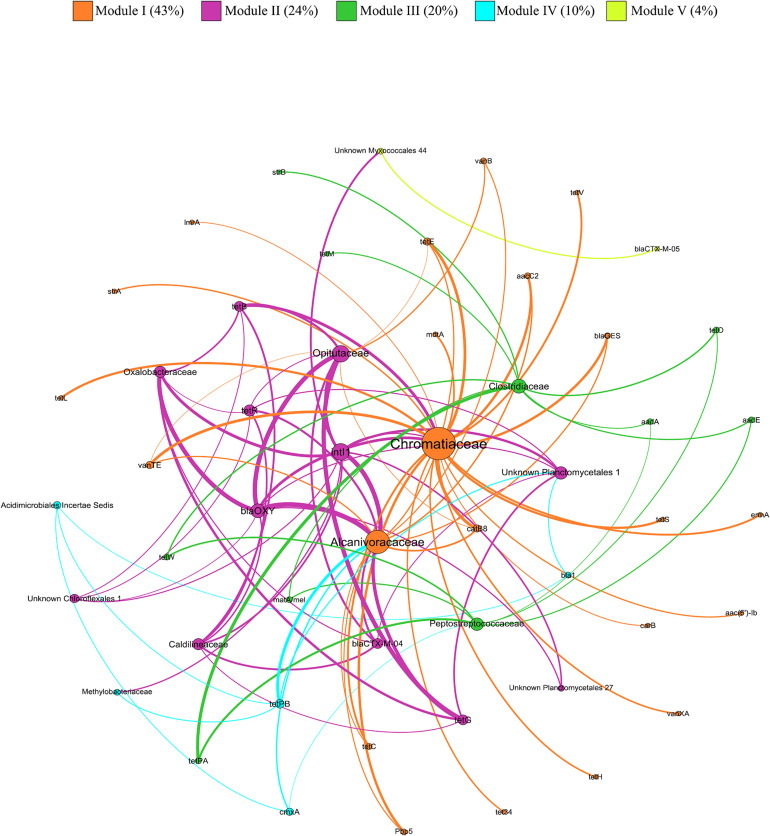
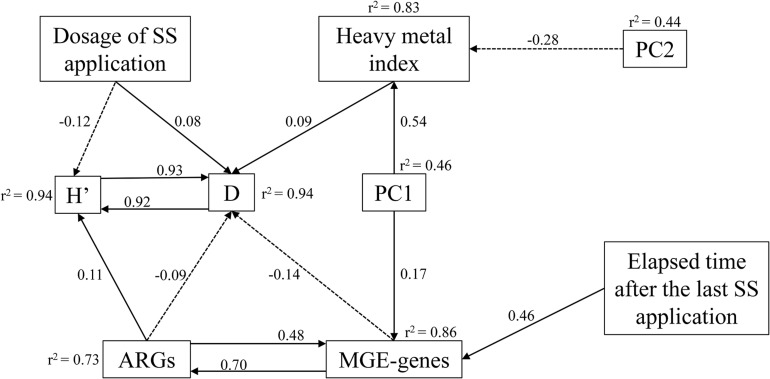
The application of sewage sludge (SS) to agricultural soil can help meet crop nutrient requirements and enhance soil properties, while reusing an organic by-product. However, SS can be a source of antibiotic resistance genes (ARGs) and mobile genetic elements (MGEs), resulting in an increased risk of antibiotic resistance dissemination. We studied the effect of the application of thermally-dried anaerobically-digested SS on (i) soil physicochemical and microbial properties, and (ii) the relative abundance of 85 ARGs and 10 MGE-genes in soil. Soil samples were taken from a variety of SS-amended agricultural fields differing in three factors: dose of application, dosage of application, and elapsed time after the last application. The relative abundance of both ARGs and MGE-genes was higher in SS-amended soils, compared to non-amended soils, particularly in those with a more recent SS application. Some physicochemical parameters (i.e., cation exchange capacity, copper concentration, phosphorus content) were positively correlated with the relative abundance of ARGs and MGE-genes. Sewage sludge application was the key factor to explain the distribution pattern of ARGs and MGE-genes. The 30 most abundant families within the soil prokaryotic community accounted for 66% of the total variation of ARG and MGE-gene relative abundances. Soil prokaryotic α-diversity was negatively correlated with the relative abundance of ARGs and MGE-genes. We concluded that agricultural soils amended with thermally-dried anaerobically-digested sewage sludge showed increased risk of antibiotic resistance dissemination.
Keywords: antibiotic resistance genes; emerging contaminants; mobile genetic elements; organic fertilization; soil microbial diversity; soil quality.
Copyright © 2021 Jauregi, Epelde, Alkorta and Garbisu.
Conflict of interest statement
The authors declare that the research was conducted in the absence of any commercial or financial relationships that could be construed as a potential conflict of interest.
Figures
Similar articles
-
Application of sewage sludge to agricultural soil increases the abundance of antibiotic resistance genes without altering the composition of prokaryotic communities.Sci Total Environ. 2019 Jan 10;647:1410-1420. doi: 10.1016/j.scitotenv.2018.08.092. Epub 2018 Aug 8. Sci Total Environ. 2019. PMID: 30180347
-
Long-Term Impact of Field Applications of Sewage Sludge on Soil Antibiotic Resistome.Environ Sci Technol. 2016 Dec 6;50(23):12602-12611. doi: 10.1021/acs.est.6b02138. Epub 2016 Nov 23. Environ Sci Technol. 2016. PMID: 27934260
-
Antibiotic Resistance in Agricultural Soil and Crops Associated to the Application of Cow Manure-Derived Amendments From Conventional and Organic Livestock Farms.Front Vet Sci. 2021 Feb 23;8:633858. doi: 10.3389/fvets.2021.633858. eCollection 2021. Front Vet Sci. 2021. PMID: 33708812 Free PMC article.
-
A critical review of the bioavailability and impacts of heavy metals in municipal solid waste composts compared to sewage sludge.Environ Int. 2009 Jan;35(1):142-56. doi: 10.1016/j.envint.2008.06.009. Epub 2008 Aug 8. Environ Int. 2009. PMID: 18691760 Review.
-
Enrichment of antibiotic resistance genes (ARGs) in polyaromatic hydrocarbon-contaminated soils: a major challenge for environmental health.Environ Sci Pollut Res Int. 2021 Mar;28(10):12178-12189. doi: 10.1007/s11356-020-12171-3. Epub 2021 Jan 4. Environ Sci Pollut Res Int. 2021. PMID: 33394421 Review.
Cited by
-
Safety Level of Microorganism-Bearing Products Applied in Soil-Plant Systems.Front Plant Sci. 2022 Apr 28;13:862875. doi: 10.3389/fpls.2022.862875. eCollection 2022. Front Plant Sci. 2022. PMID: 35574066 Free PMC article. Review.
-
Comment on "Cow products: boon to human health and food security".Trop Anim Health Prod. 2023 Sep 22;55(5):316. doi: 10.1007/s11250-023-03712-2. Trop Anim Health Prod. 2023. PMID: 37737878 No abstract available.
-
Regulation of Antibiotic Resistance Genes on Agricultural Land Is Dependent on Both Choice of Organic Amendment and Prevalence of Predatory Bacteria.Antibiotics (Basel). 2024 Aug 10;13(8):750. doi: 10.3390/antibiotics13080750. Antibiotics (Basel). 2024. PMID: 39200050 Free PMC article.
-
Development of a high-throughput platform to measure plasmid transfer frequency.Front Cell Infect Microbiol. 2023 Oct 11;13:1269732. doi: 10.3389/fcimb.2023.1269732. eCollection 2023. Front Cell Infect Microbiol. 2023. PMID: 37886666 Free PMC article.
-
From Sewage Sludge to the Soil-Transfer of Pharmaceuticals: A Review.Int J Environ Res Public Health. 2022 Aug 18;19(16):10246. doi: 10.3390/ijerph191610246. Int J Environ Res Public Health. 2022. PMID: 36011880 Free PMC article. Review.
References
-
- Annabi M., Le Bissonnais Y., Le Villio-Poitrenaud M., Houot S. (2011). Improvement of soil aggregate stability by repeated applications of organic amendments to a cultivated silty loam soil. Agric. Ecosyst. Environ. 144 382–389. 10.1016/j.agee.2011.07.005 - DOI
-
- Antoniadis V., Koutroubas S. D., Fotiadis S. (2015). Nitrogen, phosphorus, and potassium availability in manure- and sewage sludge–applied soil. Commun. Soil Sci. Plant Anal. 46 393–404. 10.1080/00103624.2014.983241 - DOI
-
- Bai Y., Mei L., Zuo W., Zhang Y., Gu C., Shan Y., et al. (2019). Response of bacterial communities in coastal mudflat saline soil to sewage sludge amendment. Appl. Soil Ecol. 144 107–111. 10.1016/j.apsoil.2019.07.007 - DOI
LinkOut - more resources
Full Text Sources
Other Literature Sources