. 2021 Apr 28:12:659790.
doi: 10.3389/fimmu.2021.659790. eCollection 2021.

Three-Dimensional Model of Sub-Plasmalemmal Ca2+ Microdomains Evoked by the Interplay Between ORAI1 and InsP3 Receptors

Affiliations

Three-Dimensional Model of Sub-Plasmalemmal Ca2+ Microdomains Evoked by the Interplay Between ORAI1 and InsP3 Receptors

Diana Gil et al. Front Immunol. .

Abstract

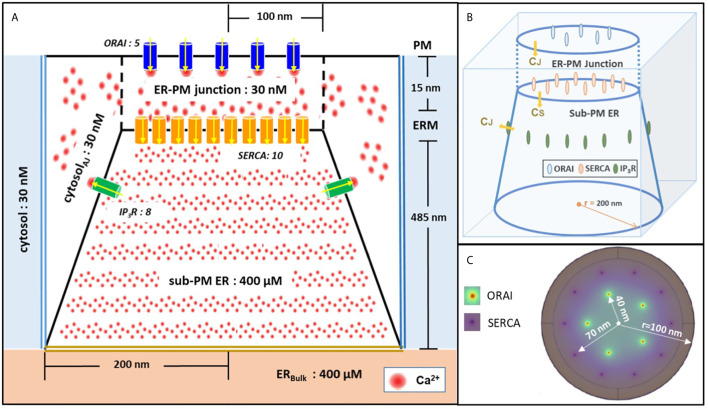
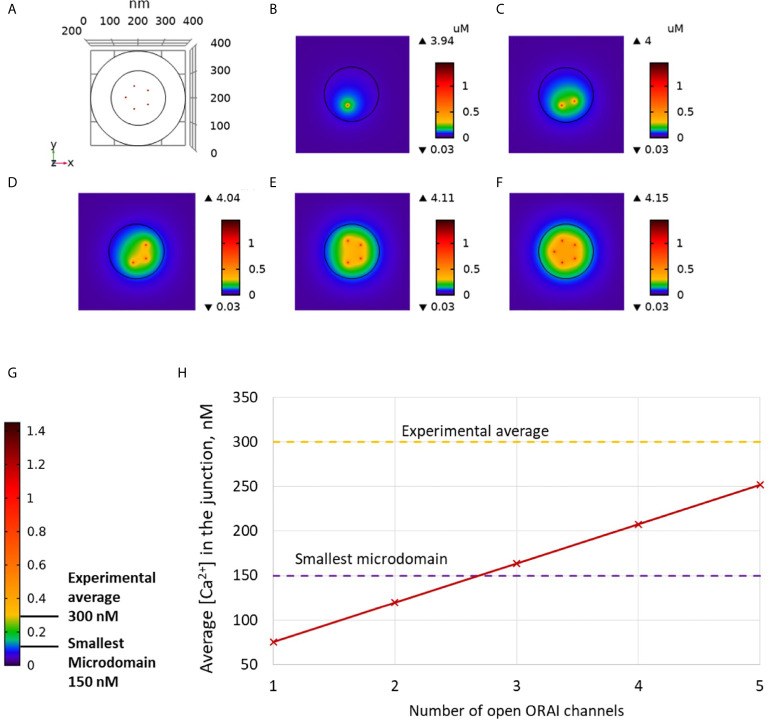
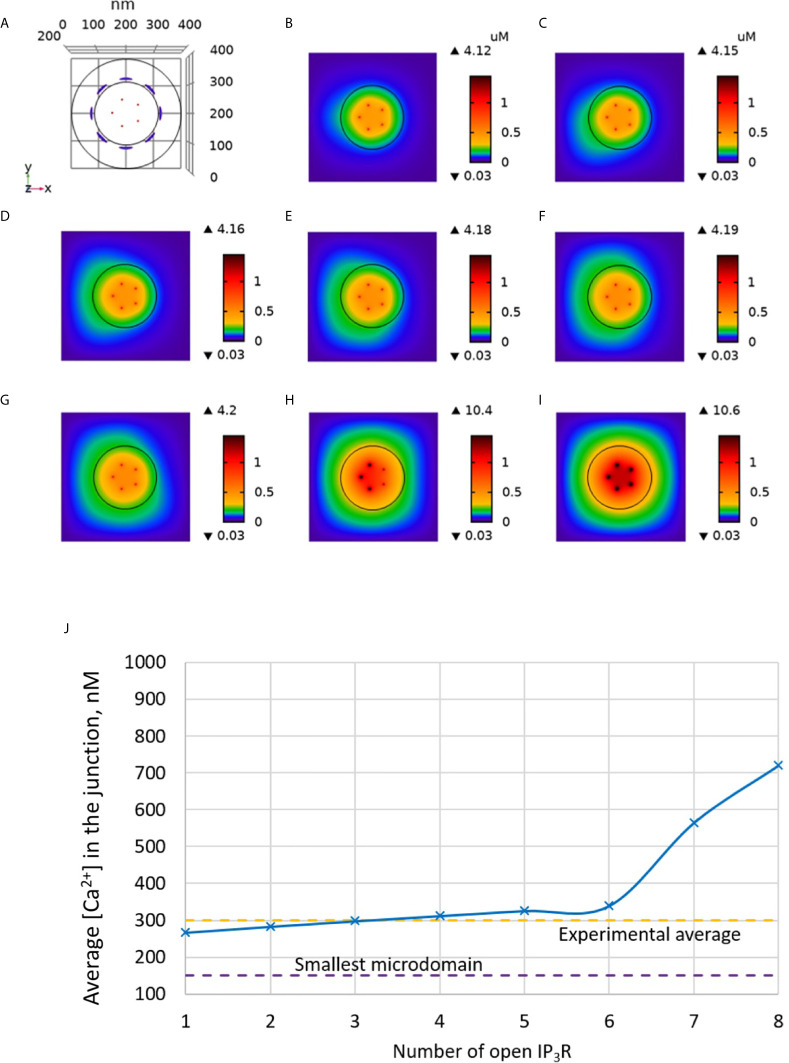
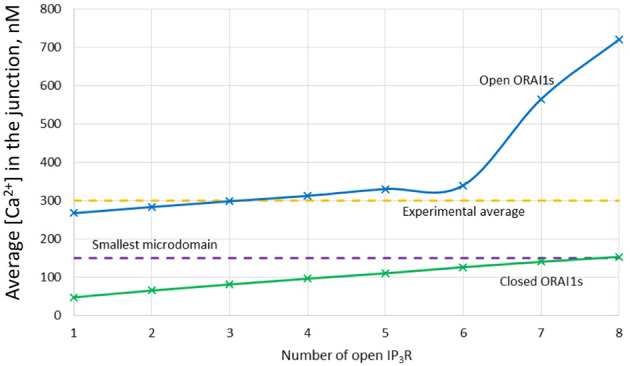
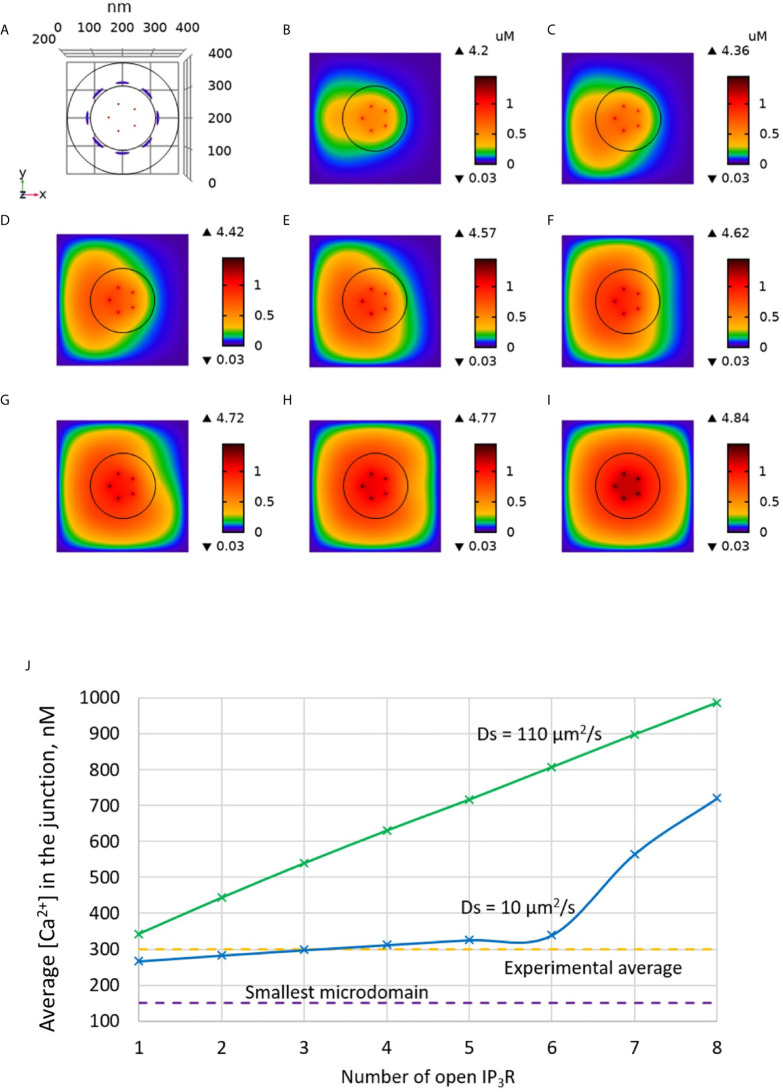
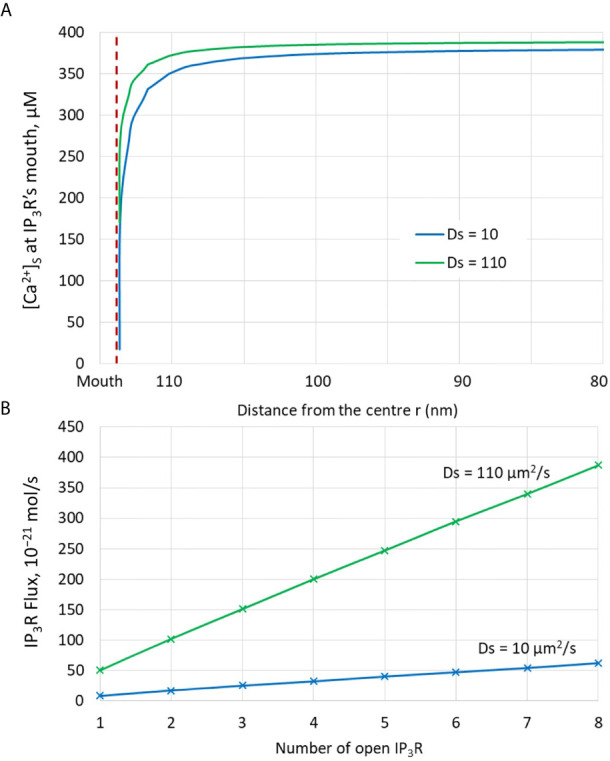
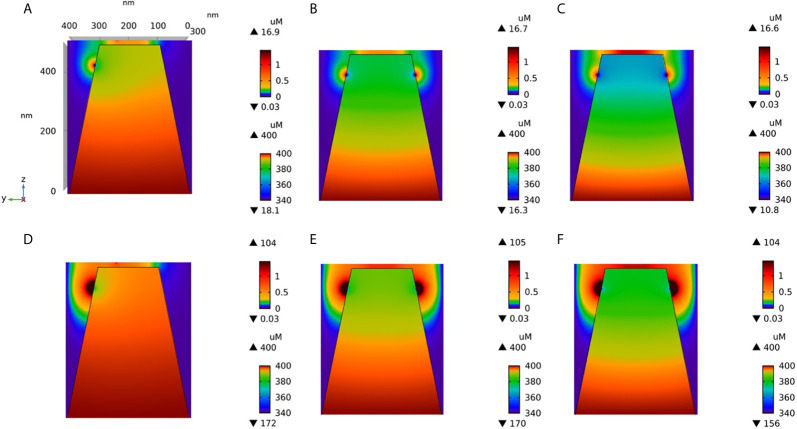
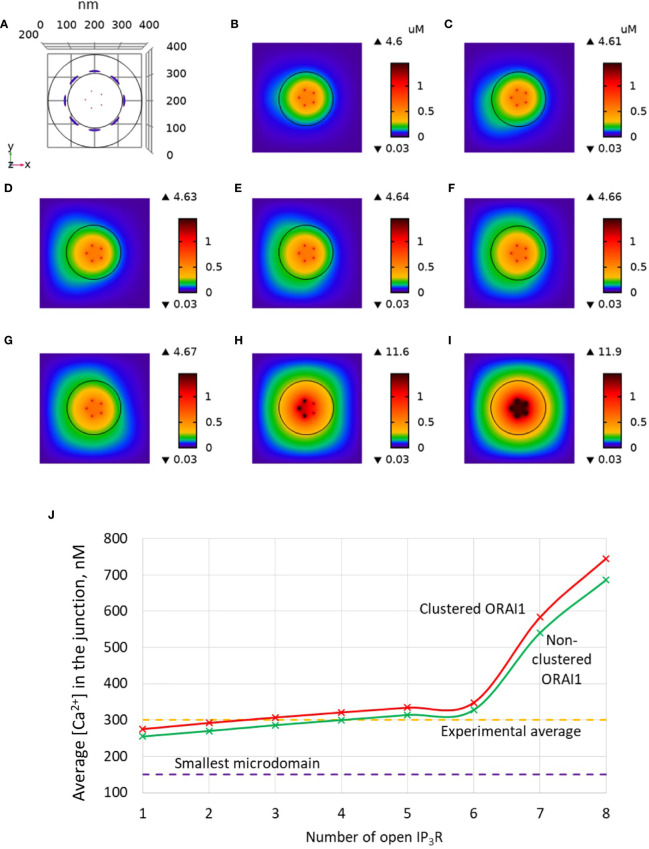
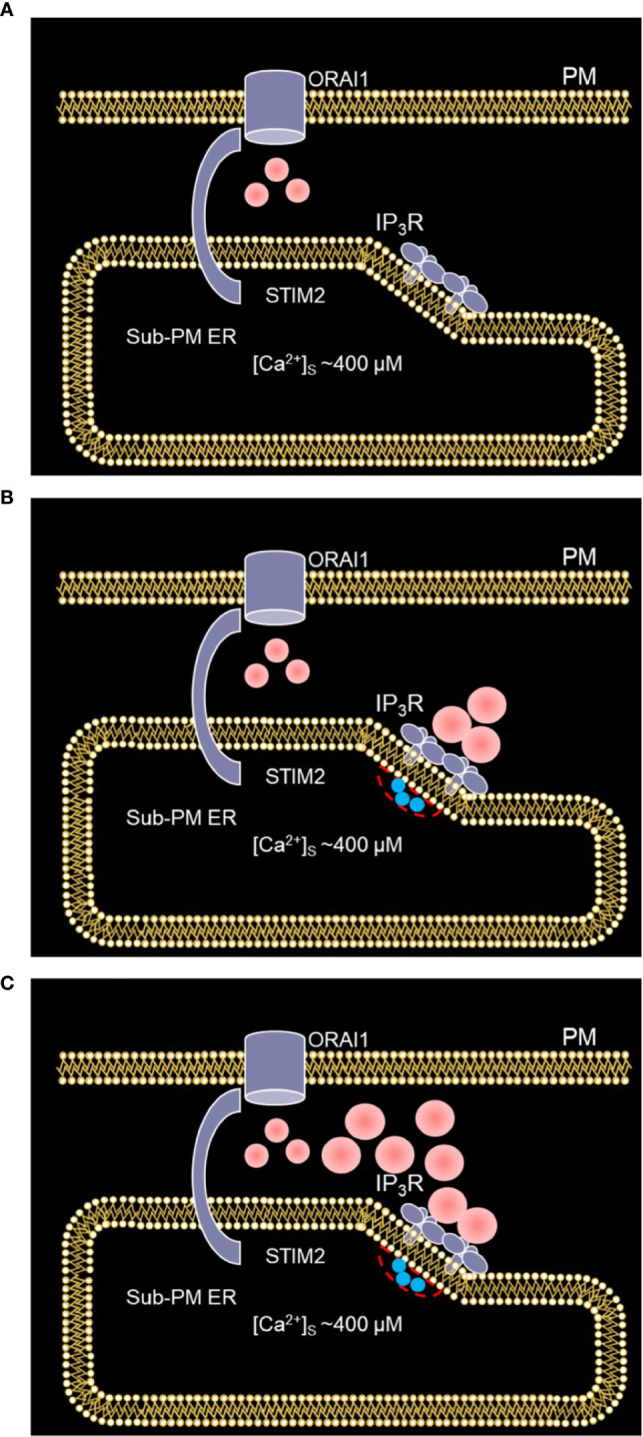
Ca2+ signaling plays an essential role in T cell activation, which is a key step to start an adaptive immune response. During the transition from a quiescent to a fully activated state, Ca2+ microdomains characterized by reduced spatial and temporal extents are observed in the junctions between the plasma membrane (PM) and the endoplasmic reticulum (ER). Such Ca2+ responses can also occur in response to T cell adhesion to other cells or extracellular matrix proteins in otherwise unstimulated T cells. These non-TCR/CD3-dependent Ca2+ microdomains rely on d-myo-inositol 1,4,5-trisphosphate (IP3) signaling and subsequent store operated Ca2+ entry (SOCE) via the ORAI/STIM system. The detailed molecular mechanism of adhesion-dependent Ca2+ microdomain formation remains to be fully elucidated. We used mathematical modeling to investigate the spatiotemporal characteristics of T cell Ca2+ microdomains and their molecular regulators. We developed a reaction-diffusion model using COMSOL Multiphysics to describe the evolution of cytosolic and ER Ca2+ concentrations in a three-dimensional ER-PM junction. Equations are based on a previously proposed realistic description of the junction, which is extended to take into account IP3 receptors (IP3R) that are located next to the junction. The first model only considered the ORAI channels and the SERCA pumps. Taking into account the existence of preformed clusters of ORAI1 and STIM2, ORAI1 slightly opens in conditions of a full ER. These simulated Ca2+ microdomains are too small as compared to those observed in unstimulated T cells. When considering the opening of the IP3Rs located near the junction, the local depletion of ER Ca2+ allows for larger Ca2+ fluxes through the ORAI1 channels and hence larger local Ca2+ concentrations. Computational results moreover show that Ca2+ diffusion in the ER has a major impact on the Ca2+ changes in the junction, by affecting the local Ca2+ gradients in the sub-PM ER. Besides pointing out the likely involvement of the spontaneous openings of IP3Rs in the activation of SOCE in conditions of T cell adhesion prior to full activation, the model provides a tool to investigate how Ca2+ microdomains extent and interact in response to T cell receptor activation.

Keywords: COMSOL; Calcium Signaling, T-cells; Store operated calcium entry (SOCE); computational model; non-TCR/CD3-dependent microdomains.


Conflict of interest statement

The authors declare that the research was conducted in the absence of any commercial or financial relationships that could be construed as a potential conflict of interest.

Figures

Figure 1
Figure 1
Schematic representation of the model geometry of the ER-PM junction and sub-PM ER used to investigate the origin of the Ca2+ microdomains in T cells. (A) Frontal diagram showing the dimensions of the cone that represents the sub-PM ER, of the junction and of the portion of the cytosol considered in the simulations. ORAI1 channels are in blue, SERCA pumps in yellow and IP3Rs in green. Plain lines represent membrane boundaries; dashed lines, fictitious limits between the junction and the cytosol and double lines indicate the limits of the simulated system. The resting Ca2+ concentrations considered as initial conditions and boundary conditions in the two compartments are indicated. (B) 3D view of the model geometry (C) Upper view of the positions of the ORAI1 channels on the PM, in green, and of the ERM, in purple, using COMSOL. Not to scale. This geometry is based on McIvor et al. (32). See text for details.
Figure 2
Figure 2
Simulated Ca2+ microdomains resulting from the opening of ORAI1 channels under the conditions of a full ER. (A) Upper view of the arrangement of the ORAI1 channels on the PM of the junction using COMSOL. (B–F) Steady-state Ca2+ profiles in the junction when opening 1 (B) to 5 (F) ORAI1 channels simultaneously. Left bars indicate the color codes, together with the minimal and maximal concentrations reached in the related panels. Shown are the profiles 22ms after opening of the ORAI1s, but these stabilize very rapidly, after a few ms. (G) Extended color code with marking of the smallest amplitude experimentally considered to correspond to a microdomain and of the average amplitude of microdomain in unstimulated T cells (4). (H) Evolution of the amplitude of the simulated Ca2+ microdomains with the number of simultaneously open ORAI1 in the junction, showing that experimentally observed microdomains cannot result from the sole opening of the ORAI1 in conditions of a full ER that only allows for a partial opening of these channels (see text).
Figure 3
Figure 3
Simulated Ca2+ microdomains resulting from the opening of the IP3Rs adjacent to the junctions, which in turn induces the opening of ORAI1 channels in the junctions as a result of local depletion of ER Ca2+. (A) Upper view of the arrangement of the ORAI1 channels on the PM of the junction (red dots) and of the adjacent IP3Rs (blue lines) using COMSOL. (B–I) Steady-state Ca2+ profiles in the junction when opening 1 (B) to 8 (I) IP3Rs simultaneously. Left bars indicate the color codes, together with the minimal and maximal concentrations reached in the related panel. Shown are the profiles 22ms after opening of the IP3Rs. Upon depletion of local Ca2+ in the ER, which is quasi-instantaneous, ORAI1 channels open to an extent that depends on this local concentration, as defined by the function f (see Supplementary Information ). ORAI1 opening is assumed to occur immediately after depletion because ORAI1-STIM2 aggregates are pre-formed (4). (J) Evolution of the amplitude of the simulated Ca2+ microdomains with the number of simultaneously open IP3Rs in the junction, showing that experimentally observed microdomains can in principle result from the opening of ORAI1 channels induced by the spontaneous opening of a few IP3Rs near the junction, in conditions of a full ER.
Figure 4
Figure 4
Evolution of the amplitude of the simulated Ca2+ microdomains with the number of simultaneously open IP3Rs in the junction in the presence and in the absence of ORAI1s in the junction. The blue curve (with ORAI1) corresponds to the situation considered in Figure 3 . The theoretical situation of a junction that does not contain ORAI1 channels (green curve) allows to appreciate that the contribution of Ca2+ released through the IP3Rs to the Ca2+ microdomain is rather limited.
Figure 5
Figure 5
Influence of the value of the Ca2+ diffusion coefficient in the ER (DS) on the Ca2+ microdomains in the ER-PM junction. (A) Upper view of the arrangement of the ORAI1 channels on the PM of the junction (red dots) and of the adjacent IP3Rs (blue lines) using COMSOL. (B–I) Steady-state Ca2+ profiles in the junction when opening 1 (B) to 8 (I) IP3Rs simultaneously with DS = 110 μm2/s. Left bars indicate the color codes, together with the minimal and maximal concentrations reached in the related panels. Shown are the profiles 22ms after opening of the IP3Rs. Upon depletion of local Ca2+ in the ER, which is quasi-instantaneous, ORAI1 channels open to an extent that depends on this local concentration, as defined by the function f (see Supplementary Information ). ORAI1 opening is assumed to occur immediately after depletion because ORAI1-STIM2 aggregates are pre-formed (4). (J) Evolution of the amplitude of the simulated Ca2+ microdomains with the number of simultaneously open IP3Rs in the junction. Results obtained with the default value for DS (10 μm2/s) corresponding to the results shown in Figure 3 are also indicated for comparison.
Figure 6
Figure 6
Analysis of the influence of the presence of IP3Rs and of the value of the Ca2+ diffusion coefficient in the ER, DS. (A) Ca2+ concentration around the luminal mouth of an IP3R for the two values of DS considered in the simulations. The largest this value, the fastest the replenishment around an open channel. (B) Fluxes through open IP3Rs for the two values of DS considered in the simulations. Because of faster replenishment around an open channel when DS is larger, the concentration gradient around the two extremities of the channel pore is larger, and hence the flux.
Figure 7
Figure 7
Cross-section of the Ca2+ profiles in the junction, in the cytosol adjacent to the junction and in the sub-PM ER during microdomain for two values of the Ca2+ diffusion coefficient in the ER, DS. (A–C): microdomains created by the opening of 2, 5 and 7 IP3Rs, respectively, for DS = 10 μm2/s. Local depletion of ER Ca2+ provokes the opening of the nearby ORAI1s. This situation corresponds to the one shown in Figure 3 . (D–F): microdomains created by the opening of 2, 5 and 7 IP3Rs, respectively, for DS = 110 μm2/s. Local depletion of ER Ca2+ provokes the opening of the nearby ORAI1s. This situation corresponds to the one shown in Figure 5 . For all panels, the upper right bar indicates the color code of Ca2+ concentration in the cytosol while the lower right bar indicates the color code of Ca2+ concentration in the ER.
Figure 8
Figure 8
Influence of the distance between ORAI1 channels on the Ca2+ microdomains in the ER-PM junction. The situation is similar to the default situation shown in Figure 3 , except for the distance between ORAI1 channels that is here equal to 37.7 nm (clustered) instead of 47 nm (non-clustered). (A) Upper view of the arrangement of the ORAI1 channels on the PM of the junction (red dots) and of the adjacent IP3Rs (blue lines) using COMSOL. (B–I) Steady-state Ca2+ profiles in the junction when opening 1 (B) to 8 (I) IP3Rs simultaneously. Left bars indicate the color codes, together with the minimal and maximal concentrations reached in the related panel. Shown are the profiles 22ms after opening of the IP3Rs. Upon depletion of local Ca2+ in the ER, which is quasi-instantaneous, ORAI1 channels open to an extent that depends on this local concentration, as defined by the function f (see Supplementary Information ). ORAI1 opening is assumed to occur immediately after depletion because ORAI1-STIM2 aggregates are pre-formed (4). (J) Evolution of the amplitude of the simulated Ca2+ microdomains with the number of simultaneously open IP3Rs in the junction. Results obtained with the default value of the inter-ORAI1 channels distance (47 nm, non-clustered) corresponding to the results shown in Figure 3 are also indicated for comparison.
Figure 9
Figure 9
Ca2+ fluxes through SERCA pumps in different simulation conditions showing that pumps are not saturated during Ca2+ microdomains. The curve represents the rate of pumping as a function of cytosolic Ca2+, as given by Eq. S19, with CS = 400 μM. Yellow symbols correspond to the opening of the 4 IP3Rs nearest to the SERCA, with the circle corresponding to DS = 10 μm2/s and the star to DS = 110 μm2/s. Green symbols correspond to the opening of the 4 IP3Rs furthest from the SERCA, with the circle corresponding to DS = 10 μm2/s and the star to DS = 110 μm2/s. The red diamond refers to a situation with closed IP3Rs, 5 ORAI1 channels of the junction being open as in Figure 2 .
Figure 10
Figure 10
Schematized representation of the proposed mechanism underlying the spontaneous formation of Ca2+ microdomains in T cells. (A) The smallest microdomains arise from nano-scale [Ca2+] fluctuations in the sub-PM ER leading to the opening of ORAI1 channels STIM2 inherently co-localized with STIM2. (B) Following a short, spontaneous activation of one or a few IP3Rs close to the junction, Ca2+ is released from the sub-PM ER into the cytosol. (C) The resulting local Ca2+ depletion close to the IP3R’s mouth provokes the unbinding of Ca2+ from STIM2, which further activates ORAI1 channels. This results in larger Ca2+ signals in the microdomains. Red spots represent Ca2+ ions.

Similar articles

Cited by

References

    1. Trebak M, Kinet JP. Calcium Signalling in T Cells. Nat Rev Immunol (2019) 19:154–69. 10.1038/s41577-018-0110-7 - DOI - PMC - PubMed
    1. Streb H, Irvine RF, Berridge MJ, Schulz I. Release of Ca2+ From a Nonmitochondrial Intracellular Store in Pancreatic Acinar Cells by Inositol-1,4,5-Trisphosphate. Nature (1983) 306:67–9. 10.1038/306067a0 - DOI - PubMed
    1. Wolf IM, Diercks BP, Gattkowski E, Czarniak F, Kempski J, Werner R, et al. . Frontrunners of T Cell Activation: Initial, Localized Ca2+ Signals Mediated by NAADP and the Type 1 Ryanodine Receptor. Sci Signaling (2015) 8:ra102. 10.1126/scisignal.aab0863 - DOI - PubMed
    1. Diercks BP, Werner R, Weidemüller P, Czarniak F, Hernandez L, Lehmann C, et al. . Orai1, STIM1/2, and RYR1 Shape Subsecond Ca2+ Microdomains Upon T Cell Activation. Sci Signaling (2018) 11:eaat0358. 10.1126/scisignal.aat0358 - DOI - PMC - PubMed
    1. Putney JW. Capacitative Calcium Entry: From Concept to Molecules. Immunol Rev (2009) 231:10–22. 10.1111/j.1600-065X.2009.00810.x - DOI - PubMed

Publication types

LinkOut - more resources