

Melatonin Synergizes With Mesenchymal Stromal Cells Attenuates Chronic Allograft Vasculopathy
- PMID: 33995416
- PMCID: PMC8116651
- DOI: 10.3389/fimmu.2021.672849
Melatonin Synergizes With Mesenchymal Stromal Cells Attenuates Chronic Allograft Vasculopathy
Erratum in
-
Corrigendum: Melatonin Synergizes With Mesenchymal Stromal Cells Attenuates Chronic Allograft Vasculopathy.Front Immunol. 2021 Sep 10;12:741234. doi: 10.3389/fimmu.2021.741234. eCollection 2021. Front Immunol. 2021. PMID: 34567004 Free PMC article.
Abstract
Background: Chronic rejection characterized by chronic allograft vasculopathy (CAV) remains a major obstacle to long-term graft survival. Due to multiple complicated mechanisms involved, a novel therapy for CAV remains exploration. Although mesenchymal stromal cells (MSCs) have been ubiquitously applied to various refractory immune-related diseases, rare research makes a thorough inquiry in CAV. Meanwhile, melatonin (MT), a wide spectrum of immunomodulator, plays a non-negligible role in transplantation immunity. Here, we have investigated the synergistic effects of MT in combination with MSCs in attenuation of CAV.
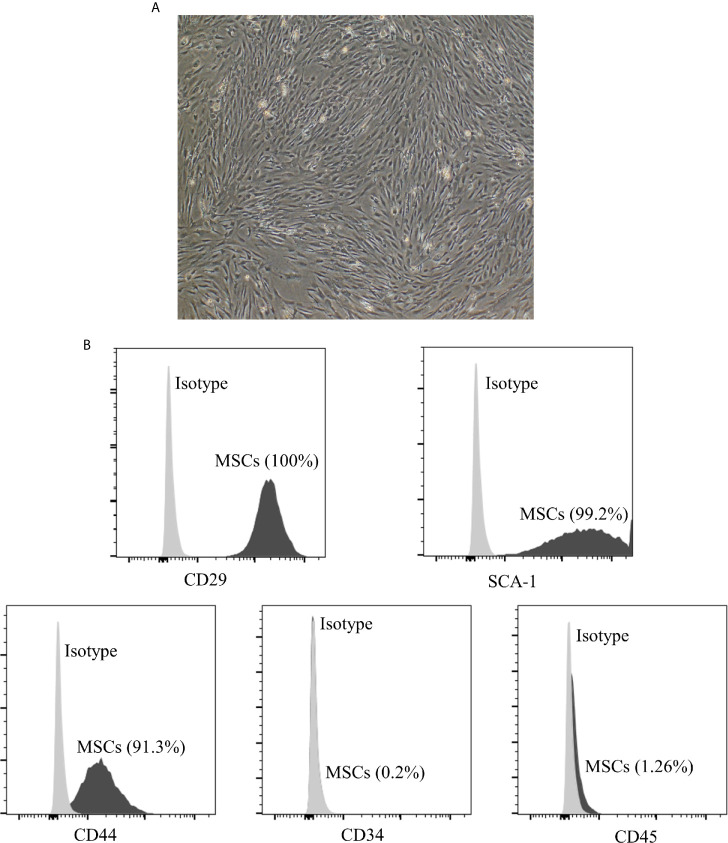
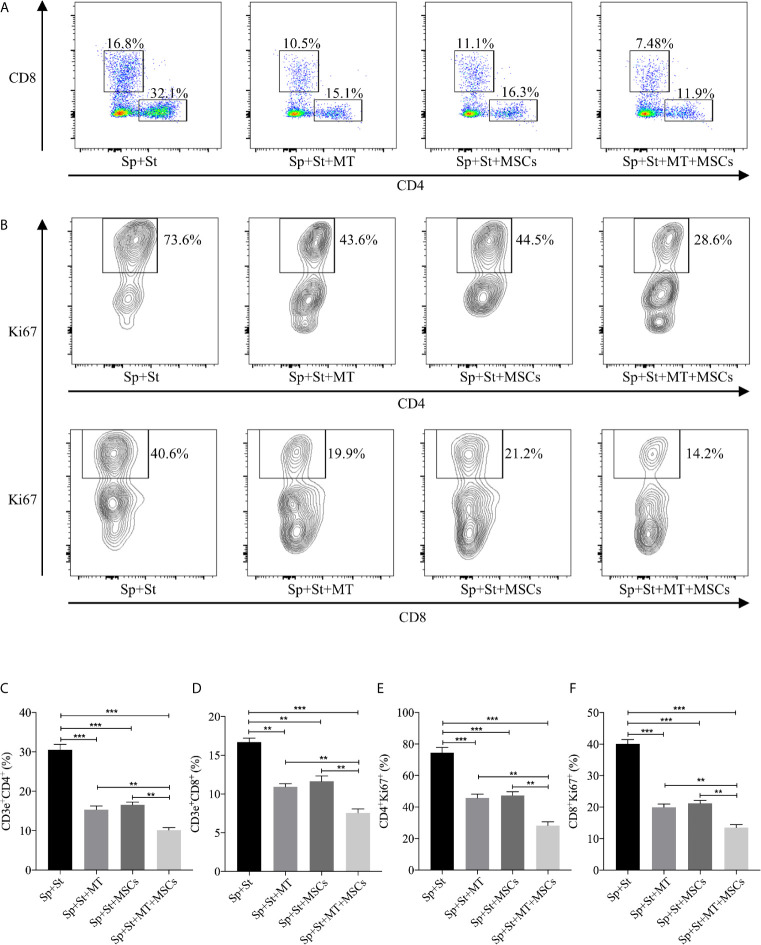
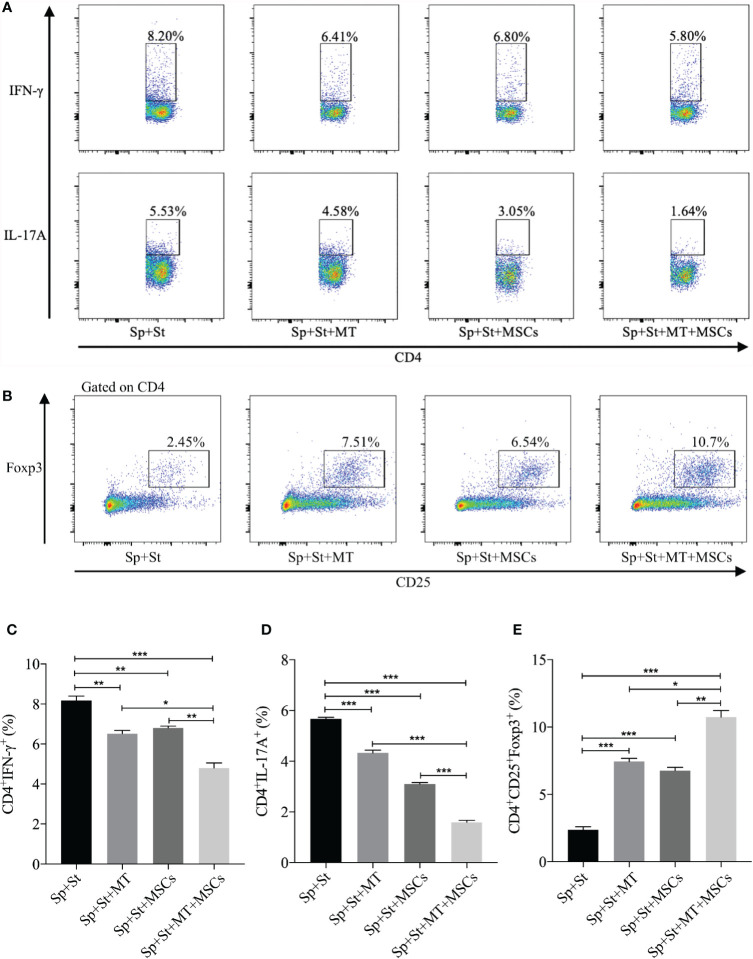
Methods: C57BL/6 (B6) mouse recipients receiving BALB/c mouse donor aorta transplantation have been treated with MT and/or adipose-derived MSCs. Graft pathological changes, intragraft immunocyte infiltration, splenic immune cell populations, circulating donor-specific antibodies levels, cytokine profiles were detected on post-operative day 40. The proliferation capacity of CD4+ and CD8+ T cells, populations of Th1, Th17, and Tregs were also assessed in vitro.
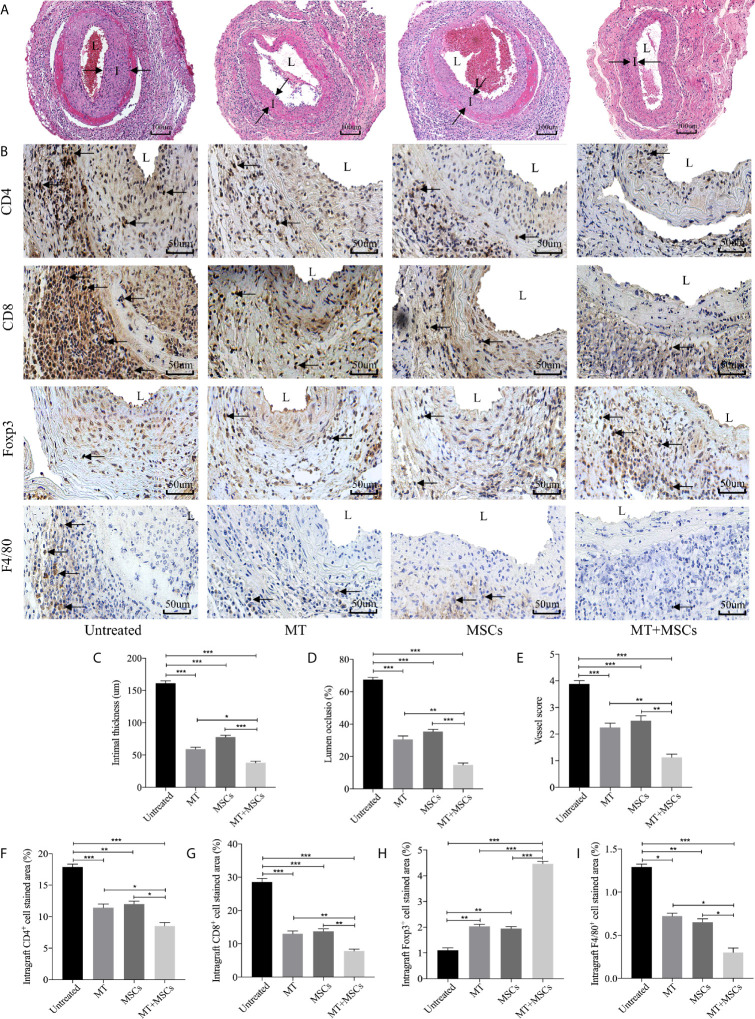
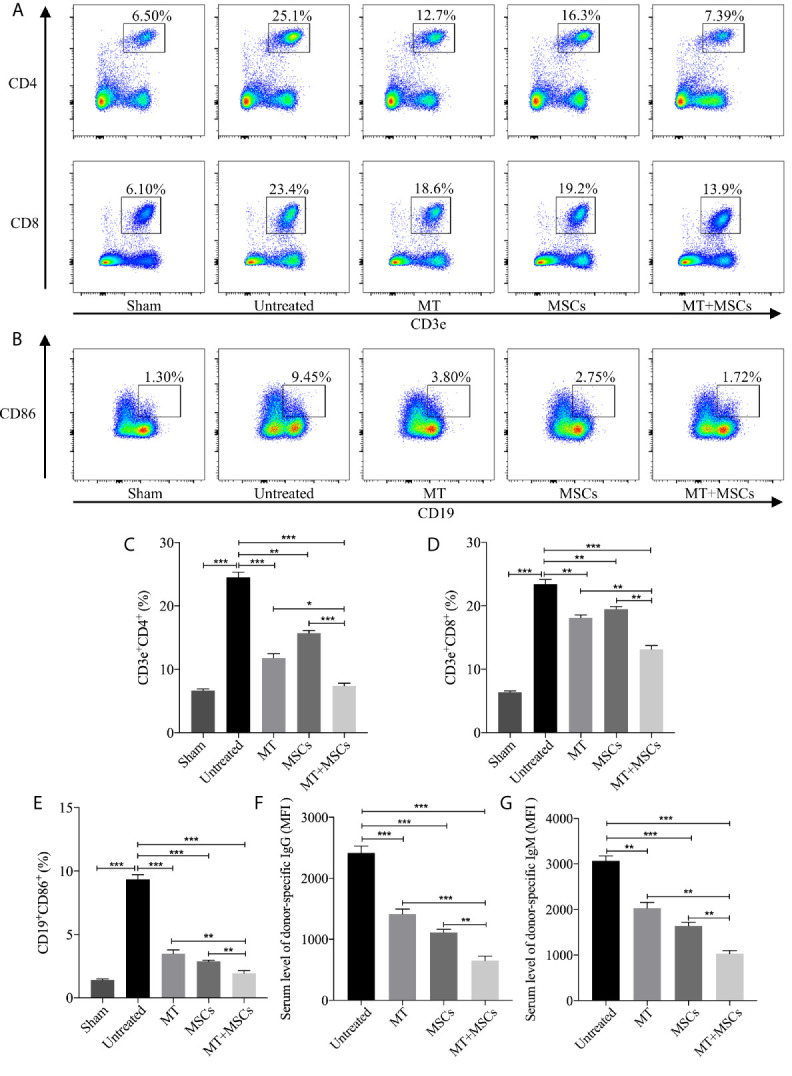
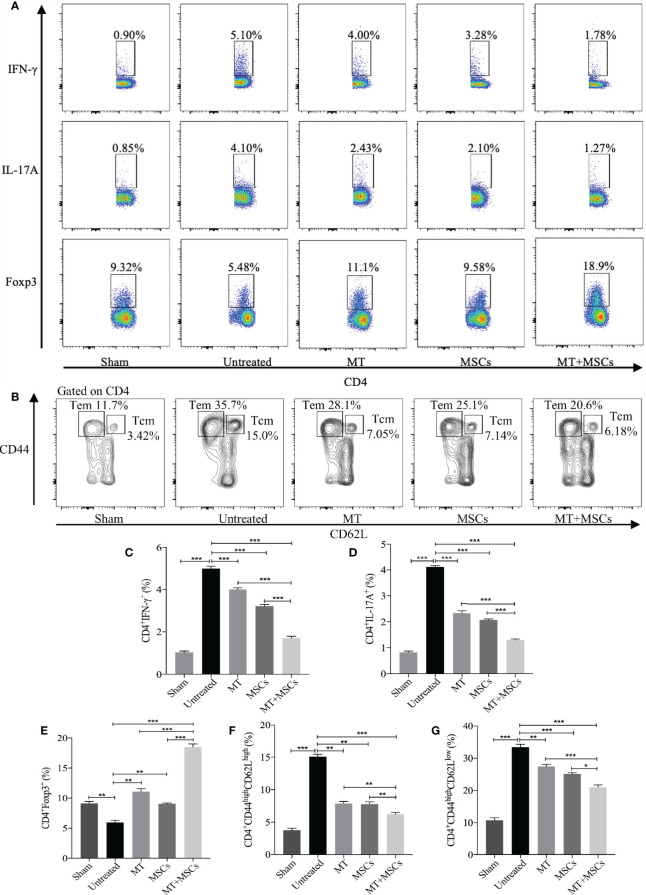
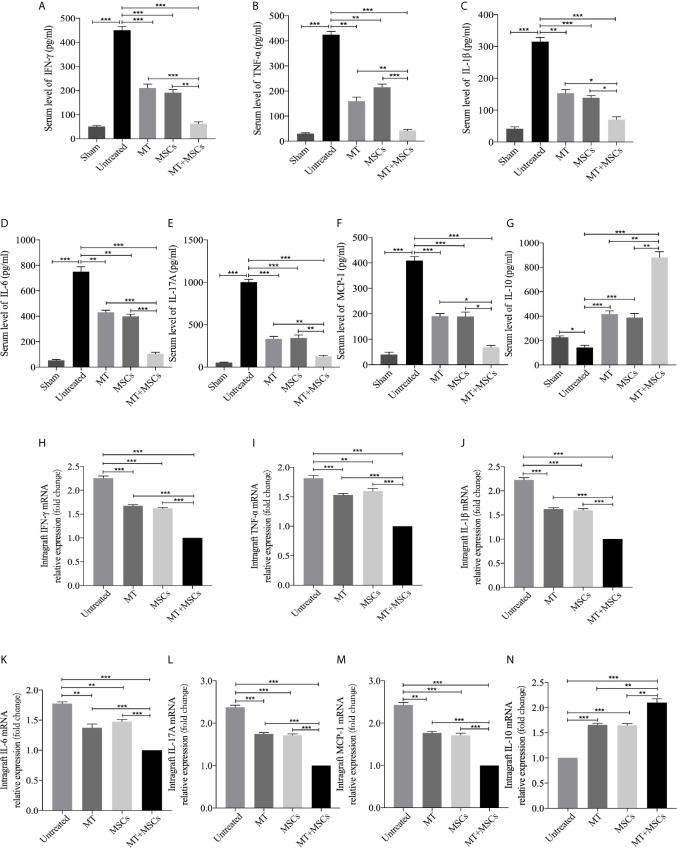
Results: Grafts in untreated recipients developed a typical pathological feature of CAV characterized by intimal thickening 40 days after transplantation. Compared to untreated and monotherapy groups, MT in combination with MSCs effectively ameliorated pathological changes of aorta grafts indicated by markedly decreased levels of intimal hyperplasia and the infiltration of CD4+ cells, CD8+ cells, and macrophages, but elevated infiltration of Foxp3+ cells. MT either alone or in combination with MSCs effectively inhibited the proliferation of T cells, decreased populations of Th1 and Th17 cells, but increased the proportion of Tregs in vitro. MT synergized with MSCs displayed much fewer splenic populations of CD4+ and CD8+ T cells, Th1 cells, Th17 cells, CD4+ central memory T cells (Tcm), as well as effector memory T cells (Tem) in aorta transplant recipients. In addition, the percentage of splenic Tregs was substantially increased in the combination therapy group. Furthermore, MT combined with MSCs markedly reduced serum levels of circulating allospecific IgG and IgM, as well as decreased the levels of pro-inflammatory IFN-γ, TNF-α, IL-1β, IL-6, IL-17A, and MCP-1, but increased the level of IL-10 in the recipients.
Conclusions: These data suggest that MT has synergy with MSCs to markedly attenuate CAV and provide a novel therapeutic strategy to improve the long-term allograft acceptance in transplant recipients.
Keywords: aorta transplantation; chronic allograft vasculopathy; melatonin; mesenchymal stromal cells; mice.
Copyright © 2021 Qin, Kong, Qin, Zhu, Li, Sun, Zhao, Wang, Hao and Wang.
Conflict of interest statement
The authors declare that the research was conducted in the absence of any commercial or financial relationships that could be construed as a potential conflict of interest.
Figures
Similar articles
-
Interleukin-37 contributes to endometrial regenerative cell-mediated immunotherapeutic effect on chronic allograft vasculopathy.Cytotherapy. 2024 Mar;26(3):299-310. doi: 10.1016/j.jcyt.2023.12.004. Epub 2023 Dec 29. Cytotherapy. 2024. PMID: 38159090
-
Recombinant human IL-37 attenuates acute cardiac allograft rejection in mice.Cytokine. 2024 Jul;179:156598. doi: 10.1016/j.cyto.2024.156598. Epub 2024 Apr 8. Cytokine. 2024. PMID: 38583255
-
Dose- and Time-Dependent Effects of Human Mesenchymal Stromal Cell Infusion on Cardiac Allograft Rejection in Mice.Stem Cells Dev. 2021 Feb;30(4):203-213. doi: 10.1089/scd.2019.0300. Epub 2021 Feb 4. Stem Cells Dev. 2021. PMID: 33371825
-
The potential of autologous regulatory T cell (Treg) therapy to prevent Cardiac Allograft Vasculopathy (CAV) in paediatric heart transplant recipients.Front Immunol. 2024 Sep 9;15:1444924. doi: 10.3389/fimmu.2024.1444924. eCollection 2024. Front Immunol. 2024. PMID: 39315099 Free PMC article. Review.
-
Mesenchymal stromal cells as a means of controlling pathological T-cell responses in allogeneic islet transplantation.Curr Opin Organ Transplant. 2013 Feb;18(1):59-64. doi: 10.1097/MOT.0b013e32835c2adf. Curr Opin Organ Transplant. 2013. PMID: 23222174 Review.
Cited by
-
IL-37 overexpression promotes endometrial regenerative cell-mediated inhibition of cardiac allograft rejection.Stem Cell Res Ther. 2022 Jul 15;13(1):302. doi: 10.1186/s13287-022-02982-1. Stem Cell Res Ther. 2022. PMID: 35841010 Free PMC article.
-
Toward transplantation tolerance with adipose tissue-derived therapeutics.Front Immunol. 2023 Apr 28;14:1111813. doi: 10.3389/fimmu.2023.1111813. eCollection 2023. Front Immunol. 2023. PMID: 37187733 Free PMC article. Review.
-
Improved therapeutic effects on vascular intimal hyperplasia by mesenchymal stem cells expressing MIR155HG that function as a ceRNA for microRNA-205.J Cell Mol Med. 2024 May;28(9):e18351. doi: 10.1111/jcmm.18351. J Cell Mol Med. 2024. PMID: 38693854 Free PMC article.
References
-
- Justiz Vaillant AA, Mohseni M. Chronic Transplantation Rejection. Statpearls. Treasure Island, FL: StatPearls Publishing Copyright © 2020, StatPearls Publishing LLC; (2020). - PubMed
-
- Lund LH, Khush KK, Cherikh WS, Goldfarb S, Kucheryavaya AY, Levvey BJ, et al. . The Registry of the International Society for Heart and Lung Transplantation: Thirty-fourth Adult Heart Transplantation Report-2017; Focus Theme: Allograft Ischemic Time. J Heart Lung Transplant (2017) 36(10):1037–46. doi: 10.1016/j.healun.2017.07.019 - DOI - PubMed
Publication types
MeSH terms
Substances
LinkOut - more resources
Full Text Sources
Other Literature Sources
Research Materials
Miscellaneous