. 2021 Apr 26:12:634594.
doi: 10.3389/fpls.2021.634594. eCollection 2021.

Gene Expression Patterns for Proteins With Lectin Domains in Flax Stem Tissues Are Related to Deposition of Distinct Cell Wall Types

Affiliations

Gene Expression Patterns for Proteins With Lectin Domains in Flax Stem Tissues Are Related to Deposition of Distinct Cell Wall Types

Natalia Petrova et al. Front Plant Sci. .

Abstract

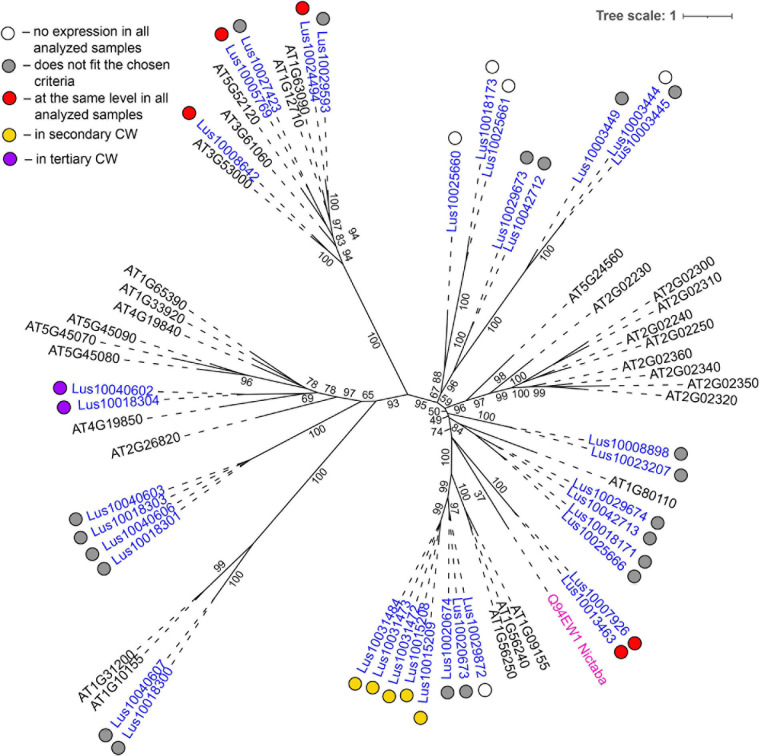
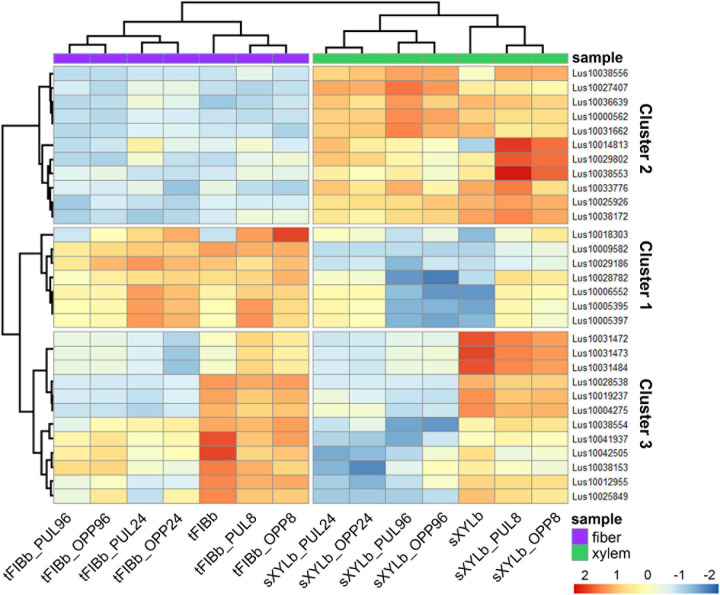
The genomes of higher plants encode a variety of proteins with lectin domains that are able to specifically recognize certain carbohydrates. Plants are enriched in a variety of potentially complementary glycans, many of which are located in the cell wall. We performed a genome-wide search for flax proteins with lectin domains and compared the expression of the encoding genes in different stem tissues that have distinct cell wall types with different sets of major polysaccharides. Over 400 genes encoding proteins with lectin domains that belong to different families were revealed in the flax genome; three quarters of these genes were expressed in stem tissues. Hierarchical clustering of the data for all expressed lectins grouped the analyzed samples according to their characteristic cell wall type. Most lectins differentially expressed in tissues with primary, secondary, and tertiary cell walls were predicted to localize at the plasma membrane or cell wall. These lectins were from different families and had various architectural types. Three out of four flax genes for proteins with jacalin-like domains were highly upregulated in bast fibers at the stage of tertiary cell wall deposition. The dynamic changes in transcript level of many genes for lectins from various families were detected in stem tissue over the course of gravitropic response induced by plant gravistimulation. The data obtained in this study indicate a large number of lectin-mediated events in plants and provide insight into the proteins that take part in tissue specialization and reaction to abiotic stress.

Keywords: amaranthin; cell wall; flax; gene expression; gravitropic reaction; jacalin; malectin; plant lectins.


Conflict of interest statement

The authors declare that the research was conducted in the absence of any commercial or financial relationships that could be construed as a potential conflict of interest.

Figures

FIGURE 1
FIGURE 1
Diagram of the samples collected from the flax stem. Abbreviations: SAM, shoot apical meristem; cPAR, cortical parenchyma; iFIB, phloem fibers at the stage of intrusive elongation; sXYL, stem xylem with secondary cell wall; tFIB, phloem fibers with tertiary cell walls; PCW, primary cell wall; SCW, secondary cell wall, TCW, tertiary cell wall.
FIGURE 2
FIGURE 2
Expression pattern of genes encoding proteins with lectin domains in all of the analyzed tissue samples collected from a flax stem (A) and datasets used in the analyses (B). A heatmap with a dendrogram of hierarchical clustering is displayed in a grid where each row represents a gene (n = 302) and each column represents a sample (n = 44) with replicates. The color scale (–4 to 4) represents the Z–score, calculated by normalized expression values for lectin genes in different tissues (TGR ≥ 16 in at least one sample), where blue-white-red represents the genes with down–, unchanged, and upregulated expression, respectively. PCW, SCW, and TCW are the major clusters of samples (see text). Abbreviations: PCW, primary cell wall; SCW, secondary cell wall; and TCW, tertiary cell wall; tFIBb and sXYLb, isolated fibers with TCW and stem xylem with SCW of non-inclined plant, respectively; tFIBb_PUL8, tFIBb_PUL24, tFIBb_PUL96 – isolated fibers with TCW from pulling side of flax stem after 8, 24, 96 h of gravibending, respectively; tFIBb_OPP8, tFIBb_OPP24, tFIBb_OPP96 – isolated fibers with TCW from opposite side of flax stem after 8, 24, 96 h of gravibending, respectively; sXYLb_PUL8, sXYlb_PUL24, sXYLb_PUL96 – pulling side of stem xylem with SCW after 8, 24, 96 h of gravibending, respectively; sXYLb_OPP8, sXYlb_OPP24, sXYLb_OPP96 – opposite side of stem xylem with SCW after 8, 24, 96 h of gravibending.
FIGURE 3
FIGURE 3
Phylogenetic dendrogram of malectin (PF11721) and malectin–like (PF12819) family members of Arabidopsis thaliana and Linum usitatissimum. The A. thaliana gene names are given in black font; additional gene names are given according to descriptions in the Uniprot database (https://www.uniprot.org/; The UniProt Consortium, 2019). The L. usitatissimum gene names are given in dark blue font. The different colored dots next to L. usitatissimum gene names indicate genes with different expression patterns. The criteria used for different expression pattern identification as follow: red, the mean values of tau-score < 0.15 across all samples; light blue, DEGs upregulated in samples with primary CW; yellow, DEGs upregulated in samples with secondary CW; purple dots, DEGs upregulated in samples with tertiary CW. Flax genes with red, light blue, yellow, and purple dots are listed in Tables 2–5, respectively. White dots indicate genes that are not expressed in the analyzed flax samples, and gray dots indicate genes where the expression does not fit the chosen criteria for a certain expression pattern (expression values for these genes are given in Supplementary File 3). Numbers indicate the ultrafast bootstrap support values for some branches. Abbreviations: DEGs, differentially expressed genes, a pairwise comparison log2FC ≥ 1; padj ≥ 0.01, CW, cell wall.
FIGURE 4
FIGURE 4
Phylogenetic dendrogram of legume (PF00139) lectin family members of Arabidopsis thaliana and Linum usitatissimum. The A. thaliana gene names are given in black font; additional gene names are given according to descriptions in the Uniprot database (https://www.uniprot.org/; The UniProt Consortium, 2019). The L. usitatissimum gene names are given in dark blue font. The different colored dots next to L. usitatissimum gene names indicate genes with different expression patterns. The criteria used for different expression pattern identification as follow: red, the mean values of tau-score < 0.15 across all samples; light blue, DEGs upregulated in samples with primary CW; yellow, DEGs upregulated in samples with secondary CW; purple dots, DEGs upregulated in samples with tertiary CW. Flax genes with red, light blue, yellow, and purple dots are listed in Tables 2–5, respectively. White dots indicate genes that are not expressed in the analyzed flax samples, and gray dots indicate genes where the expression does not fit the chosen criteria for a certain expression pattern (expression values for these genes are given in Supplementary File 3). Numbers indicate the ultrafast bootstrap support values for some branches. Abbreviations: DEGs, differentially expressed genes, a pairwise comparison log2FC ≥ 1; padj ≥ 0.01, CW, cell wall.
FIGURE 5
FIGURE 5
Phylogenetic dendrogram of galectin–like (PF00337) domain-containing glycosyltransferases from family 31 of Arabidopsis thaliana and Linum usitatissimum. The A. thaliana gene names are given in black font; additional gene names are given according to descriptions in the Uniprot database (https://www.uniprot.org/; The UniProt Consortium, 2019). L. usitatissimum gene names are given in dark blue font. The numbers in parentheses reflect the number of predicted transmembrane domains according to TMHMM v2.0 prediction tool (http://www.cbs.dtu.dk/services/TMHMM/; Krogh et al., 2001). The different colored dots next to L. usitatissimum gene names indicate genes with different expression patterns. The criteria used for different expression pattern identification as follow: red, the mean values of tau-score < 0.15 across all samples; yellow, DEGs upregulated in samples with secondary CW. Flax genes with red and yellow dots are listed in Tables 2, 4, respectively. Gray dots indicate genes where the expression does not fit the chosen criteria (tau-score < 0.15 or DEGs) for a certain expression pattern (expression values for these genes are given in Supplementary File 3). Numbers indicate the ultrafast bootstrap support values for some branches. Abbreviations: DEGs – differentially expressed genes, a pairwise comparison log2FC ≥ 1, padj ≥ 0.01, CW, cell wall.
FIGURE 6
FIGURE 6
Phylogenetic dendrogram of Nictaba (PF14299) family members of Arabidopsis thaliana and Linum usitatissimum. The A. thaliana gene names are given in black font. The L. usitatissimum gene names are given in dark blue font. Originally characterized Nictaba lectin from Nicotiana tabacum (Chen et al., 2002) is given in pink font (protein name is given according to the Uniprot database (https://www.uniprot.org/; The UniProt Consortium, 2019). The different colored dots next to L. usitatissimum gene names indicate genes with different expression patterns. The criteria used for different expression pattern identification as follow: red, the mean values of tau-score < 0.15 across all samples; yellow, DEGs upregulated in samples with secondary CW; purple dots, DEGs upregulated in samples with tertiary CW. Flax genes with red, yellow, and purple dots are listed in Tables 2, 4, 5, respectively. White dots indicate genes that are not expressed in the analyzed flax samples, and gray dots indicate genes where the expression does not fit the chosen criteria (tau-score < 0.15 or DEGs) for a certain expression pattern (expression values for these genes are given in Supplementary File 3). Numbers indicate the ultrafast bootstrap support values for some branches. Abbreviations: DEGs, differentially expressed genes, a pairwise comparison log2FC ≥ 1, padj ≥ 0.01, CW, cell wall.
FIGURE 7
FIGURE 7
Phylogenetic dendrogram of LysM (PF01453) lectin family members of Arabidopsis thaliana and Linum usitatissimum. The A. thaliana gene names are given in black font; additional gene names are given according to Shinya et al. (2012) and Wan et al. (2012). The L. usitatissimum gene names are given in dark blue font. The different colored dots next to L. usitatissimum gene names indicate genes with different expression patterns. The criteria used for different expression pattern identification as follow: red, the mean values of tau-score < 0.15 across all samples; light blue, DEGs upregulated in samples with primary CW; yellow, DEGs upregulated in samples with secondary CW; purple dots, DEGs upregulated in samples with tertiary CW. Flax genes with red, light blue, yellow, and purple dots are listed in Tables 2–5, respectively. White dots indicate genes that are not expressed in the analyzed flax samples, and gray dots indicate genes where the expression does not fit the chosen criteria for a certain expression pattern (expression values for these genes are given in Supplementary File 3). Numbers indicate the ultrafast bootstrap support values for some branches. Abbreviations: DEGs, differentially expressed genes, a pairwise comparison log2FC ≥ 1; padj ≥ 0.01, CW, cell wall.
FIGURE 8
FIGURE 8
Phylogenetic dendrogram (A) of jacalin (PF01419) lectin family members of Arabidopsis thaliana, Linum usitatissimum, and Oryza sativa (Japonica Group) and domain size and distribution (B) in their protein sequences. (A) The A. thaliana gene names are given in black font, L. usitatissimum gene names are given in dark blue font, and O. sativa gene names are given in green font. The different colored dots next to L. usitatissimum gene names indicate genes with different expression patterns. The criteria used for different expression pattern identification as follow: red, the mean values of tau-score < 0.15 across all samples; purple dots, DEGs upregulated in samples with tertiary CW. Flax genes with red and purple dots are listed in Tables 2, 5, respectively. Numbers indicate the ultrafast bootstrap support values for some branches. (B) The domain size and distribution are shown according to results of domain search using the InterProScan tool of the InterPro database (https://www.ebi.ac.uk/interpro/; Mitchell et al., 2019). Numbers indicate the length of amino acid sequences. Abbreviations: DEGs, differentially expressed genes, a pairwise comparison log2FC ≥ 1; padj ≥ 0.01, CW, cell wall.
FIGURE 9
FIGURE 9
Changes in expression of Linum usitatissimum genes for proteins with lectin domains during graviresponse. A heatmap of the top 30 lectin genes with the highest variance across samples from control plants (sXYLb and tFIBb) and from the segment with gravibending stems at various time points. Sample information is shown with colored bars at the top of the heatmap and abbreviations at the bottom. The color of the heatmap corresponds to the amount by which the variation of gene expression deviates from the gene’s mean variance across all samples. tFIBb and sXYLb – isolated fibers with TCW and stem xylem with SCW of non-inclined plant, respectively; tFIBb_PUL8, tFIBb_PUL24, tFIBb_PUL96 – isolated fibers with TCW from pulling side of flax stem after 8, 24, 96 h of gravibending, respectively; tFIBb_OPP8, tFIBb_OPP24, tFIBb_OPP96 – isolated fibers with TCW from opposite side of flax stem after 8, 24, 96 h of gravibending, respectively; sXYLb_PUL8, sXYlb_PUL24, sXYLb_PUL96 – pulling side of stem xylem with SCW after 8, 24, 96 h of gravibending, respectively; sXYLb_OPP8, sXYlb_OPP24, sXYLb_OPP96– opposite side of stem xylem with SCW after 8, 24, 96 h of gravibending. Abbreviations: SCW, secondary cell wall; and TCW, tertiary cell wall.

Similar articles

Cited by

References

    1. Albenne C., Canut H., Hoffmann L., Jamet E. (2014). Plant cell wall proteins: a large body of data, but what about runaways? Proteomes 2 224–242. 10.3390/proteomes2020224 - DOI - PMC - PubMed
    1. Almeras T., Petrova A., Kozlova L., Gril J., Gorshkova T. (2020). Evidence and quantitative evaluation of tensile maturation strain in flax phloem through longitudinal splitting. Botany 98 9–19. 10.1139/cjb-2019-0021 - DOI
    1. Armenteros J. J. A., Tsirigos K. D., Sønderby C. K., Petersen T. N., Winther O., Brunak S., et al. (2019). SignalP 5.0 improves signal peptide predictions using deep neural networks. Nat. Biotechnol. 37 420–423. 10.1038/s41587-019-0036-z - DOI - PubMed
    1. Bannai H., Tamada Y., Maruyama O., Nakai K., Miyano S. (2002). Extensive feature detection of N-terminal protein sorting signals. Bioinformatics 18 298–305. 10.1093/bioinformatics/18.2.298 - DOI - PubMed
    1. Barre A., Bourne Y., Van Damme E. J. M., Rougé P. (2019). Overview of the structure-function relationships of mannose-specific lectins from plants, algae and fungi. Int. J. Mol. Sci. 20:254. 10.3390/ijms20020254 - DOI - PMC - PubMed

LinkOut - more resources