

Homer2 and Homer3 Act as Novel Biomarkers in Diagnosis of hepatitis B virus-induced Hepatocellular Carcinoma
- PMID: 33995622
- PMCID: PMC8120171
- DOI: 10.7150/jca.52118
Homer2 and Homer3 Act as Novel Biomarkers in Diagnosis of hepatitis B virus-induced Hepatocellular Carcinoma
Abstract
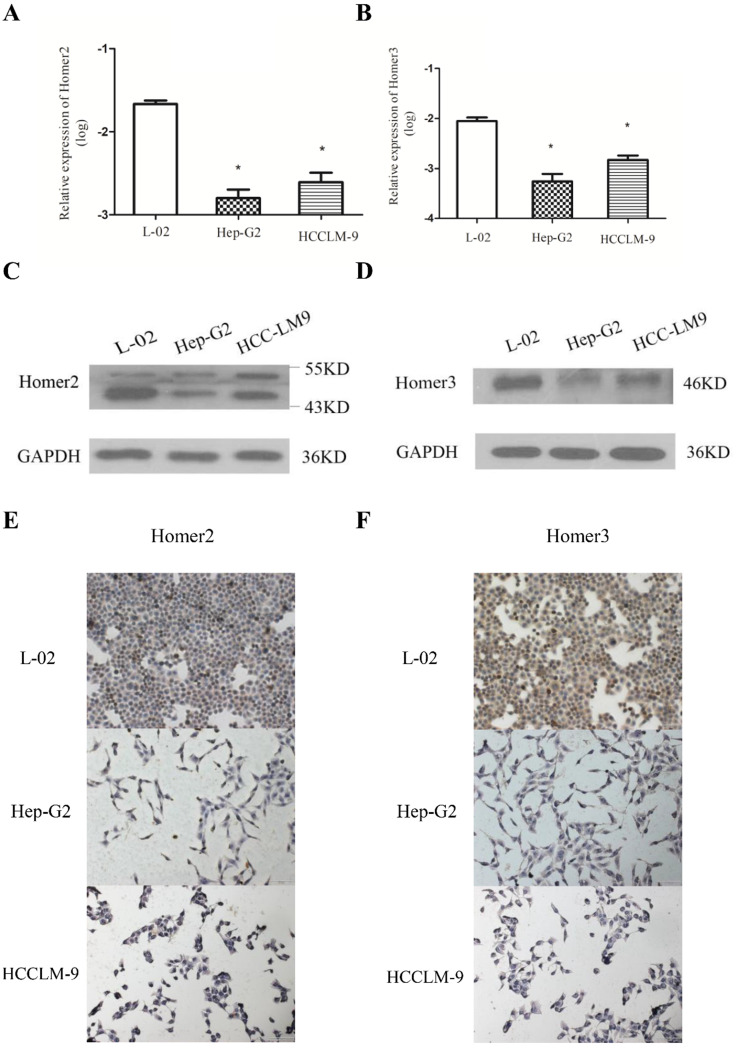
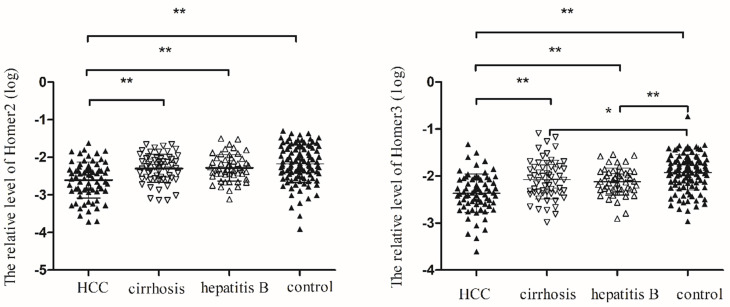
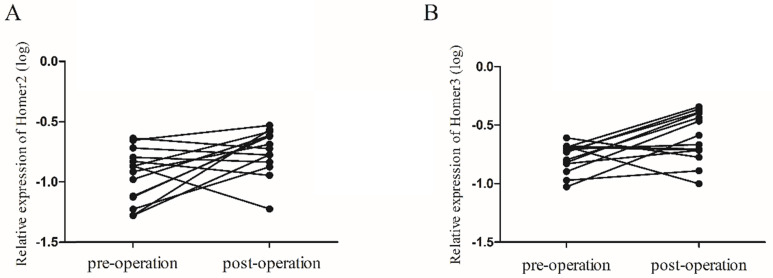
Background: Hepatocellular carcinoma (HCC) is one of the most common causes of cancer-related mortality worldwide. Early detection of HCC can significantly improve patients' outcomes. An increasing number of studies have validated that Homer is dysregulated in cancers and may serve as diagnostic markers. In the present study, we investigated the expression profile and diagnostic significance of Homer2 and Homer3 in hepatitis B virus-induced HCC (HBV-HCC). Methods: Quantitative real-time PCR (QRT-PCR), western blot analysis and immunohistochemistry analysis. Results: Homer2 and Homer3 were downregulated in HCC. The expression of Homer2 was associated with tumor differentiation grade (P= 0.012) and total protein (TP) level (P= 0.032). Homer3 was related to tumor size (P= 0.010), tumor nodes (P= 0.026) and γ-glutamyl transferase (GGT) level (P= 0.001). The receiver operating characteristic curve analyses indicated that the combination of Homer2, Homer3 and AFP possessed a high accuracy (AUC=0.900) to diagnose HCC cases from healthy controls. Conclusion: Our data indicated that Homer2 and Homer3 were downregulated in HCC and might be potential diagnostic marker for HCC.
Keywords: Diagnosis.; HCC; Homer2; Homer3; Tumorigenesis.
© The author(s).
Conflict of interest statement
Competing Interests: The authors have declared that no competing interest exists.
Figures


Similar articles
-
Clinical and Diagnostic Significance of Homer1 in hepatitis B virus-induced Hepatocellular Carcinoma.J Cancer. 2018 Jan 11;9(4):683-689. doi: 10.7150/jca.22279. eCollection 2018. J Cancer. 2018. PMID: 29556326 Free PMC article.
-
Diagnostic Potential of Differentially Expressed Homer1 and Homer2 in Ischemic Stroke.Cell Physiol Biochem. 2016;39(6):2353-2363. doi: 10.1159/000447927. Epub 2016 Nov 11. Cell Physiol Biochem. 2016. PMID: 27832625
-
TEMs but not DKK1 could serve as complementary biomarkers for AFP in diagnosing AFP-negative hepatocellular carcinoma.PLoS One. 2017 Sep 13;12(9):e0183880. doi: 10.1371/journal.pone.0183880. eCollection 2017. PLoS One. 2017. PMID: 28902891 Free PMC article.
-
Urine α-fetoprotein and orosomucoid 1 as biomarkers of hepatitis B virus-associated hepatocellular carcinoma.Am J Physiol Gastrointest Liver Physiol. 2020 Feb 1;318(2):G305-G312. doi: 10.1152/ajpgi.00267.2019. Epub 2019 Nov 18. Am J Physiol Gastrointest Liver Physiol. 2020. PMID: 31736338
-
The role of circulating microRNAs for the diagnosis of hepatitis B virus-associated hepatocellular carcinoma with low alpha-fetoprotein level: a systematic review and meta-analysis.BMC Gastroenterol. 2020 Jul 31;20(1):249. doi: 10.1186/s12876-020-01345-5. BMC Gastroenterol. 2020. PMID: 32736604 Free PMC article.
Cited by
-
Identification of homer protein homolog 3 as a prognostic marker of colon adenocarcinoma.Heliyon. 2024 Jun 22;10(13):e33344. doi: 10.1016/j.heliyon.2024.e33344. eCollection 2024 Jul 15. Heliyon. 2024. PMID: 39035486 Free PMC article.
-
The Integrative Studies on the Functional A-to-I RNA Editing Events in Human Cancers.Genomics Proteomics Bioinformatics. 2023 Jun;21(3):619-631. doi: 10.1016/j.gpb.2022.12.010. Epub 2023 Jan 25. Genomics Proteomics Bioinformatics. 2023. PMID: 36708807 Free PMC article.
References
-
- Wu J, Yang S, Xu K, Ding C, Zhou Y, Fu X. et al. Patterns and Trends of Liver Cancer Incidence Rates in Eastern and Southeastern Asian Countries (1983-2007) and Predictions to 2030. Gastroenterology. 2018;154:1719–28.e5. - PubMed
-
- Villanueva A Hepatocellular Carcinoma. Reply. N Engl J Med. 2019;381:e2. - PubMed
LinkOut - more resources
Full Text Sources
Miscellaneous
