. 2021 May 3;12(12):3726-3740.
doi: 10.7150/jca.48418. eCollection 2021.

MiR-146b-3p regulates proliferation of pancreatic cancer cells with stem cell-like properties by targeting MAP3K10

Affiliations

MiR-146b-3p regulates proliferation of pancreatic cancer cells with stem cell-like properties by targeting MAP3K10

Min Zhou et al. J Cancer. .

Abstract

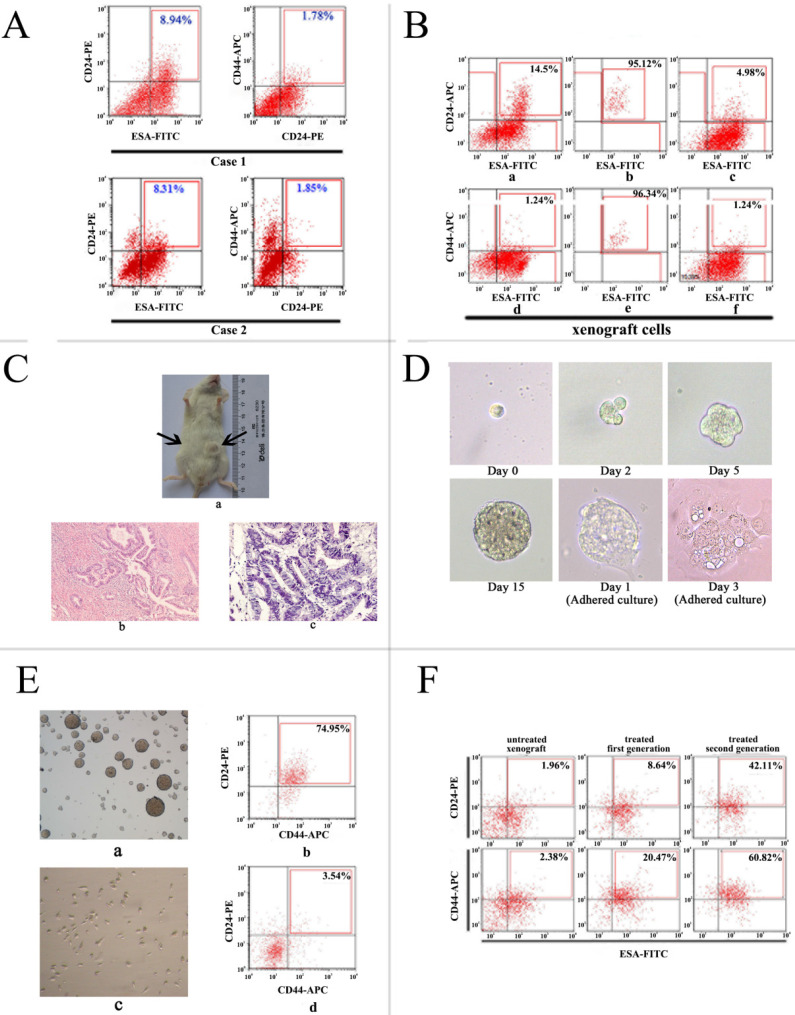
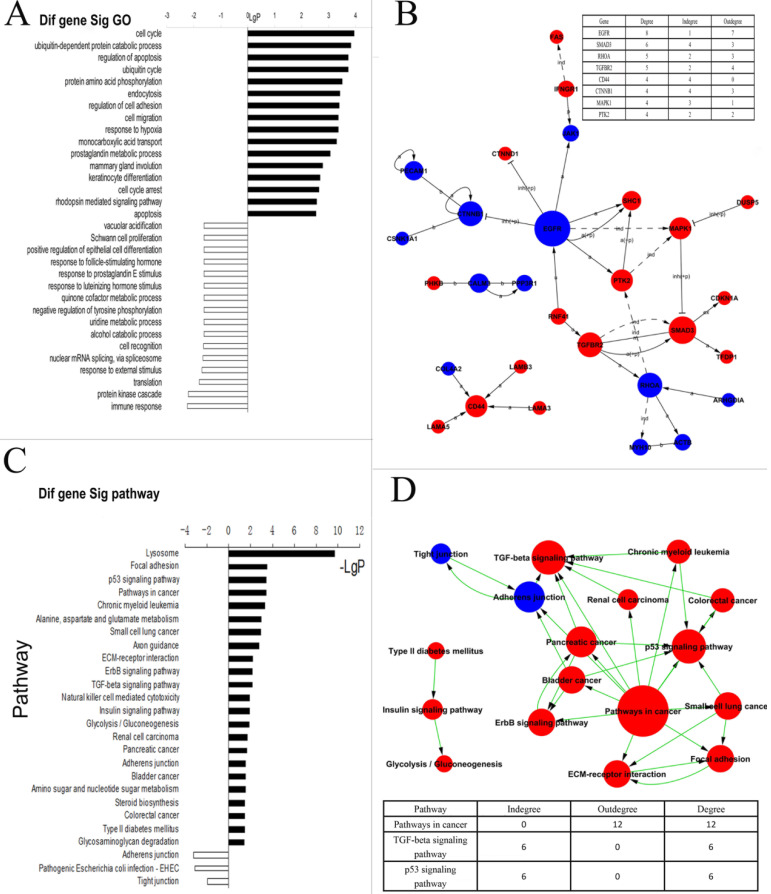
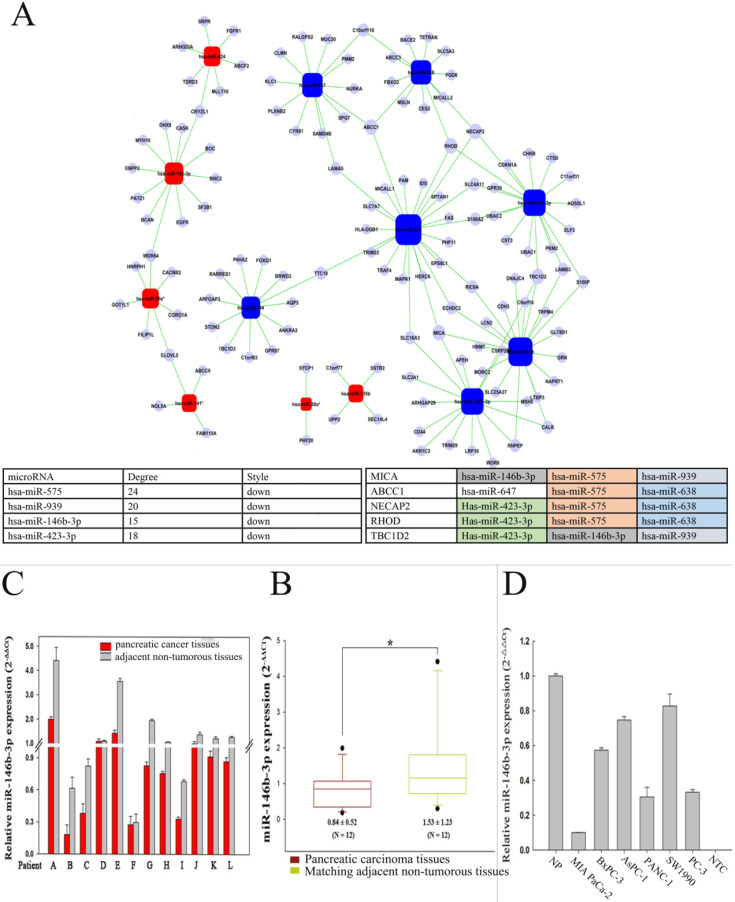
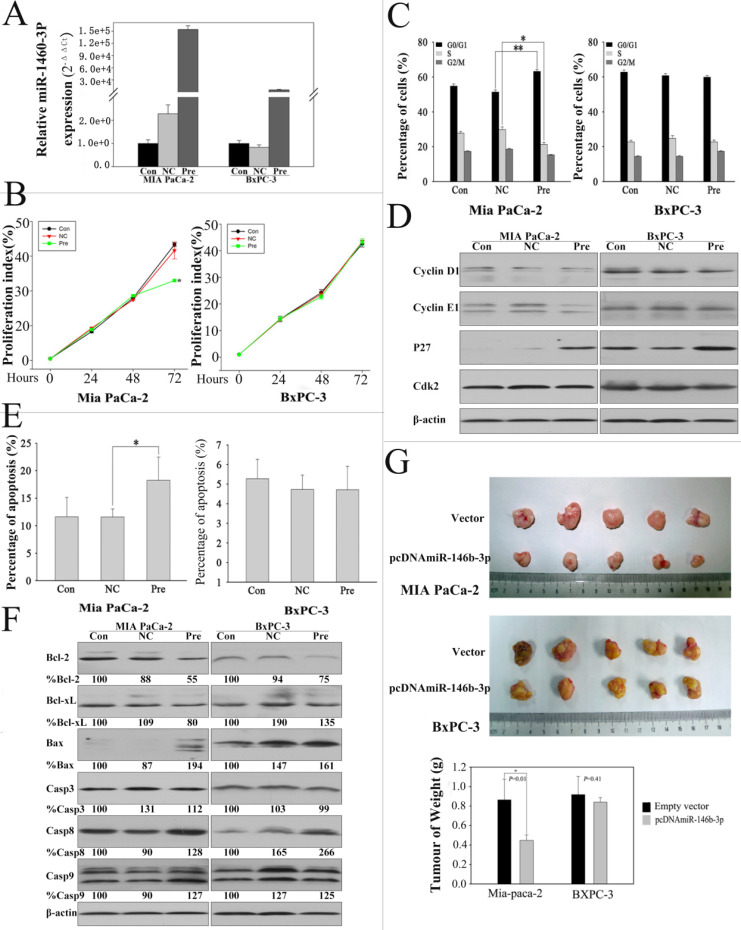
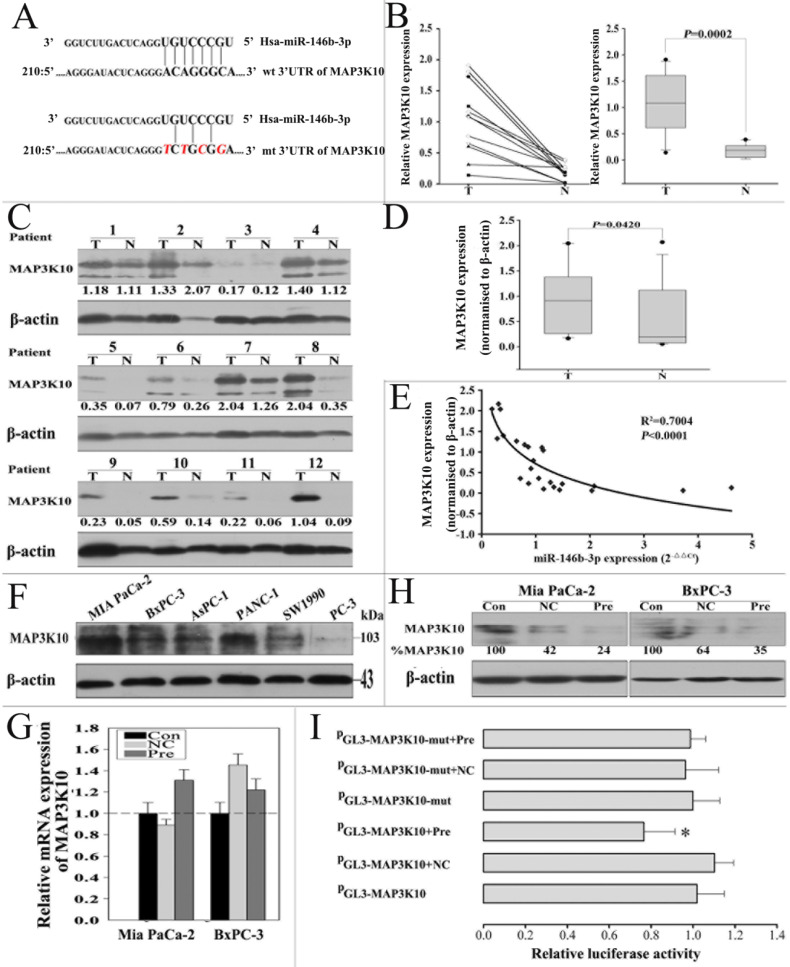
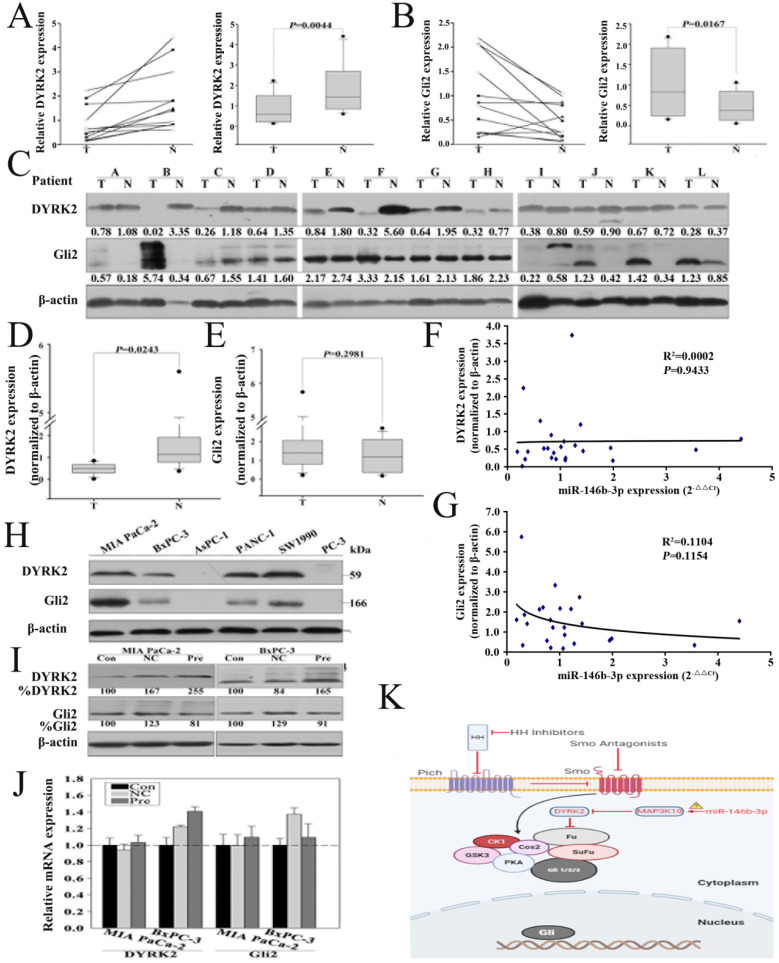
Purpose: Cancer stem cells (CSCs) initiate and maintain tumorigenesis due to their unique pluripotency. However, pancreatic stem cell gene signatures are not completely revealed yet. Here, we isolated pancreatic cancer stem cells (P-CSCs) and exploited their distinct genome-wide mRNA and miRNA expression profiles using microarrays. Methods: CD24+ CD44+ ESA+ cells were isolated from two pancreatic xenograft cells by the flow cytometry and identified the stem cell-like properties by the tumor formation, self-renew and chemoresistance. Microarrays and qRT-PCR were used to exploit their distinct Genome-wide mRNA and miRNA expression profiles. The function and candidate target genes of key microRNA were detected after Ectopic restoration in the pancreatic cancer cell lines MIA Paca-2 (CSChigh) and BxPC-3 (CSClow). Results: In this study, we isolated P-CSCs from two xenografts cells. Genome-wide profiling experiments showed 479 genes and 15 microRNAs specifically expressed in the P-CSCs, including genes involved in TGF-β and p53 signaling pathways and particularly miR-146b-3p as the most significantly downregulated miRNA. We confirmed miR-146b-3p as a downregulated signature in pancreatic cancer tissues and cell line MIA Paca-2 (CSChigh) cells. Ectopic restoration of miR-146b-3p expression with pre-miR reduced cell proliferation, induced apoptosis, increased G1 phase and reduced S phase in cell cycle in MIA Paca-2 (CSChigh), but not in BxPC-3 (CSClow). Re-expression of miR-146b-3p with lentivirus significantly inhibited tumorigenicity in vivo in MIA Paca-2, but slightly in BxPC-3. Furthermore, we demonstrated that miR-146b-3p directly targeted MAP3K10 and might activate Hedgehog pathway as well through DYRK2 and GLI2. Conclusions: These results suggest that P-CSCs have distinct gene expression profiles. MiR-146b-3p inhibits proliferation and induced apoptosis in P-CSCs high cells lines by targeting MAP3K10. Targeting P-CSCs specific genes may provide novel strategies for therapeutic purposes.

Keywords: MAP3K10; gene expression profiling; miR-146b-3p; pancreatic cancer; stem cell.


Conflict of interest statement

Competing Interests: The authors have declared that no competing interest exists.

Figures

Figure 1
Figure 1
Isolation and identification of P-CSCs. A) Expression of CD24, CD44, and ESA in two pancreatic adenocarcinoma xenografts. B) CD24+ CD44+ ESA+ cells isolated xenograft cells show stem-cell-like properties. a and d: staining pattern in xenograft; b and e: purity analysis of isolated cells; C and F: staining pattern of the resultant tumor. C) Tumor formation in NOD/SCID mice. (a) a representative experiment depicting tumor formation in a mouse at the injection site of 1000 CD24+CD44+ESA+ cells, with no tumor formation seen at the injection site of 1000 CD24-CD44-ESAlow/- cells. H&E staining of the tumor generated from CD24+CD44+ESA+ cells (c) has similar histologic features to the corresponding patient's primary extrahepatic cholangiocarcinoma (b). Original magnification: b, c = ×400.D)Generation of a mammosphere from a single CD24+CD44+ESA+ grown in serum-free DMEM-F12 and adherent culture in DMEM supplemented with 10% FCS without growth factors. E) Detection of CD24+CD44+ cells in mammospheres and adherent cell of isolated cells. (a, b) nonadherent mammospheres cells; (c, d) adherent culture in DMEM supplemented with 10% FCS without growth factors. F) Increased percentage of CD24+ CD44+ ESA+ cells in the pancreatic cancer xenograft model after receiving gemcitabine and 5-FU treatment.
Figure 2
Figure 2
Analysis of differentially expressed genes between Positive P-CSC cells and negative cells. A) Biologic process-based gene ontology (GO) categories for differentially expressed genes. Main GO categories for upregulated genes are in black, on top; those for downregulated genes are white, on the bottom. B) KEGG pathway analysis for differentially expressed genes. The significant pathway for upregulated genes is in red; and in blue for downregulated genes. C) Signal network. The KEGG database was used to build a network of genes according to relationships among the genes, proteins and compounds in the database. A (active), inh (inhibit), p (phosphorylate), dp (dephosphorylate), ex (express), b (combined), and ind (indirect). The table on right top showed the key genes and the number of degrees. D) Path network. The KEGG database was used to construct a net of interactions of significant pathways of differentially expressed genes. The table on the down showed the key pathways and the number of degrees. upregulated genes are in red; and in blue for downregulated genes.
Figure 3
Figure 3
Analysis of differentially microRNA between P-CSC cells and negative cells. A) MicroRNA-gene network. Squares represent microRNA nodes; circles represent mRNA nodes. Edges describe inhibitive effects of microRNA on mRNA. Red box nodes show the over-expressed microRNA-mRNA network; blue box nodes show under-expressed microRNA-mRNA network. The table on down showed the key microRNAs and the key target genes detected aberrant by the gene-wild microarrays in P-CSCs. B) Relative miR-146b-3p expression levels in 12 pairs of pancreatic cancer tissues and matched normal pancreatic tissues by real time PCR. C) The data for miR-146b-3p expression was analyzed using the Mann-Whitney U test. D) Quantitative RT-PCR analysis of relative miR-146b-3p expression levels in human pancreatic cancer cell lines compared with normal pancreatic tissues (NP). Data were normalized to U6 control.
Figure 4
Figure 4
Expression of miR-146b-3p after transfection with the miR-146b-3p and over-expression of miR-146b-3p affected cell growth, cell cycle, apoptosis, and tumorigenicity in vivo. A) Expression of miR-146b-3p in miR-146b-3p mimic-transfected, mimic NC-transfected and un-transfected Mia PaCa-2 and BxPC-3 cells. B) Growth of MIA PaCa-2 and PANC-1 cells was shown after transfection with miR-146b-3p mimic or mimic NC or no transfection. The growth index was assessed at 1, 2, and 3 d by the CSFE assay. C) Over-expression of miR-146b-3p resulted in G1 arrest and S-phase increasing in Mia PaCa-2 and not in BxPC-3 cells as measured by PI staining. D) Cell cycle protein (Cyclin D, Cyclin E, P27, and Cdk2) were detected in MIA PaCa-2 and BxPC-3 cells by WB after transfection with miR-146b-3p mimic or mimic NC or no transfection. E) Apoptosis of MIA PaCa-2 and PANC-1 cells were detected by Annexin V/PI after treatment with miR-146b-3p mimic or mimic NC or no transfection in 72 h. F) Cell Apoptosis protein (Bcl-2, Bcl-xl, Bax, Casp3, Casp8, and Casp8) were detected in MIA PaCa-2 and BxPC-3 cells by WB after transfection with miR-146b-3p mimic or mimic NC or no transfection. G) Empty vector-transfected, and pcDNAmiR-146b-3p-transfected MIA PaCa-2 and BXPC-3 cells were propagated into nude mice. For endpoint experiments, tumors were removed and weighed 7 weeks after implantation. Tumor weight was obtained and presented. All data are shown as mean ± SD. *, P < 0.05; **, P < 0.01.
Figure 5
Figure 5
miR-146b-3p negatively regulates MAP3K10 by binding to the MAP3K10 3'-UTR. A) Sequence alignment of miR-146b-3p with the 3'-UTR of MAP3K10. The seed sequence of let-7a (top) matches the 3'-UTR of MAP3K10. Bottom, mutations of the 3'-UTR of MAP3K10 for creating the Renilla reporter constructs (the mutant nucleotides of the miR-146b-3p binding site are red and italic).B), C), and D), The comparison of MAP3K10 expression between matched normal pancreatic tissue and pancreatic cancer tissues in 12 patients. (B) Analysis of the gene expression levels of MAP3K10 by real time PCR and (right) the data were analyzed using the Mann-Whitney U test. (C) Analysis of the protein expression levels of MAP3K10 by western blotting and (D) the data were analyzed using the Mann-Whitney U test. T, pancreatic cancer tumor tissue; N, pair-matched adjacent non-tumor tissue. E) Correlation of the protein expression of MAP3K10 with miR-146b-3p expression in 12 pairs of pancreatic cancer tissues and matched normal pancreatic tissues. Coefficient of determination from logarithmic regression model (R2) and P values are given (R2=0.7004; P<0.0001). F) Analysis of the protein expression levels of MAP3K10 in six pancreatic cancer cell lines by western blotting. G) Analysis of Gene expression of MAP3K10 in Mia PaCa-2 and BxPC-3 cells after transfection with miR-146b-3p mimic or mimic NC or no transfection by real time PCR.H) Analysis of protein expression of MAP3K10 in Mia PaCa-2 and BxPC-3 cells after transfection with miR-146b-3p mimic or mimic NC or no transfection by western blot. I) Analysis of luciferase activity. miR-146b-3p mimic inhibited wild type but not mutant MAP3K10 3'-UTR reporter activity. *P <0.05, compared to the mimic NC group. P values were obtained by two-tailed Student's t test.
Figure 6
Figure 6
Re-expression of miR-146b-3p regulates the expression of DYRK2 and GIL2. A) and B), Analysis of the gene expression levels of DYRK2 (A) and GIL2 (B) by real time PCR in 12 matched normal pancreatic tissue and pancreatic cancer tissues and (right) the data were analyzed using the Mann-Whitney U test. T, pancreatic cancer tumor tissue; N, pair-matched adjacent non-tumor tissue. C) Analysis of the protein expression levels of DYRK2 and GIL2 by western blotting in 12 matched normal pancreatic tissue and pancreatic cancer tissues and (D and E) the data were analyzed using the Mann-Whitney U test. T, pancreatic cancer tumor tissue; N, pair-matched adjacent non-tumor tissue. F and G) Correlation of the protein expression of DYRK2 and GIL2 with miR-146b-3p expression in 12 pairs of pancreatic cancer tissues and matched normal pancreatic tissues. Coefficient of determination from logarithmic regression model (R2) and P values are given. H) Analysis of the protein expression levels of DYRK2 and GIL2 in six pancreatic cancer cell lines by western blotting. I) Analysis of Gene expression of DYRK2 and GIL2 in Mia PaCa-2 and BxPC-3 cells after transfection with miR-146b-3p mimic or mimic NC or no transfection by real time PCR. J) Analysis of protein expression of DYRK2 and GIL2 in Mia PaCa-2 and BxPC-3 cells after transfection with miR-146b-3p mimic or mimic NC or no transfection by western blot. K) Working model for miR-146b-3p-MAP3K10-Gli2 axis.

References

    1. Siegel R, Ma J, Zou Z, Jemal A. Cancer statistics, 2014. CA: a cancer journal for clinicians. 2014;64:9–29. - PubMed
    1. Li C, Heidt DG, Dalerba P, Burant CF, Zhang L, Adsay V. et al. Identification of pancreatic cancer stem cells. Cancer research. 2007;67:1030–7. - PubMed
    1. Yu F, Yao H, Zhu P, Zhang X, Pan Q, Gong C. et al. let-7 regulates self-renewal and tumorigenicity of breast cancer cells. Cell. 2007;131:1109–23. - PubMed
    1. Hermann PC, Huber SL, Herrler T, Aicher A, Ellwart JW, Guba M. et al. Distinct populations of cancer stem cells determine tumor growth and metastatic activity in human pancreatic cancer. Cell stem cell. 2007;1:313–23. - PubMed
    1. Hatfield SD, Shcherbata HR, Fischer KA, Nakahara K, Carthew RW, Ruohola-Baker H. Stem cell division is regulated by the microRNA pathway. Nature. 2005;435:974–8. - PubMed