. 2021 Apr 15;11(13):6138-6153.
doi: 10.7150/thno.54999. eCollection 2021.

Progressive stretch enhances growth and maturation of 3D stem-cell-derived myocardium

Affiliations

Progressive stretch enhances growth and maturation of 3D stem-cell-derived myocardium

Kun Lu et al. Theranostics. .

Abstract

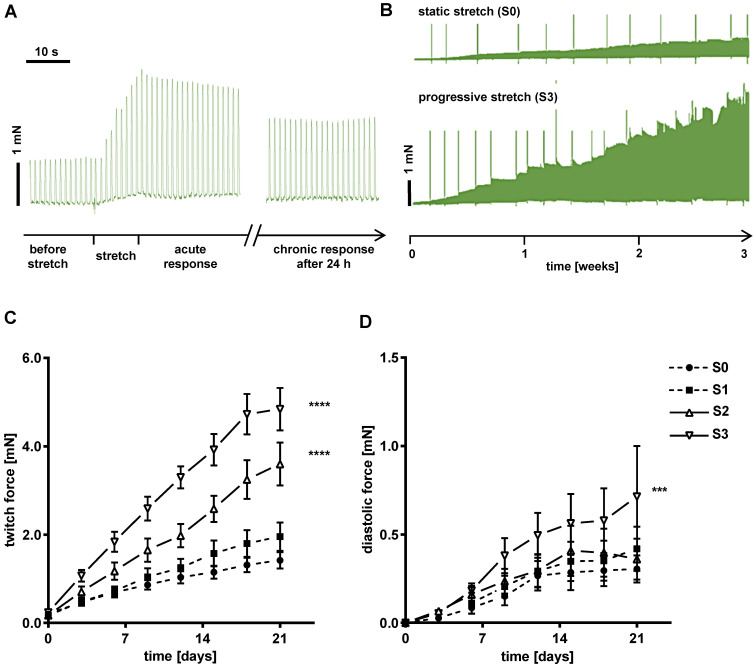
Bio-engineered myocardium has great potential to substitute damaged myocardium and for studies of myocardial physiology and disease, but structural and functional immaturity still implies limitations. Current protocols of engineered heart tissue (EHT) generation fall short of simulating the conditions of postnatal myocardial growth, which are characterized by tissue expansion and increased mechanical load. To investigate whether these two parameters can improve EHT maturation, we developed a new approach for the generation of cardiac tissues based on biomimetic stimulation under application of continuously increasing stretch. Methods: EHTs were generated by assembling cardiomyocytes derived from human induced pluripotent stem cells (hiPSC-CM) at high cell density in a low collagen hydrogel. Maturation and growth of the EHTs were induced in a custom-made biomimetic tissue culture system that provided continuous electrical stimulation and medium agitation along with progressive stretch at four different increments. Tissues were characterized after a three week conditioning period. Results: The highest rate of stretch (S3 = 0.32 mm/day) increased force development by 5.1-fold compared to tissue with a fixed length, reaching contractility of 11.28 mN/mm². Importantly, intensely stretched EHTs developed physiological length-dependencies of active and passive forces (systolic/diastolic ratio = 9.47 ± 0.84), and a positive force-frequency relationship (1.25-fold contractility at 180 min-1). Functional markers of stretch-dependent maturation included enhanced and more rapid Ca2+ transients, higher amplitude and upstroke velocity of action potentials, and pronounced adrenergic responses. Stretch conditioned hiPSC-CMs displayed structural improvements in cellular volume, linear alignment, and sarcomere length (2.19 ± 0.1 µm), and an overall upregulation of genes that are specifically expressed in adult cardiomyocytes. Conclusions: With the intention to simulate postnatal heart development, we have established techniques of tissue assembly and biomimetic culture that avoid tissue shrinkage and yield muscle fibers with contractility and compliance approaching the properties of adult myocardium. This study demonstrates that cultivation under progressive stretch is a feasible way to induce growth and maturation of stem cell-derived myocardium. The novel tissue-engineering approach fulfills important requirements of disease modelling and therapeutic tissue replacement.

Keywords: biomechanics; engineered heart tissue; maturation; progressive stretch; stem-cell-derived myocardium.


Conflict of interest statement

Competing Interests: AD and TS are shareholders of InVitroSys GmbH. Other authors declare no conflict of interest.

Figures

Figure 1
Figure 1
Experimental design and EHT formation. (A) Workflow of the experimental design. (B) Schematic representation of EHT formation and detailed presentation of a discoid primary EHT. Scale bar: 0.5 mm. (C) Detailed view of EHT fixation in the biomimetic culture chambers (BMCCs). Scale bar left: 10 mm; scale bar right: 0.5 mm.
Figure 2
Figure 2
A novel bioreactor enables stretch conditioning under enhanced biomimetic conditions. (A) Schematic illustration of mechanical fixation of the primary EHT in a biomimetic culture chamber (BMCC). Red arrows indicate the stretching direction. (B) Setup of the BMCC system. A micro-controller (left dashed box) collects contraction data, generates stimulation pulses, and controls rocking of the BMCC platform by a stepper motor (right dashed box). (C) Computer interface of BMCC system. Data storage and stimulation parameters are set on a control panel (left). Tissue forces are displayed at arbitrary time scales in freely assignable oscilloscope windows (middle and right panels). Each peak represents one contraction.
Figure 3
Figure 3
EHTs gain in contractility and preload during stretch conditioning. (A) Representative real-time recording of a single stretch manipulation, each peak represents one contraction. (B) Representative twitch force recording of static (S0) and progressive stretch (S3) conditions over a period of three weeks. Periodic breakdowns of contraction force correspond to medium exchange intervals (36-48 h). (C) Twitch force development in groups exposed to different intensities of stretch. (D) Diastolic force development in groups exposed to different intensities of stretch. (C) and (D): static (S0), low (S1), moderate (S2) and high stretch (S3); n = 10 EHTs per group. Two Way ANOVA, Tukey's multiple comparison test vs. static stretch, ***p < 0.001, ****p < 0.0001.
Figure 4
Figure 4
Stretch conditioning improves adrenergic responsiveness and O2 consumption. (A) Effects of beta-adrenergic stimulation. From left to right: responses to isoprenaline (1 µmol/L) of twitch force, relative relaxation rate, and contraction duration normalized to pre-treatment values (S0-S3, n = 5). One Way ANOVA, Tukey's multiple comparison test, *p < 0.05, **p < 0.01. (B) Contractility response to hypoxia condition. Left: Representative recording of twitch force during hypoxia simulated by 2 min cessation of medium agitation in EHTs conditioned at S0 or S3 stretch. Right: Relative decrease of twitch force induced by 2 min simulated hypoxia in EHTs conditioned under various rates of stretch (S0-S3, n = 5). One Way ANOVA, Kruskal-Wallis test vs. static stretch, *p < 0.05. **p < 0.01. (C) Immunofluorescent images of EHTs cultured under S0 or S3 conditions. Left pictures: Longitudinal sections stained for alpha-actinin (red), subunit of the cytochrome c oxidase in mitochondria - MTCO2 (green) and DNA (blue). Right pictures: MTCO2 component of left pictures. Scale bar: 25 µm.
Figure 5
Figure 5
Stretched EHTs approach myocardial biomechanical properties. Representative length (A) and force (B) traces demonstrate the response of a contracting EHT to increasing distension under isometric conditions, and represent an intact Frank-Starling relationship. (C) Response of systolic and diastolic forces to distension in stretch-conditioned EHTs (n = 7). (D) Maximum twitch force, ratio of systolic and diastolic force, and elastic modulus after 3 weeks of biomimetic culture with static (S0), low (S1), moderate (S2), or high (S3) stretch (n = 7). (E) Representative force-frequency-relationship of EHTs exposed to static (S0) or high stretch (S3). (F) Force-frequency-relationship in stretch-conditioned EHTs (n = 6-7). (B) and (C): s. l. (slack length). (C, D and F) n = 7 EHTs per group. Two Way ANOVA, Tukey's multiple comparison test vs. static stretch, **p < 0.01, ***p < 0.001, ****p < 0.0001.
Figure 6
Figure 6
Parameters of excitation/contraction coupling are improved in stretch-conditioned EHTs. (A) Snapshots from image analysis of Fluo-4 fluorescence with ROI (region of interest). (B) Quantification of calcium transient duration, amplitude, and exponential decay (τ) in EHTs conditioned with static (S0, n = 8), low (S1, n = 6), intermediate (S2, n = 7), or high (S3, n = 8) stretch. (C) Representative action potentials of EHTs exposed to static or high stretch. (D) Quantification of resting membrane potential, upstroke velocity, action potential (a.p.) duration at 90% repolarization and amplitude (S0-3, n = 6 tissues). (B) One Way ANOVA, Dunnett's multiple comparison test, *p < 0.05, **p < 0.01, (D) One Way ANOVA, Tukey's multiple comparison test, *p < 0.05, **p < 0.01.
Figure 7
Figure 7
Myofibril alignment and maturation contribute to stretch-induced gain of contractility. (A) Immunofluorescent images of EHTs exposed for three weeks to static (S0), low (S1), moderate (S2), or high (S3) stretch. Longitudinal section stained for alpha-actinin (red), connexin43 (green) and DNA (blue). Scale bar: 10 µm (B) Second harmonic generation imaging of stretch-conditioned EHTs detailing alignment and density of myofibrils and sarcomeres. Scale bar: 10 µm (C) EHT slack length after three weeks of culture (n = 8). (D) α-actinin positive cross section after three weeks of culture (n = 6 for S0 and S3, n = 4 for S1 and S2). (E) Sarcomere length after three weeks of culture (mean values of n = 6 tissues). (F) Specific twitch force of differently stretched EHTs after 3 weeks of biomimetic culture (n = 10). (G) Maturation of myosin isoform expression: Quantitative PCR analysis of MYH6 mRNA and MYH7/MYH6 ratio. (C-G): One-way ANOVA, Tukey's multiple comparison test. *p < 0.05, **p < 0.01, ***p < 0.001, ****p < 0.0001.
Figure 8
Figure 8
Progressive stretch promotes growth and linear orientation of hiPSC-CMs. (A) High magnification cross sections of EHTs conditioned with S0 or S3 stretch, scale bar left: 10 µm, scale bar right: 5 µm. WGA-negative areas correspond to cell-free areas (predominant in S0), or to cytosol cross sections (predominant in S3). (B) High magnification longitudinal section of S3-conditioned EHT, scale bar: 10 µm (C) Morphological parameters of cardiomyocytes and cardiomyocyte alignment in EHTs after low stretch (S0, S1) or high stretch (S2, S3) conditioning (mean values of n = 4 tissues). (D) Representative histogram of forward scatter (FSC) shifting and myocyte volume analysis in terms of mean FSC. Cyan peak indicates FSC of S0 (static stretch, cTnT positive); red peak indicates FSC of S3 (high stretch, cTnT positive). Cell suspensions were stained with cardiac muscle troponin T (cTnT). (E) Schematic diagram of cell volume growth estimation derived from different analyses. (A and B) stained for alpha-actinin (red), WGA (green) and DNA (blue) after three weeks of culture, (C) Mann-Whitney test. (D) n = 6 for S0 and S3. unpaired t-test. *p < 0.05, **p < 0.01, ***p < 0.001, ****p < 0.0001.

References

    1. Zhao Y, Rafatian N, Feric NT, Cox BJ, Aschar-Sobbi R, Wang EY. et al. A platform for generation of chamber-specific cardiac tissues and disease modeling. Cell. 2019;176:913–27. - PMC - PubMed
    1. Ronaldson-Bouchard K, Ma SP, Yeager K, Chen T, Song L, Sirabella D. et al. Advanced maturation of human cardiac tissue grown from pluripotent stem cells. Nature. 2018;556:239–43. - PMC - PubMed
    1. Le MNT, Hasegawa K. Expansion culture of human pluripotent stem cells and production of cardiomyocytes. Bioengineering (Basel) 2019;6:48. - PMC - PubMed
    1. Breckwoldt K, Letuffe-Brenière D, Mannhardt I, Schulze T, Ulmer B, Werner T. et al. Differentiation of cardiomyocytes and generation of human engineered heart tissue. Nat Protoc. 2017;12:1177–97. - PubMed
    1. Ruan JL, Tulloch NL, Razumova MV, Saiget M. Mechanical stress conditioning and electrical stimulation promote contractility and force maturation of induced pluripotent stem cell-derived human cardiac tissue. Circulation. 2016;134:1557–67. - PMC - PubMed

Publication types

MeSH terms