. 2021 Apr 15;11(13):6173-6192.
doi: 10.7150/thno.58254. eCollection 2021.

A 9-kDa matricellular SPARC fragment released by cathepsin D exhibits pro-tumor activity in the triple-negative breast cancer microenvironment

Affiliations

A 9-kDa matricellular SPARC fragment released by cathepsin D exhibits pro-tumor activity in the triple-negative breast cancer microenvironment

Lindsay B Alcaraz et al. Theranostics. .

Abstract

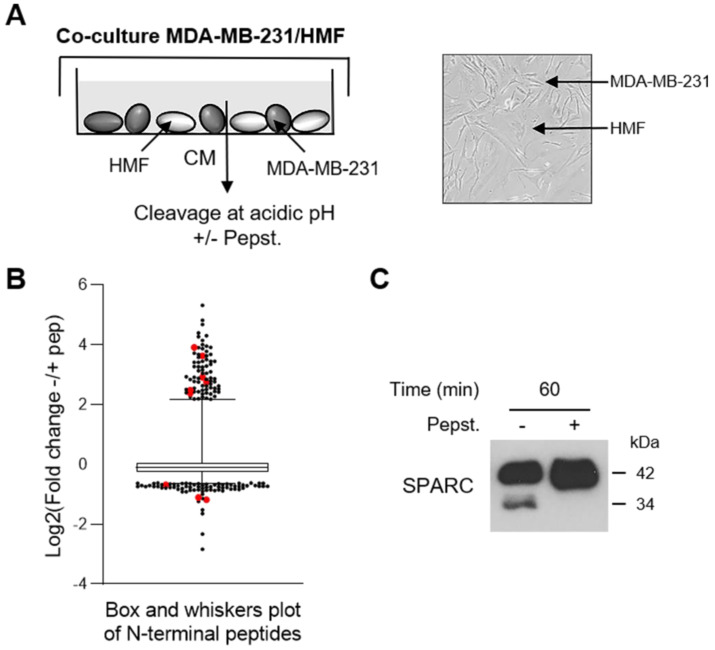
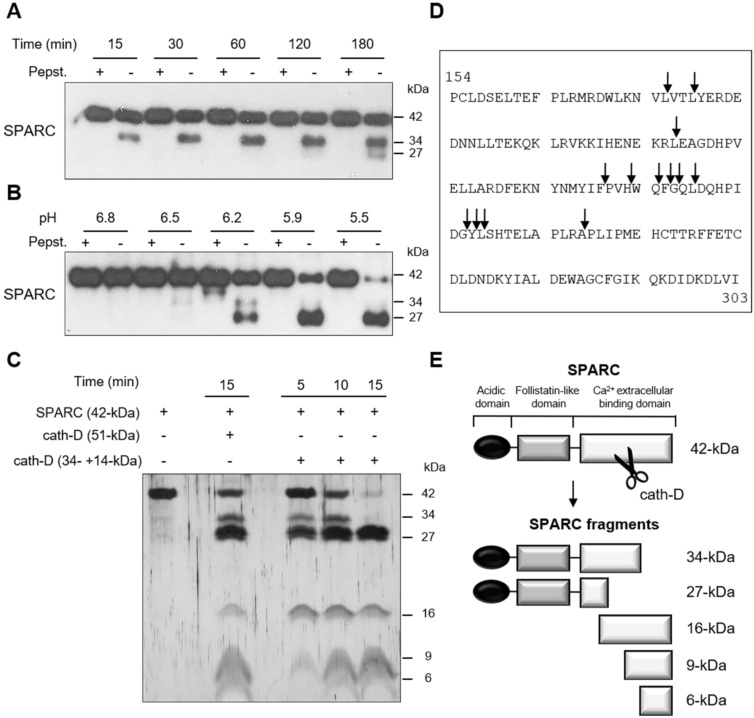
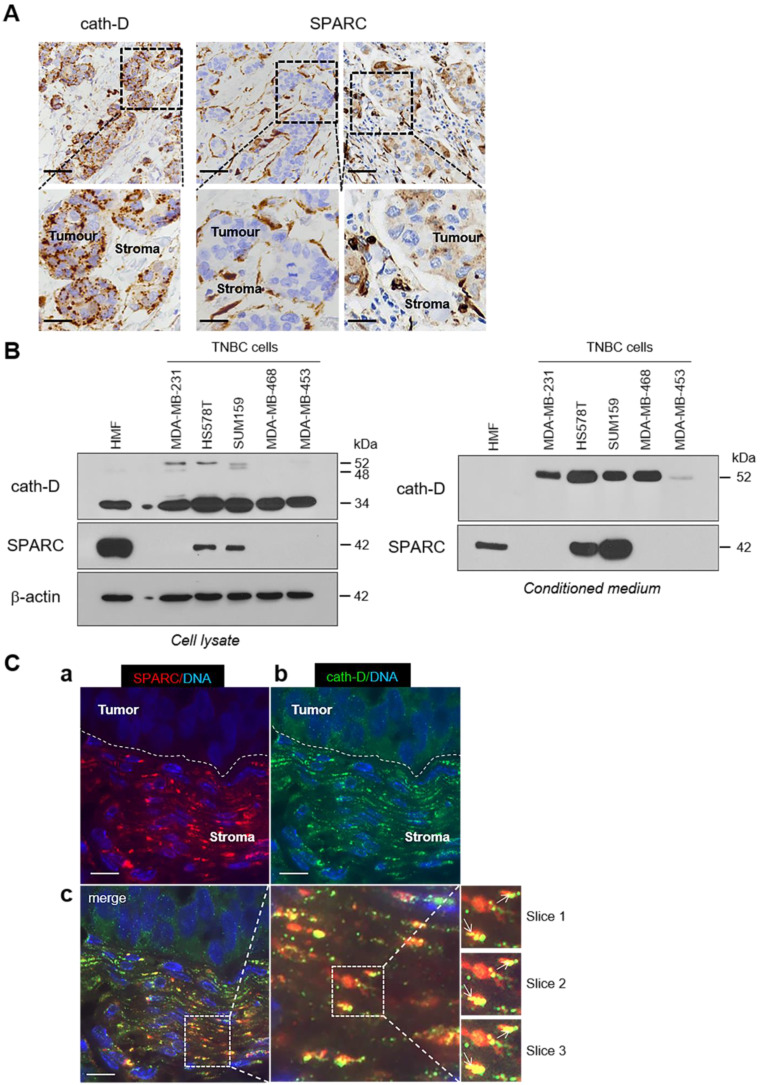
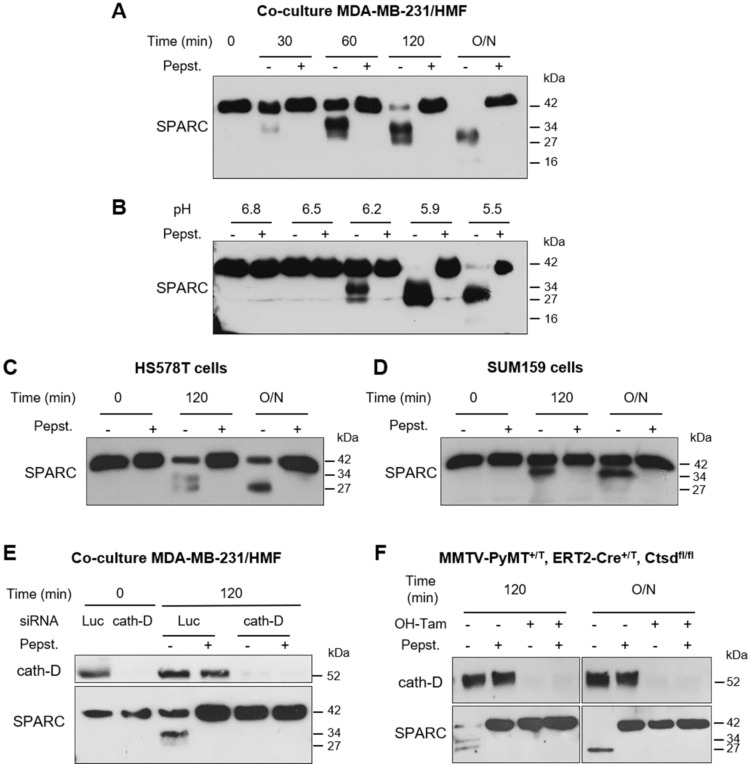
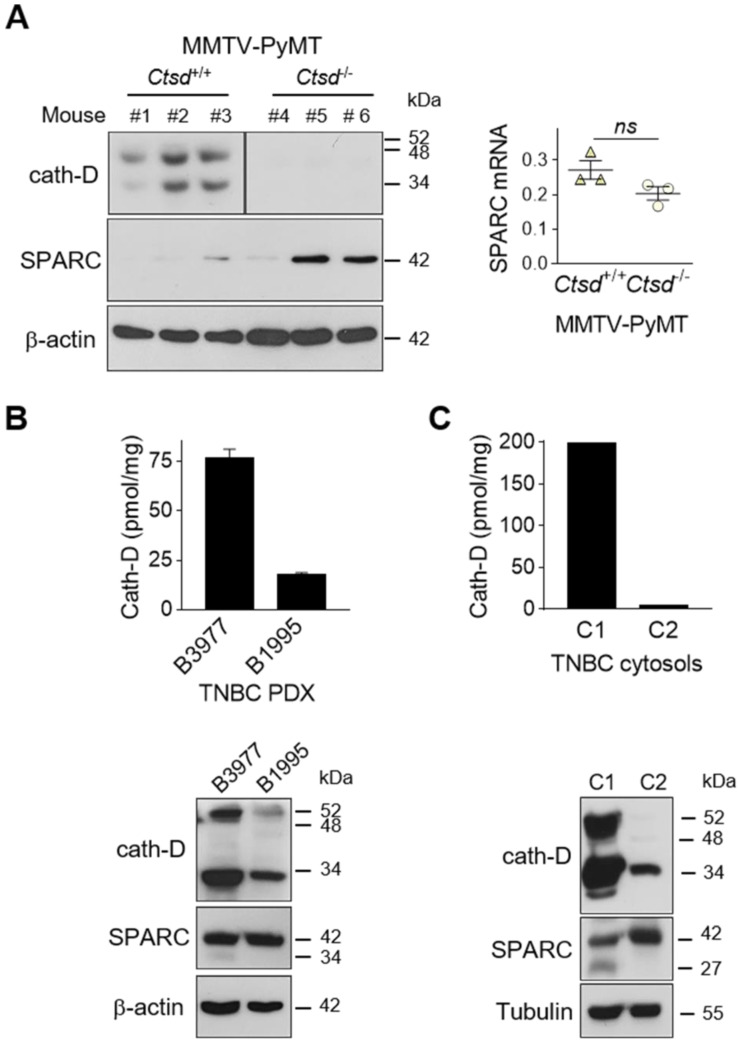
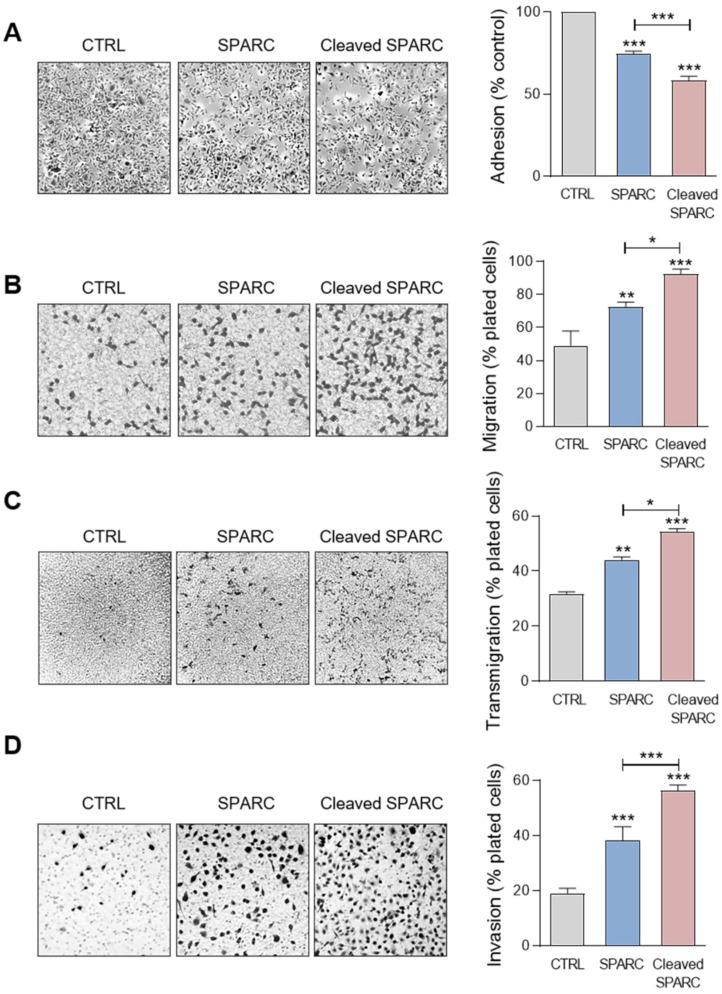
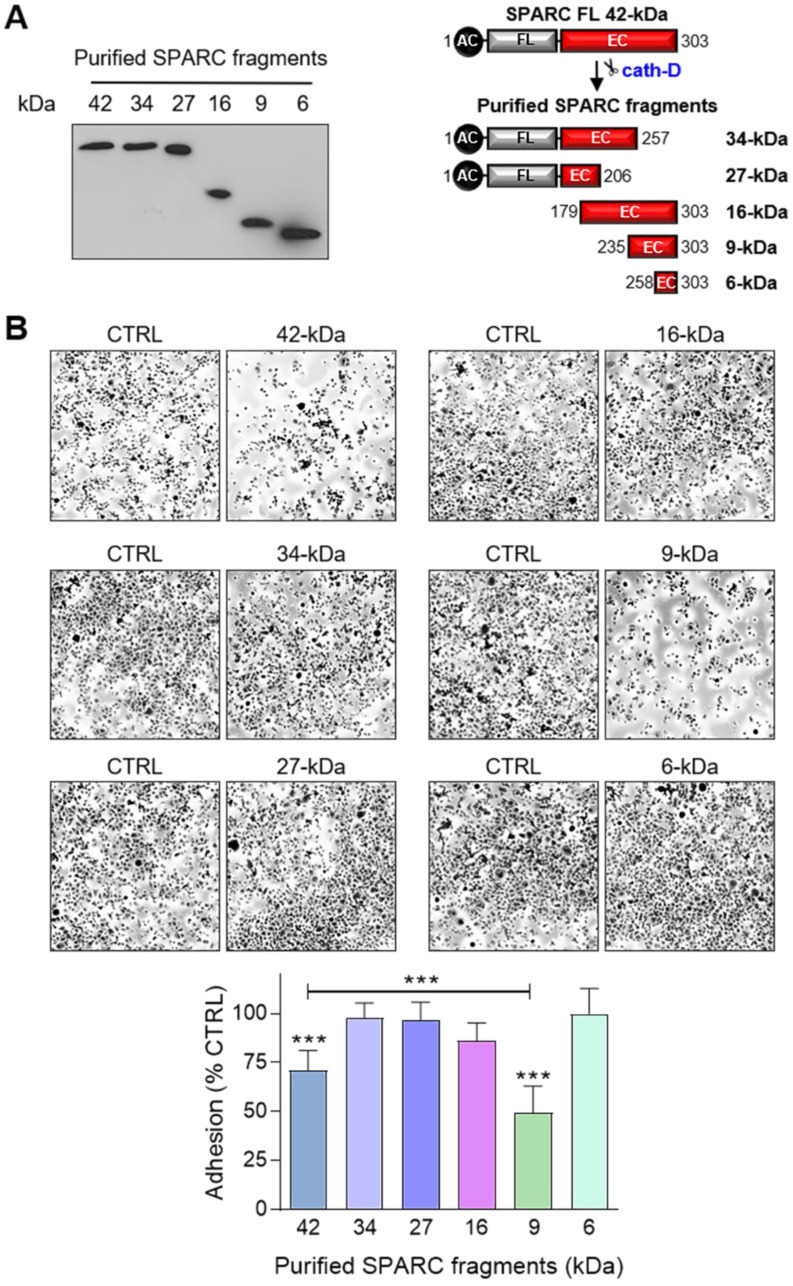
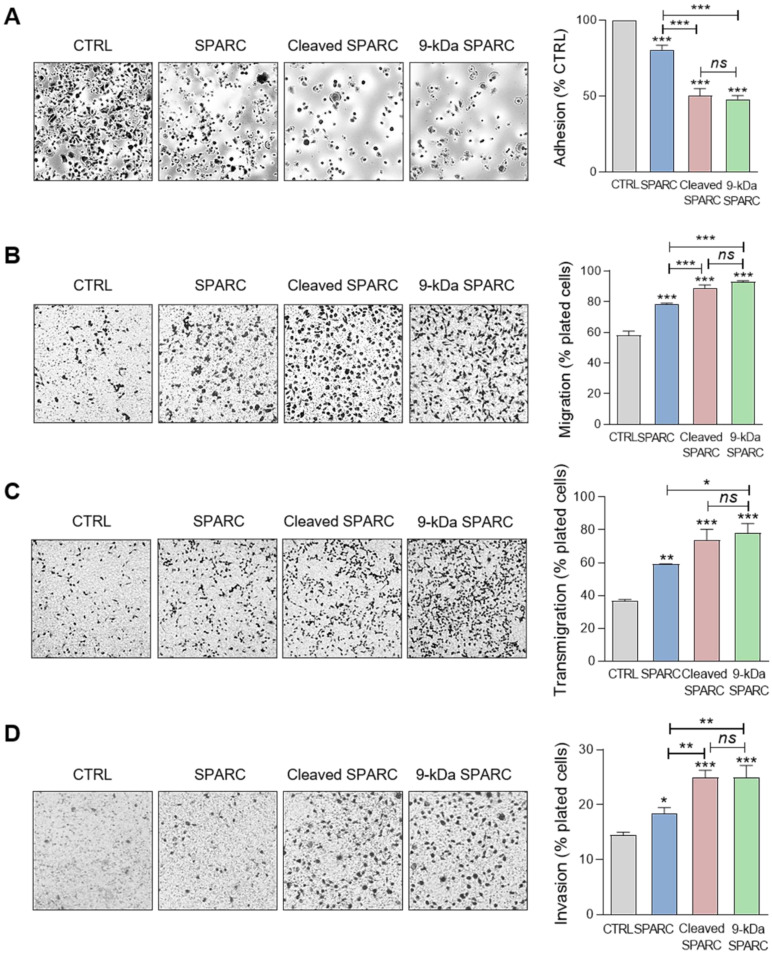
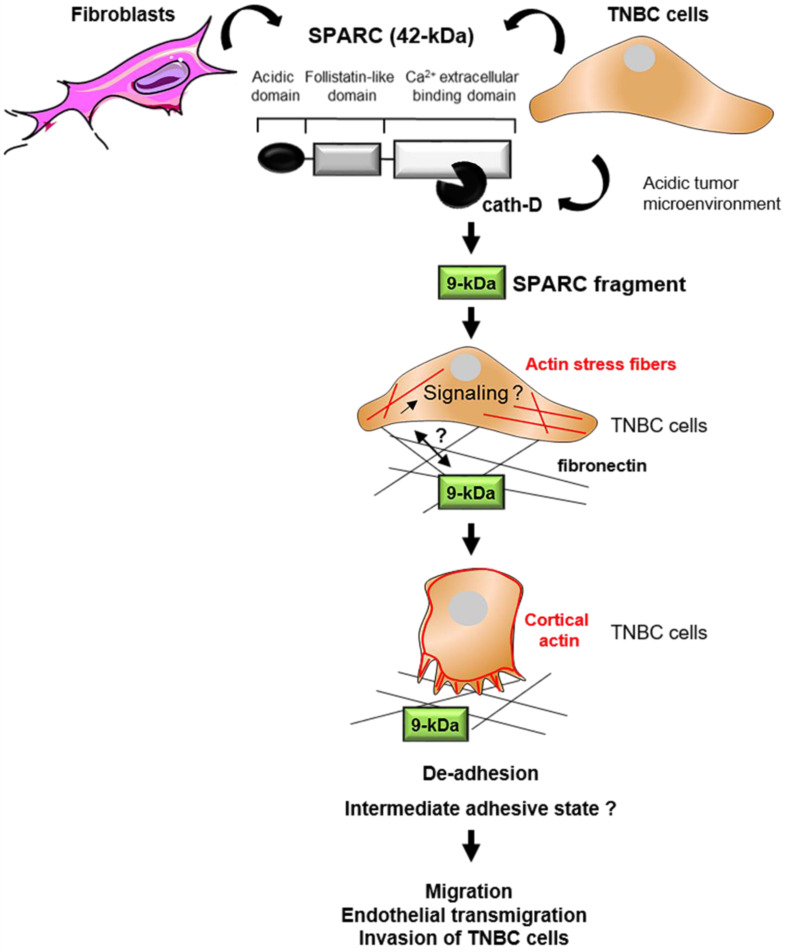
Rationale: Alternative therapeutic strategies based on tumor-specific molecular targets are urgently needed for triple-negative breast cancer (TNBC). The protease cathepsin D (cath-D) is a marker of poor prognosis in TNBC and a tumor-specific extracellular target for antibody-based therapy. The identification of cath-D substrates is crucial for the mechanistic understanding of its role in the TNBC microenvironment and future therapeutic developments. Methods: The cath-D substrate repertoire was investigated by N-Terminal Amine Isotopic Labeling of Substrates (TAILS)-based degradome analysis in a co-culture assay of TNBC cells and breast fibroblasts. Substrates were validated by amino-terminal oriented mass spectrometry of substrates (ATOMS). Cath-D and SPARC expression in TNBC was examined using an online transcriptomic survival analysis, tissue micro-arrays, TNBC cell lines, patient-derived xenografts (PDX), human TNBC samples, and mammary tumors from MMTV-PyMT Ctsd-/- knock-out mice. The biological role of SPARC and its fragments in TNBC were studied using immunohistochemistry and immunofluorescence analysis, gene expression knockdown, co-culture assays, western blot analysis, RT-quantitative PCR, adhesion assays, Transwell motility, trans-endothelial migration and invasion assays. Results: TAILS analysis showed that the matricellular protein SPARC is a substrate of extracellular cath-D. In vitro, cath-D induced limited proteolysis of SPARC C-terminal extracellular Ca2+ binding domain at acidic pH, leading to the production of SPARC fragments (34-, 27-, 16-, 9-, and 6-kDa). Similarly, cath-D secreted by TNBC cells cleaved fibroblast- and cancer cell-derived SPARC at the tumor pericellular acidic pH. SPARC cleavage also occurred in TNBC tumors. Among these fragments, only the 9-kDa SPARC fragment inhibited TNBC cell adhesion and spreading on fibronectin, and stimulated their migration, endothelial transmigration, and invasion. Conclusions: Our study establishes a novel crosstalk between proteases and matricellular proteins in the tumor microenvironment through limited SPARC proteolysis, revealing a novel targetable 9-kDa bioactive SPARC fragment for new TNBC treatments. Our study will pave the way for the development of strategies for targeting bioactive fragments from matricellular proteins in TNBC.

Keywords: ECM; TNBC; bioactive fragment; matricellular protein; protease; tumor microenvironment.


Conflict of interest statement

Competing Interests: The authors have declared that no competing interest exists.

Figures

Figure 1
Figure 1
Identification of SPARC as an extracellular protein cleaved in the TNBC microenvironment at acidic pH. (A) Experimental set-up of the MDA-MB-231 cell-HMF co-culture system. MDA-MB-231 TNBC cells and HMFs were co-cultured in serum-free DMEM without sodium bicarbonate and phenol red and buffered with 50 mM HEPES [pH 7.5] at 37 °C for 24 h. The 24 h-conditioned medium was then concentrated to 0.2 mg/mL, and incubated in cleavage buffer with or without pepstatin A (Pepst.) (12.5 µM) at pH 5.5 and 37 °C for 60 min. A representative image of an MDA-MB-231/HMF co-culture is shown in the right panel (x 200). (B) Box and whisker plot of the normalized ratios of the N-terminal peptides identified by TAILS in the MDA-MB-231/HMF co-culture secretome. 3091 peptides quantified at t = 60 min of incubation with cleavage buffer were used to generate the graph. The without/with pepstatin A ratios corresponding to SPARC peptides are highlighted in red; whiskers correspond to the 2.5th and 97.5th percentiles. (C) Validation of SPARC cleavage in the MDA-MB-231/HMF co-culture secretome. Secretome samples (2 µg) from the MDA-MB-231/HMF co-culture incubated in cleavage buffer with or without pepstatin A (Pepst.) (12.5 µM) at pH 5.5 and at 37 °C for 60 min were separated on 13.5% SDS-PAGE followed by immunoblotting with anti-SPARC antibody (clone AON-5031).
Figure 2
Figure 2
Cleavage of the extracellular Ca2+ binding domain of human SPARC by human cath-D at acidic pH. (A) Time-course of cath-D-induced SPARC cleavage. Recombinant human FL SPARC was incubated with recombinant human auto-activated pseudo-cath-D (51-kDa) in cleavage buffer at pH 5.9 with or without pepstatin A (Pepst.) at 37 °C for the indicated times. SPARC cleavage was analyzed by 13.5% SDS-PAGE and immunoblotting with an anti-SPARC antibody (clone AON-5031). (B) pH dependence of cath-D-induced SPARC cleavage. Recombinant human FL SPARC was incubated with recombinant human auto-activated pseudo-cath-D (51-kDa) in cleavage buffer with or without pepstatin A (Pepst.) at the indicated pH at 37 °C overnight. SPARC cleavage was analyzed as in (A). (C) Detection of the cath-D-induced SPARC fragments by silver staining. Recombinant SPARC was incubated with recombinant auto-activated pseudo-cath-D (51-kDa) or fully-mature cath-D (34 + 14-kDa) at pH 5.9 for the indicated times. SPARC cleavage was analyzed by 17% SDS-PAGE and silver staining. (D) Cath-D cleavage sites in SPARC extracellular Ca2+ binding domain. The entire C-terminal extracellular Ca2+ binding domain of human SPARC (amino acids 154-303) is shown. SPARC cleaved peptides generated in the extracellular Ca2+ binding domain by auto-activated pseudo-cath-D (51-kDa) and fully-mature (34 + 14-kDa) cath-D at pH 5.9 were resolved by iTRAQ-ATOMS. Arrows, cleavage sites. (E) Schematic representation of the SPARC fragments generated by cath-D according to (C) and (D).
Figure 3
Figure 3
Expression and co-localization of SPARC and cath-D in TNBC. (A) SPARC and cath-D in a TNBC TMA. Representative images of SPARC and cath-D expression analyzed in a TNBC TMA (n = 147 samples) using anti-SPARC (clone AON-5031) and anti-cath-D (clone C-5) monoclonal antibodies. Scale bars, 50 µm (top panels) and 20 µm (bottom panels; higher magnifications of the boxed regions). Left panels: cath-D expression was scored as high and low in cancer and stromal cells, respectively. Medium panels: SPARC expression was scored as low and high in cancer cells and stromal cells, respectively. Right panels: SPARC was scored high and high in cancer and stromal cells, respectively. (B) SPARC and cath-D expression and secretion in TNBC cell lines and breast fibroblasts. Whole cell extracts (10 µg proteins) (left panel) and 24 h conditioned media in the absence of FCS (40 µl) (right panel) were separated by 13.5% SDS-PAGE and analyzed by immunoblotting with anti-cath-D antibodies for cellular (clone 49, #610801) and secreted cath-D (H-75) detection, respectively, and anti-SPARC (clone AON-5031) antibody. β-actin, loading control. (C) Co-localization of SPARC and cath-D in TNBC PDX. PDX 1995 tumor sections were co-incubated with an anti SPARC polyclonal antibody (15274-1-AP) (red; panel a) and an anti-cath-D monoclonal antibody (C-5) (green; panel b). Nuclei were stained with 0.5 µg/mL Hoechst 33342 (blue). Panel c (left): SPARC, cath-D and Hoechst 33342 merge. Panel c (middle and right): higher magnification of the boxed areas (right panels: Z projections of 3 x 0.25 µm slices). Arrows indicate SPARC and cath-D co-localization. Scale bar, 10 µm.
Figure 4
Figure 4
Limited proteolysis of fibroblast- and cancer cell-derived SPARC at acidic pH by cath-D secreted by TNBC and mouse breast cancer cells. (A) Time-course of SPARC degradation in MDA-MB-231 / HMF conditioned medium. MDA-MB-231 TNBC cells and HMFs were co-cultured in serum-free DMEM without sodium bicarbonate and phenol red and buffered with 50 mM HEPES [pH 7.5] at 37 °C for 24 h. The 24 h conditioned medium from co-cultured MDA-MB-231 / HMF was incubated at 37 °C in cleavage buffer with or without pepstatin A (Pepst.) at pH 5.5 for the indicated times. SPARC cleavage in conditioned medium was analyzed by 13.5% SDS-PAGE and immunoblotting with an anti-SPARC antibody (15274-1-AP). O/N, overnight. (B) Influence of the milieu acidity on SPARC degradation in MDA-MB-231 / HMF conditioned medium. MDA-MB-231 TNBC cells and HMFs were co-cultured as in (A). The 24 h conditioned medium was incubated at 37 °C in cleavage buffer with or without pepstatin A at the indicated pH overnight. SPARC cleavage was analyzed as described in (A). (C and D) Time-course of SPARC cleavage in TNBC cell conditioned medium. HS578T TNBC cells (C) and SUM159 TNBC cells (D) were cultured in serum-free DMEM without sodium bicarbonate and phenol red and buffered with 50 mM HEPES [pH 7.5] at 37 °C for 24 h. The 24 h conditioned medium was incubated at 37 °C in cleavage buffer with or without pepstatin A at pH 5.5 for the indicated times. SPARC cleavage was analyzed as described in (A). (E) SPARC cleavage by cath-D secreted by MDA-MB-231 cells. MDA-MB-231 cells were transfected with Luc or cath-D siRNAs. At 48 h post-transfection, siRNA-transfected MDA-MB-231 cells were co-cultured with HMFs as described in (A). Then, the 24 h conditioned media from co-cultured siRNA-transfected MDA-MB-231 / HMF were incubated at 37 °C in cleavage buffer with or without pepstatin A at pH 5.5 for 120 min. Cath-D secretion by siRNA-transfected MDA-MB-231 cells was analyzed with an anti-cath-D antibody (H-75). SPARC cleavage was analyzed as described in (A). (F) SPARC cleavage by cath-D secreted by inducible Ctsd knock-out MMTV-PyMT mammary tumor cells. Inducible Ctsd knock-out MMTV-PyMT breast cancer cells were incubated or not with 4-hydroxytamoxifen (OH-Tam; 3 µM) for 4 days to induce Ctsd knock-out. Then, cells were cultured in FCS-free DMEM without sodium bicarbonate and phenol red and buffered with 50 mM HEPES [pH 7.5] at 37 °C for 24 h. The 24 h-conditioned medium was incubated at 37 °C in cleavage buffer with or without pepstatin A at pH 5.5 for 120 min or O/N. Cath-D secretion was analyzed with an anti-cath-D antibody (AF1029). SPARC cleavage was analyzed as described in (A).
Figure 5
Figure 5
Detection of FL SPARC and its cleaved fragments in mammary tumors. (A) SPARC expression in mammary tumors from MMTV-PyMT Ctsd knock-out mice. Left panel, whole cytosols (40 µg) of mammary tumors from MMTV-PyMTCtsd+/+ (N° 1-3) and MMTV-PyMTCtsd-/- (Ctsd knock-down in mammary glands) (N° 4-6) mice were analyzed by 13.5% SDS-PAGE and immunoblotting with anti-mouse cath-D (clone 49, #610801) and anti-SPARC (AON-5031) antibodies. β-actin, loading control. Right panel, total RNA was extracted from mammary tumors from MMTV-PyMTCtsd+/+ (N° 1-3) and MMTV-PyMTCtsd-/- (N° 4-6) mice, and Sparc expression was analyzed by RT-qPCR. P = 0.1 (Student's t-test). (B and C) SPARC expression in TNBC PDXs and TNBC biopsies. Top panels, cath-D expression was determined in whole cytosols from two TNBC PDXs (B) and two TNBC biopsies (C) by sandwich ELISA with the immobilized anti-human cath-D D7E3 antibody and the anti-human cath-D M1G8 antibody coupled to HRP. Bottom panels, whole cytosols (40 µg) from these PDXs (B) and TNBC biopsies (C) were analyzed by 13.5% SDS-PAGE and immunoblotting with anti-cath-D (H-75) and anti-SPARC (15274-1-AP) antibodies. β-actin (B) and tubulin (C), loading controls.
Figure 6
Figure 6
Effects of FL SPARC and cath-D-induced cleaved SPARC fragments on adhesion, migration, transmigration and invasion of TNBC cells. (A) Cell adhesion. MDA-MB-231 cells were let to adhere for 30 min on a fibronectin matrix in the absence or presence of recombinant FL SPARC (SPARC), or recombinant cath-D-induced cleaved SPARC fragments (cleaved SPARC) at the final concentration of 240 nM. Left panels, representative images of adherent cells. Right panel, adherent cells were stained with crystal violet, and adhesion was quantified at 570 nm. CTRL, PBS in cleavage buffer. Data are the mean ± SD (n = 3); ***, p < 0.001, ANOVA and Bonferroni's post hoc test. Similar results were obtained in four independent experiments. (B) Cell migration. MDA-MB-231 cells were let to migrate for 16 h on a fibronectin matrix in the absence or presence of recombinant FL SPARC, or cleaved SPARC at a final concentration of 240 nM. Left panels, representative images of migrating cells. Right panel, migrating cells were quantified by MTT staining and absorbance was read at 570 nm. CTRL, PBS in cleavage buffer. Data are the mean ± SD (n = 3); *, p < 0.05; **, p < 0.01; ***, p < 0.001, ANOVA and Bonferroni's post hoc test. Similar results were obtained in three independent experiments. (C) Endothelial transmigration. MDA-MB-231 cells were let to transmigrate for 16 h through a HUVEC monolayer in the absence or presence of recombinant FL SPARC, or cleaved SPARC at a final concentration of 240 nM. Left panels, representative images of transmigrating cells. Right panel, transmigrating cells were stained with MTT and quantified at 570 nm. CTRL, PBS in cleavage buffer. Data are the mean ± SD (n = 3); *, p < 0.05, **, p < 0.01, ***, p < 0.001, ANOVA and Bonferroni's post hoc test. Similar results were obtained in two independent experiments. (D) Cell invasion. MDA-MB-231 cells were let to invade for 16 h on a Matrigel matrix in the absence or presence of recombinant FL SPARC, or cleaved SPARC at a final concentration of 240 nM. Left panels, representative images of invading cells. Right panel, invading cells were stained with MTT and quantified at 570 nm. CTRL, PBS in cleavage buffer. Data are the mean ± SD (n = 3); ***, p < 0.001, ANOVA and Bonferroni's post hoc test. Similar results were obtained in three independent experiments.
Figure 7
Figure 7
Effect of FL SPARC and cath-D-induced cleaved SPARC fragments on TNBC cell adhesion. (A) Production of Myc/His-tagged FL SPARC, and Myc/His-tagged 34-, 27-, 16-, 9-, and 6-kDa SPARC fragments. Left panel, equimolar concentrations (240 nM each) of purified Myc/His-tagged FL SPARC and SPARC fragments were analyzed by SDS-PAGE (17%) and immunoblotting with an anti-Myc antibody (clone 9B11). Right panel, schematic representation of the purified Myc/His-tagged SPARC fragments. AC, acidic domain; FL, follistatin-like domain; EC, Ca2+-extracellular binding domain. (B) Cell adhesion. MDA-MB-231 cells were let to adhere for 30 min on a fibronectin matrix in the presence of purified Myc/His-tagged FL SPARC, or individual Myc/His-tagged SPARC fragments (34-, 27-, 16-, 9-, and 6-kDa) at an equimolar final concentration (240 nM each). Upper panels, representative images of adherent cells stained with crystal violet after incubation with the indicated SPARC variants. Lower panel, cell adhesion was quantified as described in Figure 6A and expressed as percentage relative to the value in control (SPARC-immunodepleted control for each SPARC fragment). Data are the mean ± SD of three independent experiments; ***, p < 0.001, ANOVA and Bonferroni's post hoc test.
Figure 8
Figure 8
Effects of the 9-kDa C-terminal SPARC fragment on TNBC cell adhesion, migration, transmigration and invasion. (A) Cell adhesion. MDA-MB-231 cells were let to adhere for 30 min on a fibronectin matrix in the presence of recombinant FL SPARC, recombinant cleaved SPARC fragments (cleaved SPARC), or purified 9-kDa C-terminal SPARC fragment at a final concentration of 240 nM. Left panels, representative images of adherent cells stained with crystal violet. Right panel, adhesion was quantified as described in Figure 6 A. Data are the mean ± SD (n = 3); ns, not significant; ***, p < 0.001, ANOVA and Bonferroni's post hoc test. CTRL, PBS in cleavage buffer and SPARC-immunodepleted supernatant from the 9-kDa SPARC fragment purification. Similar results were obtained in three independent experiments. (B) Cell migration. MDA-MB-231 cells were let to migrate for 16 h on a fibronectin matrix in the absence or presence of FL SPARC, cleaved SPARC fragments, or the 9-kDa C-terminal SPARC fragment at a final concentration of 240 nM. Left panels, representative images of migrating cells stained with crystal violet. Right panel, migration was quantified as described in Figure 6B. Data are the mean ± SD (n = 3); ***, p < 0.001, ANOVA and Bonferroni's post hoc test. CTRL, PBS in cleavage buffer and SPARC immunodepleted supernatant from the 9-kDa SPARC fragment purification. Similar results were obtained in two independent experiments. (C) Endothelial transmigration. MDA-MB-231 cells were let to transmigrate for 16 h through a HUVEC monolayer in the absence or presence of FL SPARC, cleaved SPARC fragments, or the 9-kDa C-terminal SPARC fragment at a final concentration of 240 nM. Left panels, representative images of transmigrating cells. Right panel, transmigrating cells were stained with MTT and quantified by absorbance at 570 nm. Data are the mean ± SD (n = 3); *, p < 0.05, **, p < 0.01, ***, p < 0.001, ANOVA and Bonferroni's post hoc test. CTRL, PBS in cleavage buffer and SPARC-immunodepleted supernatant from the 9-kDa SPARC fragment purification. Similar results were obtained in two independent experiments. (D) Cell invasion. MDA-MB-231 cells were let to invade for 16 h on a Matrigel matrix in the absence or presence of FL SPARC, cleaved SPARC fragments, or the 9-kDa C-terminal SPARC fragment at a final concentration of 240 nM. Left panels, representative images of invading cells stained with crystal violet. Right panel, invading cells were quantified by absorbance at 570 nm. Data are the mean ± SD (n = 3); *, p < 0.05, **, p < 0.01, ***, p < 0.001, ANOVA and Bonferroni's post hoc test. CTRL, PBS in cleavage buffer and SPARC immunodepleted supernatant from the 9-kDa SPARC fragment purification. Similar results were obtained in two independent experiments.
Figure 9
Figure 9
Model of the pro-tumor effect on TNBC cells of the 9-kDa C-terminal SPARC released by cath-D cleavage. TNBC-secreted cath-D triggers limited proteolysis of SPARC at the acidic pH of the tumor microenvironment. Among the SPARC fragments cleaved by cath-D, the 9-kDa C-terminal SPARC fragment inhibits TNBC cell adhesion and spreading. This might lead to an intermediate adhesive state, and stimulate TNBC cell migration, endothelial transmigration and invasion.

References

    1. Bianchini G, Balko JM, Mayer IA, Sanders ME, Gianni L. Triple-negative breast cancer: challenges and opportunities of a heterogeneous disease. Nature reviews Clinical oncology. 2016;13:674–90. - PMC - PubMed
    1. Swartz MA, Iida N, Roberts EW, Sangaletti S, Wong MH, Yull FE. et al. Tumor microenvironment complexity: emerging roles in cancer therapy. Cancer Res. 2012;72:2473–80. - PMC - PubMed
    1. Ricard-Blum S, Vallet SD. Fragments generated upon extracellular matrix remodeling: Biological regulators and potential drugs. Matrix Biol. 2019;75-76:170–89. - PubMed
    1. Gerarduzzi C, Hartmann U, Leask A, Drobetsky E. The Matrix Revolution: Matricellular Proteins and Restructuring of the Cancer Microenvironment. Cancer Res. 2020;80:2705–17. - PubMed
    1. Turk B, Turk D, Turk V. Protease signalling: the cutting edge. EMBO J. 2012;31:1630–43. - PMC - PubMed

Publication types

MeSH terms