

Emission reduction of black carbon and polycyclic aromatic hydrocarbons during COVID-19 pandemic lockdown
- PMID: 33995690
- PMCID: PMC8109221
- DOI: 10.1007/s11869-021-01004-y
Emission reduction of black carbon and polycyclic aromatic hydrocarbons during COVID-19 pandemic lockdown
Abstract
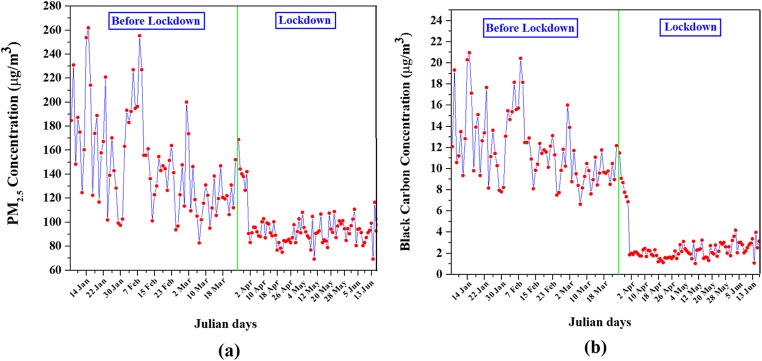
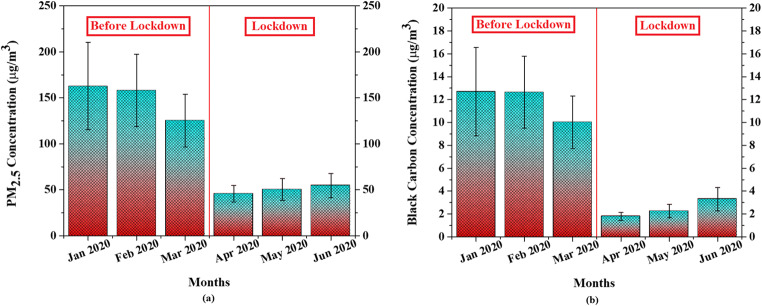
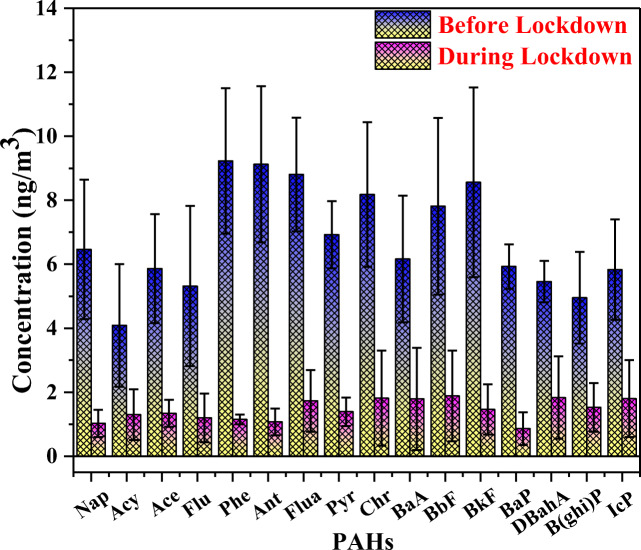
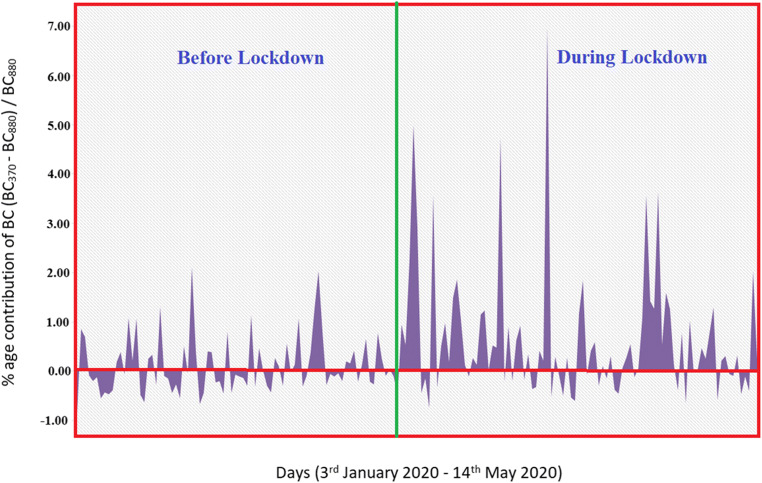
The global pandemic COVID-19 necessitated various responses throughout the world, including social distancing, use of mask, and complete lockdown. While these measures helped prevent the community spread of the virus, the resulting environmental benefits of lockdown remained mostly unnoticed. While many studies documented improvements in air quality index, very few have explored the reduction in black carbon (BC) aerosols and polycyclic aromatic hydrocarbons (PAHs) concentrations due to lockdown. In this study, we evaluated the changes in concentrations of BC, PAHs, and PM2.5 before and during the lockdown period. Our results show that lockdown resulted in a significant reduction in concentrations of these pollutants. The average mass concentration of BC, PAHs, and PM2.5 before the lockdown was 11.71 ± 3.33 μgm-3, 108.71 ± 27.77 ngm-3, and 147.65 ± 41.77 μgm-3, respectively. During the lockdown period, the concentration of BC, PAHs, and PM2.5 was 2.46 ± 0.95 μgm-3, 23.19 ± 11.21 ngm-3, and 50.31 ± 11.95 μgm-3, respectively. The diagnostic ratio analysis for source apportionment showed changes in the emission sources before and during the lockdown. The primary sources of PAHs emissions before the lockdown were biomass, coal combustion, and vehicular traffic, while during the lockdown, PAHs emissions were primarily from the combustion of biomass and coal. Similarly, before the lockdown, the BC mass concentrations came from fossil-fuel and wood-burning, while during the lockdown period, most of the BC mass concentration came from wood-burning. Human health risk assessment demonstrated a significant reduction in risk due to inhalation of PAHs and BC-contaminated air.
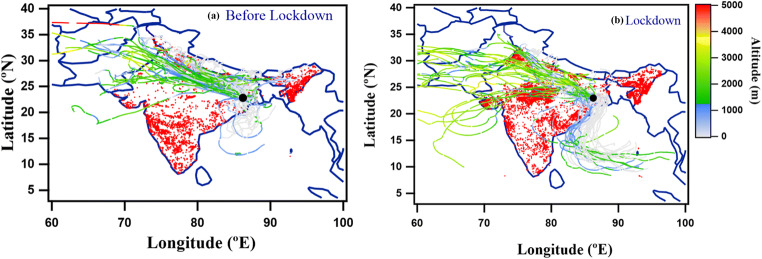
Keywords: Aethalometer; Backward trajectory; Black carbon; COVID-19; Emission sources; Health risk assessment; PAHs.
© The Author(s), under exclusive licence to Springer Nature B.V. 2021.
Conflict of interest statement
Conflict of interest/Competing interestsThe authors declare no competing interests.
Figures
References
-
- Allen GA, Lawrence J, Koutrakis P. Field validation of a semi continuous method for aerosol black carbon (aethalometer) and temporal patterns of summertime hourly black carbon measurements in southwestern PA. Atmos Environ. 1999;33:817–823.
-
- Arey J, Atkinson R. Photochemical reactions of PAH in the atmosphere. In: Douben PET, editor. PAHs: an eco toxicological perspective. New York: John Wiley and Sons Ltd; 2003. pp. 47–63.
-
- Baek SO, Field RA, Goldstone ME, Kirk PW, Lester JN, Perry R. A review of atmospheric polycyclic aromatic hydrocarbons: sources, fate and behavior. Water Air Soil Pollut. 1991;60:79–300.
LinkOut - more resources
Full Text Sources
Other Literature Sources