. 2021 Apr 20:2021:5554932.
doi: 10.1155/2021/5554932. eCollection 2021.

Exploring the Role and Mechanism of pAMPK α-Mediated Dysregulation of Brf1 and RNA Pol III Genes

Affiliations

Exploring the Role and Mechanism of pAMPK α-Mediated Dysregulation of Brf1 and RNA Pol III Genes

Teng Wu et al. Oxid Med Cell Longev. .

Abstract

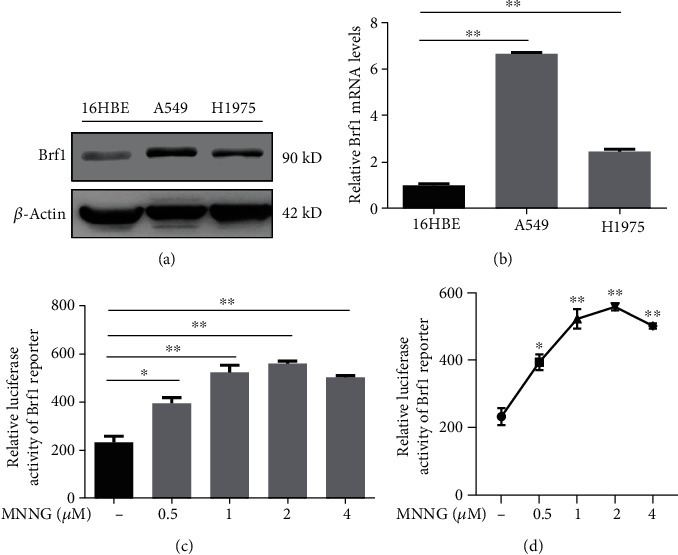
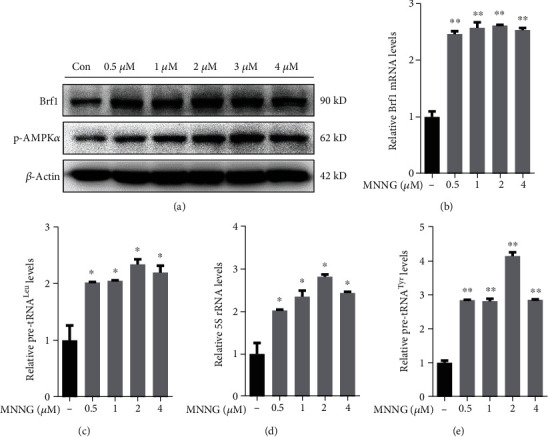
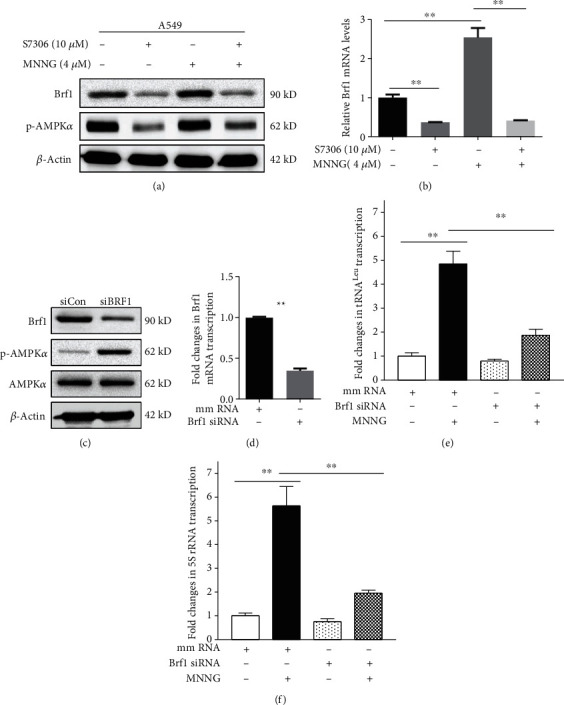
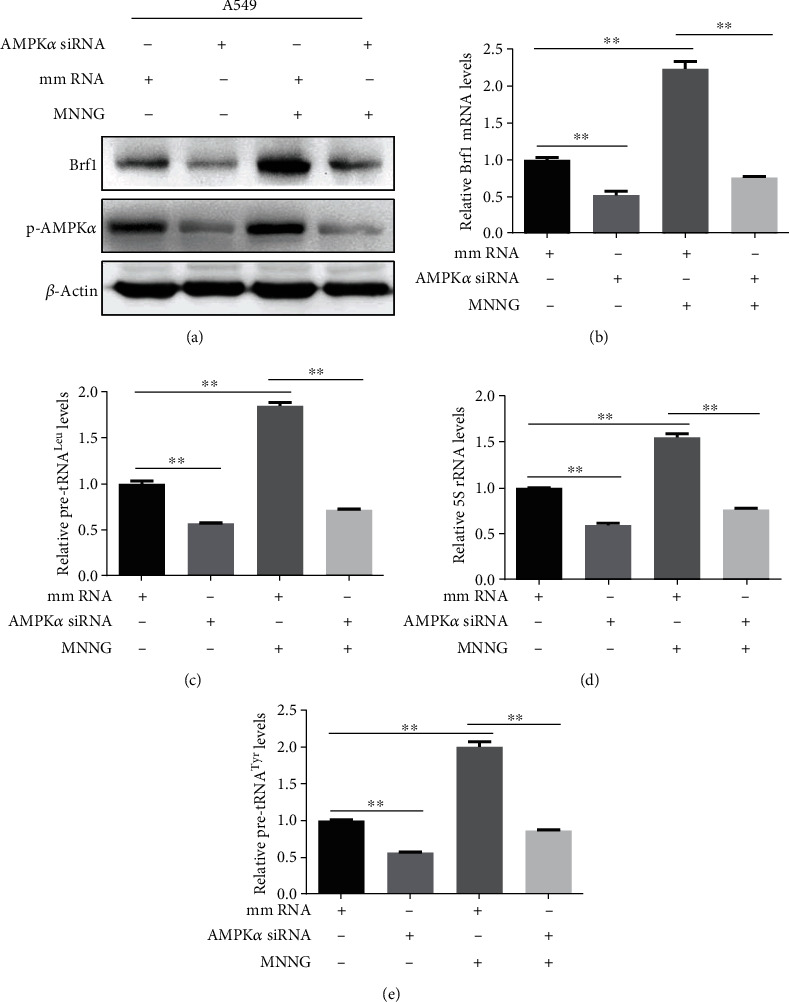
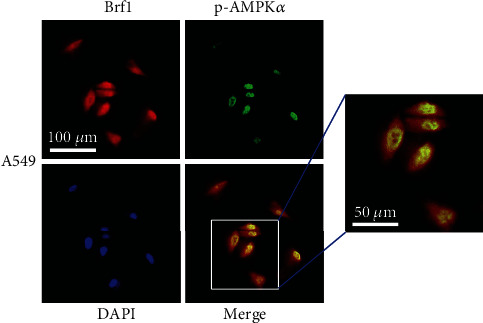
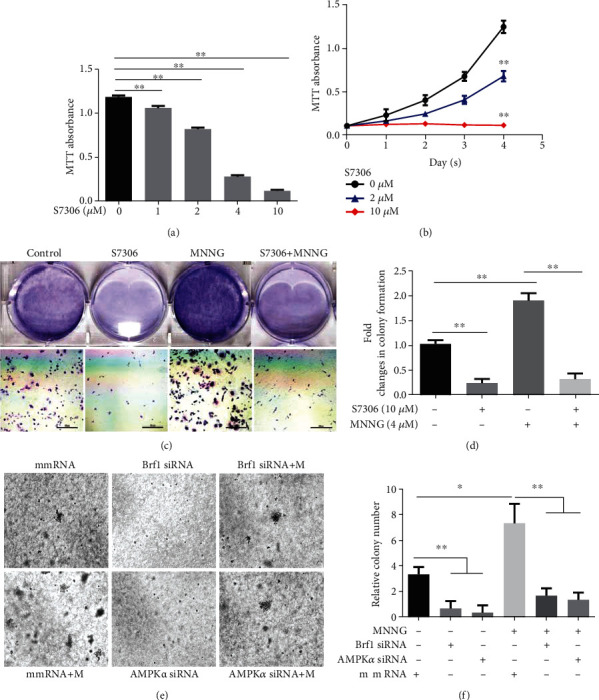
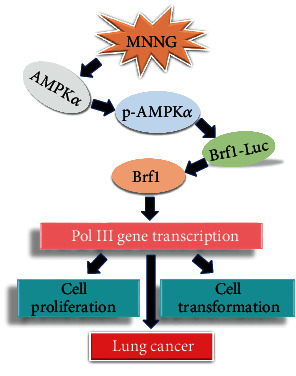
TF IIB-related factor 1 (Brf1) is a key transcription factor of RNA polymerase III (Pol III) genes. Our early studies have demonstrated that Brf1 and Pol III genes are epigenetically modulated by histone H3 phosphorylation. Here, we have further investigated the relationship of the abnormal expression of Brf1 with a high level of phosphorylated AMPKα (pAMPKα) and explored the role and molecular mechanism of pAMPKα-mediated dysregulation of Brf1 and Pol III genes in lung cancer. Brf1 is significantly overexpressed in lung cancer cases. The cases with high Brf1 expression display short overall survival times. Elevation of Brf1 expression is accompanied by a high level of pAMPKα. Brf1 and pAMPKα colocalize in nuclei. Further analysis indicates that the carcinogen MNNG induces pAMPKα to upregulate Brf1 expression, resulting in the enhancement of Pol III transcription. In contrast, inhibiting pAMPKα decreases cellular levels of Brf1, resulting in the reduction of Pol III gene transcription to attenuate the rates of cell proliferation and colony formation of lung cancer cells. These outcomes demonstrate that high Brf1 expression reveals a worse prognosis in lung cancer patients. pAMPKα-mediated dysregulation of Brf1 and Pol III genes plays important roles in cell proliferation, colony formation, and tumor development of lung cancer. Brf1 may be a biomarker for establishing the prognosis of lung cancer. It is a new mechanism that pAMPKα mediates dysregulation of Brf1 and Pol III genes to promote lung cancer development.


Conflict of interest statement

The authors declare no conflict of interest.

Figures

Figure 1
Figure 1
Immunohistochemical staining of Brf1 in lung cancer. (a) Comparison of Brf1 staining in tumor foci tissue with paracancer tissue (para-can) of lung cancer patients. Strong staining signals of Brf1 expression are seen in tumor foci of lung cancer (a, left panel). Weak signals of Brf1 staining are detected in para-can tissue of this disease (a, right panel). Top panel: 100x magnification (scale bar = 200 μm); bottom panel: 630x magnification. (b) Comparison of Brf1 IHC and H&E staining in the same cases of lung cancer. IHC staining about the signals of Brf1 expression in both cytoplasm and nuclei of tumor tissues of lung cancer; (b, left panel) H&E staining of tumor tissues of lung cancer; (b, right panel) 100x magnification (scale bar = 200 μm); 400x magnification. (c) Comparison of Brf1 expression in tumor foci with adjacent noncancerous tissue (ANT). The levels of Brf1 expression were detected in four lung cancer lesions (c, upper panel) and their paired ANT (c, lower panel). 400x magnification (scale bar = 50 μm). The results indicate that Brf1 expression was increased in the tumor tissues at different stages of lung cancer, compared to noncancerous tissues, ANT.
Figure 2
Figure 2
High Brf1 expression correlated with a poor prognosis of lung cancer. (a) The IHC staining scores of Brf1 expression. 185 cases in paired different clinical stages of lung cancer tumor tissues show high Brf1 expression, compared to low expression of Brf1 expression corresponding to normal tissues of these cases (N = 185). (b) 226 cases of human lung cancer patients were performed for Kaplan-Meier analysis of the overall survival period. Lung cancer patients (N = 226) with low versus high expression of Brf1 (Kaplan-Meier analysis with the log-rank test, p < 0.01). (c) Histological classification of the 226 cases of lung cancer. (d) ROC curve analysis. The result reveals that patients with high Brf1 expression display short survival times.
Figure 3
Figure 3
The relationship of AMPKα activation with Brf1 high expression in lung cancers. (a) Immunoblotting analysis of Brf1 and pAMPKα in 8 paired lung cancer tissues (T1: adenocarcinoma IIIB stage; T2: squamous cell carcinoma IIB stage; T3: adenocarcinoma IIA stage; T4: adenocarcinoma IA3 stage; T5: squamous cell carcinoma IIA stage; T6: adenocarcinoma IA1 stage; T7: adenocarcinoma IA3 stage; T8: adenocarcinoma IIIA stage). (b, c) The quantification of cellular levels of Brf1 (b) and pAMPKα (c) in the indicated lung cancer tissues was calculated and compared with the corresponding ANT. p values were determined by a two-tailed t-test. Data are presented as the mean ± SD of at least three independent experiments. p < 0.05, ∗∗p < 0.01.
Figure 4
Figure 4
Brf1 expression in the cell lines of lung cancer and Brf1 promoter activity. (a) Immunoblotting analysis of Brf1 protein levels in the normal human bronchial epithelial cell line (16HBE) and lung cancer cell lines (A549 and H1975). (a) Is a representative result of immunoblotting. (b) RT-qPCR analysis of Brf1 mRNA levels in lung cancer cell lines (A549 and H1975) and nontumor line, 16HBE. (c, d) Brf1 promoter-luciferase activity. The A549 cells were transfected with 0.5 μg Brf1-Luc plasmids. Luciferase assay indicates that the carcinogen MNNG increases the activity of the Brf1 promoter. All error bars represent the SD of at least three independent experiments. p values were determined by a two-tailed t-test. p < 0.05, ∗∗p < 0.01.
Figure 5
Figure 5
MNNG induces Brf1 expression and Pol III gene transcription. A549 cells were treated with different doses of the carcinogen MNNG. The resultant cell lysis and total RNA were extracted from the cells for immunoblotting analysis and RT-qPCR. (a) Immunoblotting analysis of cellular levels of Brf1 and pAMPKα. (b–e) RT-qPCR. Brf1 mRNA (b) and transcription levels of tRNALeu (c), 5S rRNA (d), and tRNATyr (e). The results indicate that MNNG activated pAMPKα and enhanced Brf1 expression and Pol III gene transcription. All error bars represent the SD of at least three independent experiments. p values were determined by a two-tailed t-test. p < 0.05, ∗∗p < 0.01.
Figure 6
Figure 6
The role of Brf1 alteration in transcription of Pol III genes. (a) Immunoblotting analysis of Brf1 and pAMPKα protein levels. A549 cells were treated with AMPK inhibitor, S7306 (12 h with 10 μM), and MNNG (1 h with 4 μM). (b) RT-qPCR analysis of Brf1 mRNA levels in A549 cells treated with S7306 (12 h with 10 μM) and MNNG (1 h with 4 μM). (c) Immunoblotting analysis of Brf1, pAMPKα, and AMPKα protein levels in MNNG-treated A549 cells after siRNA-mediated knockdown of Brf1, compared to mm siRNA as control (siCon). (d) RT-qPCR analysis of Brf1 mRNA levels in A549 cells which were transfected with mmRNA or Brf1 siRNA to knock down Brf1. (e, f) RT-qPCR analysis. Pol III gene transcription in A549 cells was transfected with Brf1 siRNA or mmRNA for 48 h and then treated with MNNG (4 μM) for 1 h. All error bars represent the SD of at least three independent experiments. p values were determined by a two-tailed t-test. p < 0.05, ∗∗p < 0.01.
Figure 7
Figure 7
Repressing AMPKα expression decreases cellular levels of Brf1 and Pol III genes. (a) Immunoblotting analysis of Brf1 and pAMPKα protein levels in A549 cells were treated with MNNG (1 h with 4 μM) after siRNA-mediated knockdown of AMPKα. (b) RT-qPCR analysis of Brf1 mRNA levels in A549 cells treated with MNNG (1 h with 4 μM) after siRNA-mediated knockdown of AMPKα. (c–e) RT-qPCR analysis. A549 cells were transfected with mmRNA or AMPKα siRNA for 48 h and then treated with MNNG (1 h with 4 μM). The cellular levels of pre-tRNALeu (c), 5S rRNA (d), and pre-tRNATyr (e) transcription were determined by RT-qPCR. All error bars represent the SD of at least three replicates from two independent experiments. p values were determined by a two-tailed t-test. p < 0.05, ∗∗p < 0.01.
Figure 8
Figure 8
Colocalization of Brf1 and pAMPKα in lung cancer cells. Localizations of Brf1 and pAMPKα: Brf1 (red) and pAMPKα (green) and cell nuclei were stained with DAPI (blue) in A549 cells. The signals of Brf1 (red) and pAMPKα (green) were determined by immunofluorescence staining. The merging picture clearly shows that the colocalization signals of Brf1 and pAMPKα are seen in the nuclei of A549 cells (scale bar = 50 μm).
Figure 9
Figure 9
pAMPKα mediated the alteration of Brf1 resulting in cellular phenotypic changes. (a, b) MTT assay. A549 cells were pretreated with or without AMPK inhibitor S7306 for 4 days: (a) dose curve (4 days); (b) time course; (c) colony formation assays: A549 cells were cultured in RPMI 1640 alone or with S7306 or MNNG for 1 week or longer (scale bar = 500 μm). The colonies were stained with 0.1% crystal violet solution. (d) Quantification of the colony numbers of A549 cells calculated after being cultured alone or in S7306 or MNNG for 1 week. (e) A549 cells were transfected with mmRNA, Brf1 siRNA, or AMPKα siRNA, respectively. After knockdown of Brf1 or AMPKα for 48 h, the cells were seeded into soft agar and treated alone or with MNNG (4 μM) for 1-2 weeks to observe colony formation. (f) Quantification of the clonogenicity of A549 cells as described previously (e). All error bars represent the SD of at least three independent experiments. p values were determined by a two-tailed t-test. p < 0.05, ∗∗p < 0.01.
Figure 10
Figure 10
Schematic illustration of pAMPKα mediates dysregulation of Brf1 and Pol III gene transcription. In the study, high levels of Brf1 expression and pAMPKα are detected in human samples of lung cancer. Mechanism analysis indicates that the carcinogen MNNG induces pAMPKα to enhance Brf1 promoter activity, resulting in Brf1 expression and Pol III gene transcription, which increase the rates of cell proliferation and colony formation, eventually resulting in cancer development.

Similar articles

Cited by

References

    1. Wu Y. L., Cheng Y., Zhou X., et al. Dacomitinib versus gefitinib as first-line treatment for patients with _EGFR_ -mutation-positive non-small-cell lung cancer (ARCHER 1050): a randomised, open-label, phase 3 trial. The Lancet Oncology. 2017;18(11):1454–1466. doi: 10.1016/S1470-2045(17)30608-3. - DOI - PubMed
    1. Chen W., Zheng R., Baade P. D., et al. Cancer statistics in China, 2015. CA: a Cancer Journal for Clinicians. 2016;66(2):115–132. doi: 10.3322/caac.21338. - DOI - PubMed
    1. Reguart N., Marin E., Remon J., Reyes R., Teixido C. In search of the long-desired 'Copernican therapeutic revolution' in small-cell lung cancer. Drugs. 2020;80(3):241–262. doi: 10.1007/s40265-019-01240-8. - DOI - PubMed
    1. Davidson M. R., Gazdar A. F., Clarke B. E. The pivotal role of pathology in the management of lung cancer. Journal of Thoracic Disease. 2013;5(Suppl 5):S463–S478. - PMC - PubMed
    1. Dayen C., Debieuvre D., Molinier O., et al. New insights into stage and prognosis in small cell lung cancer: an analysis of 968 cases. Journal of Thoracic Disease. 2017;9(12):5101–5111. doi: 10.21037/jtd.2017.11.52. - DOI - PMC - PubMed

Substances

LinkOut - more resources