. 2021 Apr 7:19:1956-1965.
doi: 10.1016/j.csbj.2021.04.015. eCollection 2021.

Multiblock metabolomics: An approach to elucidate whole-body metabolism with multiblock principal component analysis

Affiliations

Multiblock metabolomics: An approach to elucidate whole-body metabolism with multiblock principal component analysis

Kazuhiro Tanabe et al. Comput Struct Biotechnol J. .

Abstract

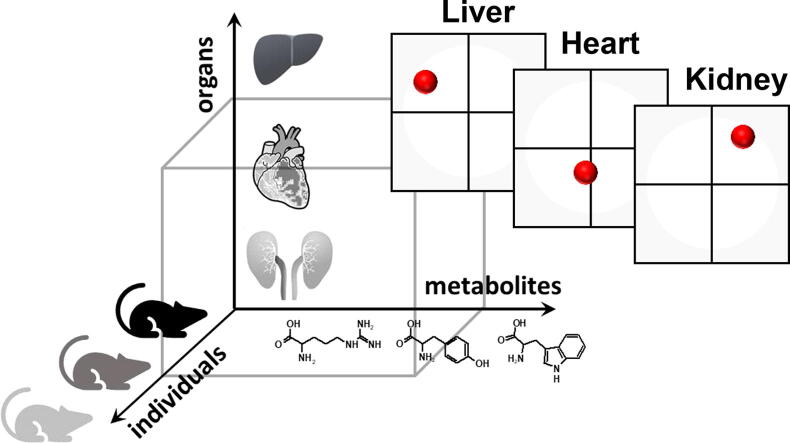
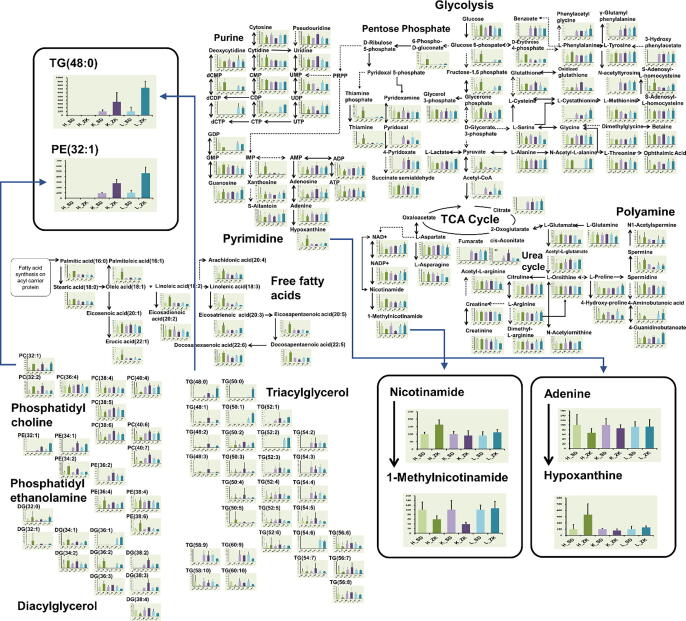
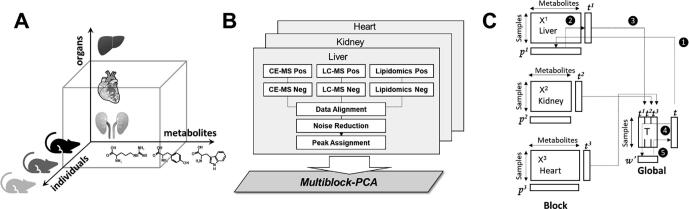
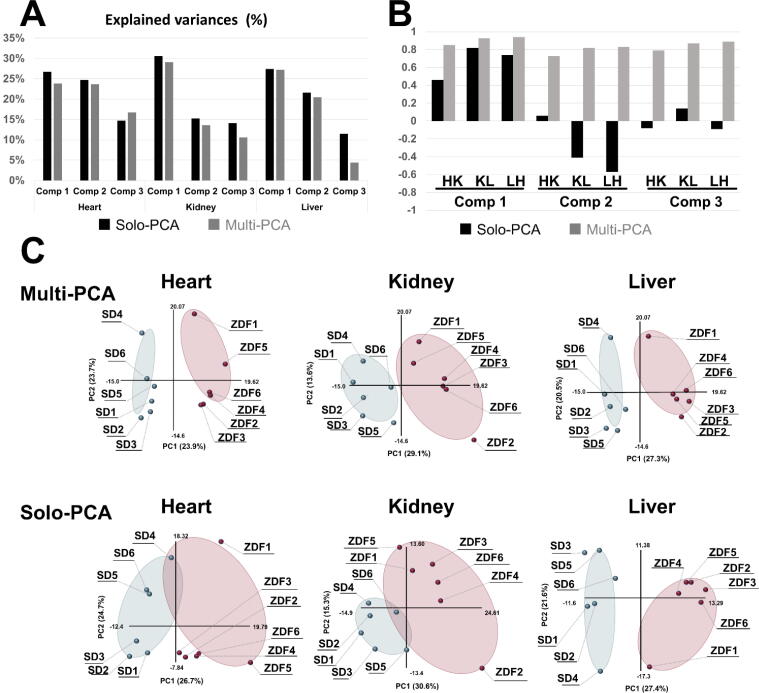
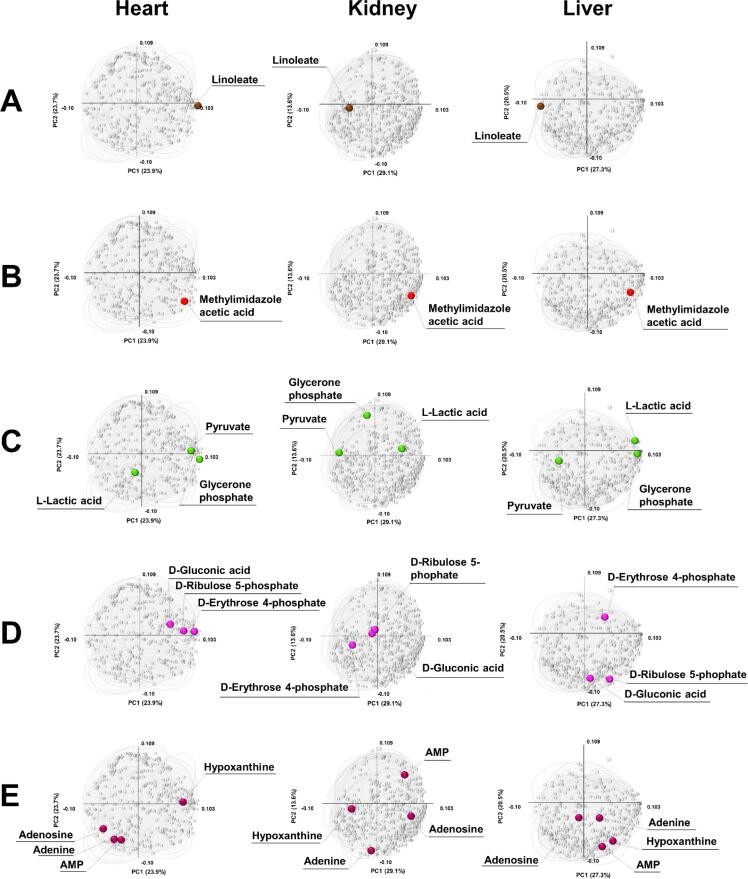
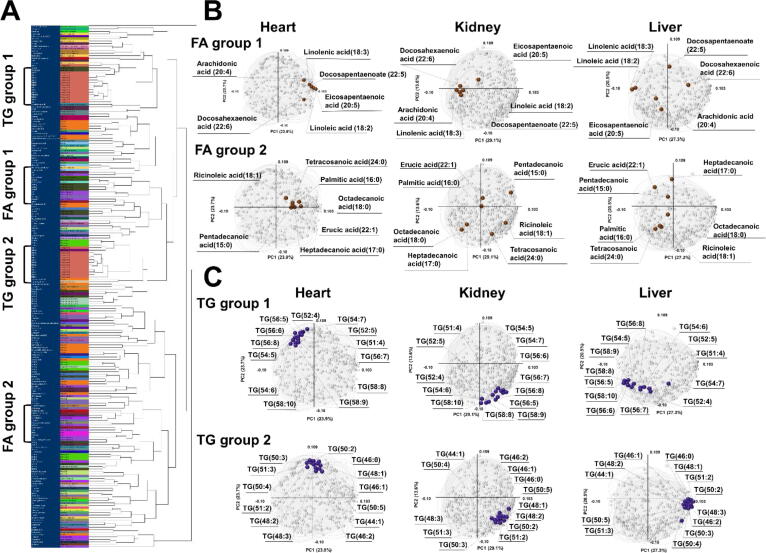
Principal component analysis (PCA) is a useful tool for omics analysis to identify underlying factors and visualize relationships between biomarkers. However, this approach is limited in addressing life complexity and further improvement is required. This study aimed to develop a new approach that combines mass spectrometry-based metabolomics with multiblock PCA to elucidate the whole-body global metabolic network, thereby generating comparable metabolite maps to clarify the metabolic relationships among several organs. To evaluate the newly developed method, Zucker diabetic fatty (ZDF) rats (n = 6) were used as type 2 diabetic models and Sprague Dawley (SD) rats (n = 6) as controls. Metabolites in the heart, kidney, and liver were analyzed by capillary electrophoresis and liquid chromatography mass spectrometry, respectively, and the detected metabolites were analyzed by multiblock PCA. More than 300 metabolites were detected in the heart, kidney, and liver. When the metabolites obtained from the three organs were analyzed with multiblock PCA, the score and loading maps obtained were highly synchronized and their metabolism patterns were visually comparable. A significant finding in this study was the different expression patterns in lipid metabolism among the three organs; notably triacylglycerols with polyunsaturated fatty acids or less unsaturated fatty acids showed specific accumulation patterns depending on the organs.

Keywords: AMP, adenosine monophosphate; Biomarkers; CE/MS, capillary electrophoresis mass spectrometry; CV, coefficient of variation; ESI, electrospray ionization; FABP, fatty acid-binding protein; GC/MS, gas chromatography mass spectrometry; LC/MS, liquid chromatography mass spectrometry; Mass spectrometry; Metabolomics; Multiblock PCA; PCA, principal component analysis; PPAR, peroxisome proliferator-activated receptor; QC, quality control; SD, Sprague Dawley; TCA, tricarboxylic acid. CoA, coenzyme A; TG, triacylglycerol; Type 2 Diabetes; UPLC, ultra-performance liquid chromatography; ZDF, Zucker diabetic fatty.


Conflict of interest statement

The authors declare that they have no known competing financial interests or personal relationships that could have appeared to influence the work reported in this paper.

Figures

None
Graphical abstract
Fig. 1
Fig. 1
Metabolite pathway analysis. Pathways of glycolysis, pentose phosphate, tricarboxylic acid (TCA), purine, and lipid metabolism are shown as bar graphs: light green [H_SD], SD heart; green [H_ZK], ZDF heart; light purple [K_SD], SD kidney; purple [K_ZK], ZDF kidney; light blue [L_SD], SD liver; and dark blue [L_ZK], ZDF liver. Opposite behaviors between the precursor and product (e.g., nicotinamide to 1-methylnicotinamide or adenine to hypoxanthine in the heart) are highlighted with magnified bar graphs. (For interpretation of the references to colour in this figure legend, the reader is referred to the web version of this article.)
Fig. 2
Fig. 2
Multiblock metabolomics scheme. (A) Multiblock metabolomics requires a three-dimensional data structure, metabolites, individual samples, and organs. (B) Metabolomics data obtained from CE/MS and LC/MS (hilic and lipid modes) were merged into one data table. After noise reduction, peaks were identified based on the matched m/z values and normalized retention times of the corresponding standard compounds. This process was repeated for the heart, kidney, and liver, and three data matrices were integrated using multiblock PCA. (C) Multiblock PCA architecture: ❶All blocks of X1,2,3 were regressed by an arbitrary global score t to obtain the block loadings p1,2,3. ❷The block scores t1,2,3 were calculated with the normalized block loadings p1,2,3 using the following equation: tb = Xbpb where b = 1, 2, 3. ❸All block scores were combined to a global score matrix T. ❹The global score matrix T was regressed by the global score vector t, resulting in the global weights. ❺ Global weights were normalized to length one and a new global score vector t was then calculated.
Fig. 3
Fig. 3
Comparison of multiblock PCA and solo PCA. Multiblock and solo-PCA were performed with the metabolomic data of the heart, kidney, and liver. (A) The explained variances (%) are indicated by black (solo) and gray (multiblock) bars for the first three components. (B) The cos θ values of the t block scores in the solo and multiblock PCAs are indicated by black and gray bars, respectively. HK: cos θ between heart and kidney, KL: cos θ between kidney and liver, LH: cos θ between liver and heart. (C) The tb block scores of the first and second components are plotted for the multiblock and solo PCAs for the three organs. Six SD rats and six ZDF rats are plotted as light blue and red solid circles in the scatter plots. (For interpretation of the references to colour in this figure legend, the reader is referred to the web version of this article.)
Fig. 4
Fig. 4
Simultaneous multiorgan analysis with multiblock PCA. Scattered block loading plots generated by the multiblock PCA for the heart, kidney, and liver were aligned horizontally: linoleate (A), methylimidazoleacetic acid (B), glycolysis (C), pentose phosphate pathway (D), and AMP-related metabolites (E). All metabolites are plotted as light gray circles to clarify the relative locations.
Fig. 5
Fig. 5
Combination of cluster analysis and multiblock PCA. (A) The multiblock PCA block loading p values of 203 commonly detected metabolites in the three organs were classified by cluster analysis based on their metabolite categories. (B) Free fatty acids belonging to FA groups 1 and 2 are plotted as brown solid circles in the heart, kidney, and liver block loading maps. (C)Triacylglycerols belonging to TG groups 1 and 2 are plotted with violet solid circles for the first and second component loading maps in the heart, kidney, and liver. (For interpretation of the references to colour in this figure legend, the reader is referred to the web version of this article.)

Similar articles

Cited by

References

    1. Zhou W., Sailani M.R., Contrepois K., Zhou Y., Ahadi S. Longitudinal multi-omics of host-microbe dynamics in prediabetes. Nature. 2019;569:663–671. - PMC - PubMed
    1. Burrage L.C., Thistlethwaite L., Stroup B.M., Sun Q., Miller M.J. Untargeted metabolomic profiling reveals multiple pathway perturbations and new clinical biomarkers in urea cycle disorders. Genet Med. 2019;21:1977–1986. - PMC - PubMed
    1. Hocher B. Adamski J Metabolomics for clinical use and research in chronic kidney disease. Nat Rev Nephrol. 2017;13:269–284. - PubMed
    1. Carneiro T.J., Araújo R., Vojtek M., Gonçalves-Monteiro S., Diniz C. Multi-organ NMR metabolomics to assess in vivo overall metabolic impact of cisplatin in mice. Metabolites. 2019;9(11):279. - PMC - PubMed
    1. Tyagi R., Rana P., Gupta M., Khan A.R., Bhatnagar D. Differential biochemical response of rat kidney towards low and high doses of NiCl2 as revealed by NMR spectroscopy. J Appl Toxicol. 2013;33:134–141. - PubMed

LinkOut - more resources