. 2021 Apr 5:19:2027-2044.
doi: 10.1016/j.csbj.2021.03.036. eCollection 2021.

Computational study on the allosteric mechanism of Leishmania major IF4E-1 by 4E-interacting protein-1: Unravelling the determinants of m7GTP cap recognition

Affiliations

Computational study on the allosteric mechanism of Leishmania major IF4E-1 by 4E-interacting protein-1: Unravelling the determinants of m7GTP cap recognition

Lilian Hernández-Alvarez et al. Comput Struct Biotechnol J. .

Abstract

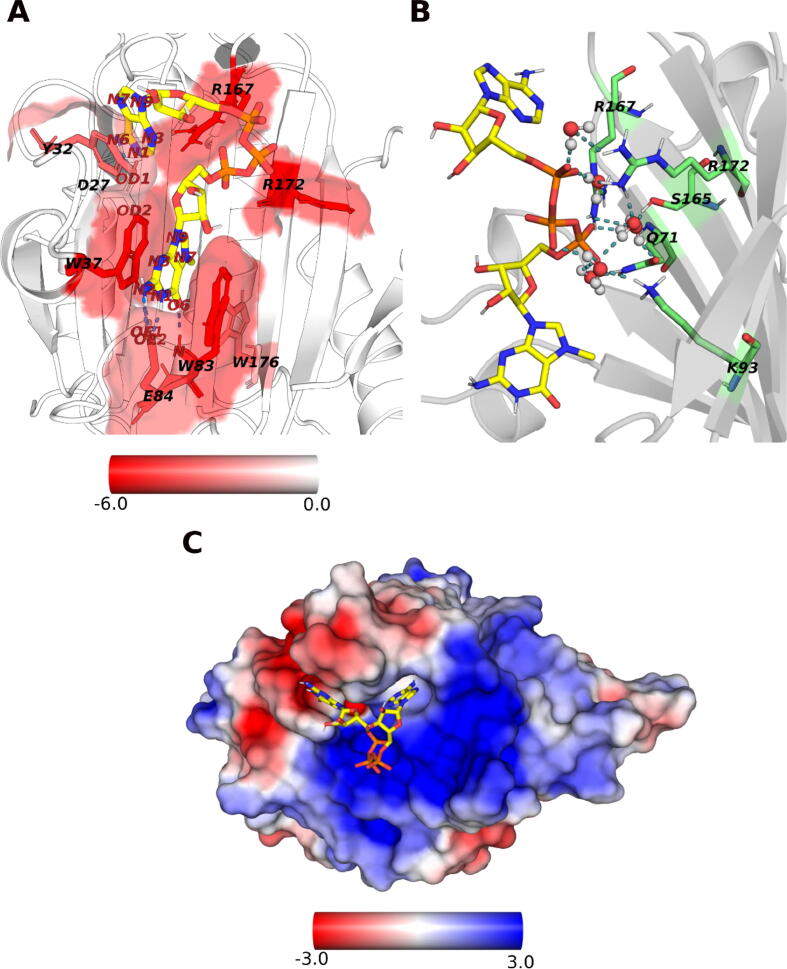
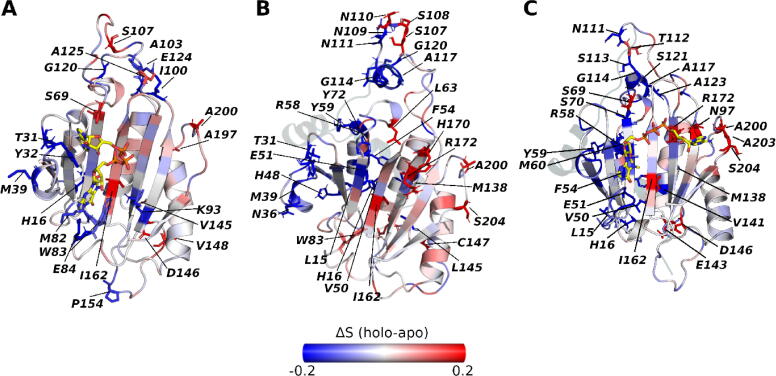
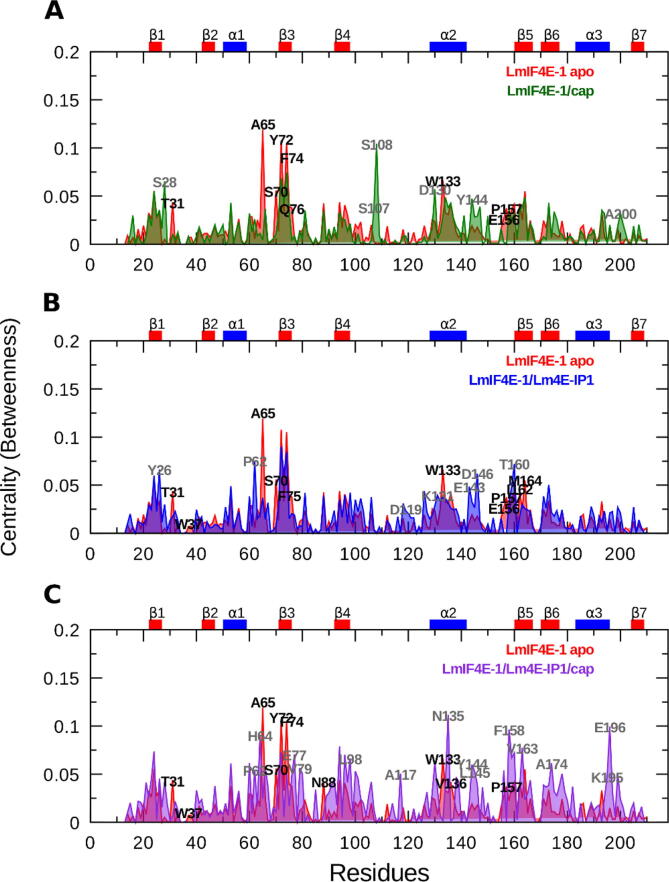
During their life cycle, Leishmania parasites display a fine-tuned regulation of the mRNA translation through the differential expression of isoforms of eukaryotic translation initiation factor 4E (LeishIF4Es). The interaction between allosteric modulators such as 4E-interacting proteins (4E-IPs) and LeishIF4E affects the affinity of this initiation factor for the mRNA cap. Here, several computational approaches were employed to elucidate the molecular bases of the previously-reported allosteric modulation in L. major exerted by 4E-IP1 (Lm4E-IP1) on eukaryotic translation initiation factor 4E 1 (LmIF4E-1). Molecular dynamics (MD) simulations and accurate binding free energy calculations (ΔGbind ) were combined with network-based modeling of residue-residue correlations. We also describe the differences in internal motions of LmIF4E-1 apo form, cap-bound, and Lm4E-IP1-bound systems. Through community network calculations, the differences in the allosteric pathways of allosterically-inhibited and active forms of LmIF4E-1 were revealed. The ΔGbind values show significant differences between the active and inhibited systems, which are in agreement with the available experimental data. Our study thoroughly describes the dynamical perturbations of LmIF4E-1 cap-binding site triggered by Lm4E-IP1. These findings are not only essential for the understanding of a critical process of trypanosomatids' gene expression but also for gaining insight into the allostery of eukaryotic IF4Es, which could be useful for structure-based design of drugs against this protein family.

Keywords: 4E-binding proteins; Adaptive Biasing Force (ABF) calculations; Allostery; Eukaryotic Initiation Factor-4E; Leishmania major; Molecular dynamics; mRNA cap.


Conflict of interest statement

The authors declare no competing interests.

Figures

None
Graphical abstract
Fig. 1
Fig. 1
Three-dimensional structure of LmIF4E-1/Lm4E-IP1 complex. Representation of 5WB5 structure, where each secondary structure element of LmIF4E-1, i.e., β strands (S), α helices (H) and loops (L), are labeled and numbered from the N- to C-terminus. Tryptophans involved in m7G binding are depicted as green sticks and the Lm4E-IP1 fragment is colored in dark gray. (For interpretation of the references to color in this figure legend, the reader is referred to the web version of this article.)
Fig. 2
Fig. 2
Binding mode of m7GpppA within the cap-binding pocket of LmIF4E-1. (A) Representative structure calculated from the MD simulations of the LmIF4E-1/m7GpppA complex. The surface of the cap-binding site is colored according to the values of per-residue energy contribution (ΔGres) and the m7GpppA molecule is depicted as sticks. The ΔGres values are expressed in kcal/mol. Hydrogen bonds are displayed as blue-dashed lines, and the main interacting residues are labeled in each case. (B) Water bridges network established at the interface of m7GpppA and LmIF4E-1. Water molecules are represented as spheres and interacting residues are labeled. (C) Electrostatic potential surface representation of LmIF4E-1. Electrostatic potentials are colored using a −3 to + 3 scale, expressed in kbT/e units, where kb, T, and e stand for the Boltzmann’s constant, the temperature (298.15 K), and the electron charge, respectively. (For interpretation of the references to color in this figure legend, the reader is referred to the web version of this article.)
Fig. 3
Fig. 3
PMF profiles obtained from ABF simulations performed for the LmIF4E-1/cap system. The ΔG value shown in the graph was calculated as the difference between the average of the PMF values in the global minima and the plateau of the 150 ns curve. Representative conformations of the LmIF4E-1 and the cap are displayed as transition states of each local and global minima along the reaction coordinate. The protein is shown in gray cartoon and the cap-interacting residues are displayed as green sticks. The m7GpppA molecule is represented in yellow sticks. (For interpretation of the references to color in this figure legend, the reader is referred to the web version of this article.)
Fig. 4
Fig. 4
PMF profiles obtained from ABF simulations performed for the LmIF4E-1/Lm4E-IP1/cap system. The ΔG value shown in the graph was calculated as the difference between the average of the PMF values in the global minima and the plateau of the 150 ns curve. Representative conformations of the LmIF4E-1, Lm4E-IP1, and the cap are displayed as transition states of each local and global minima along the reaction coordinate. LmIF4E-1 and Lm4E-IP1 are shown in gray and teal cartoons, respectively. The cap-interacting residues and the m7GpppA molecule are displayed as green and yellow sticks, respectively. (For interpretation of the references to color in this figure legend, the reader is referred to the web version of this article.)
Fig. 5
Fig. 5
RMSF and RMSD analysis of LmIF4E-1 simulated complexes. (A) RMSF profiles and (B) RMSD distribution calculated for the backbone atoms of LmIF4E-1 in each simulated condition. On the right panel, LmIF4E-1 is drawn in cartoon putty representation; the blue and red colors represent the lowest and the highest values of RMSF assigned to B-factor, respectively. In addition, the size of the tube is proportional to the value of the B-factor, i.e., the larger the B-factor, the thicker the tube. The representative structure obtained from the MD simulations of the apo form was taken as a reference for RMSF and RMSD calculations. (For interpretation of the references to color in this figure legend, the reader is referred to the web version of this article.)
Fig. 6
Fig. 6
Two-dimensional projection of LmIF4E-1 trajectories onto the first two eigenvectors obtained from the PCA. (A) Projection of the structural ensembles of the LmIF4E-1 apo form along PC1 (horizontal axis) and PC2 (vertical axis). The color gradient employed for coloring the histogram was defined according to the population density of each conformational state of LmIF4E, i.e., blue (less populated) to red (more populated). The holo forms (yellow-orange scale) were projected onto the eigenvectors of the apo form (blue scale) for (B) LmIF4E-1/cap, (C) LmIF4E-1/Lm4E-IP1 and (D) LmIF4E-1/Lm4E-IP1/cap complexes. (For interpretation of the references to color in this figure legend, the reader is referred to the web version of this article.)
Fig. 7
Fig. 7
Changes in conformational disorder (Shannon entropy) of LmIF4E-1 residues. The ΔS values are defined as the difference between the S values of the apo form from those of the holo forms in (A) LmIF4E-1/cap, (B) LmIF4E-1/Lm4E-IP1, and (C) LmIF4E-1/Lm4E-IP1/cap complexes. The scale is colored from blue (decreased disorder relative to the apo form) to red (increased disorder relative to the apo form). (For interpretation of the references to color in this figure legend, the reader is referred to the web version of this article.)
Fig. 8
Fig. 8
Free energy as a function of torsion angledistributionsof tryptophan residues establishing sandwich-like interactions with m7G. Global and local minima of rotameric states sampled for W37 (top) and W83 (bottom) along the MD simulations in each LmIF4E-1 system. The distribution of the calculated values for χ1 and χ2 dihedral angles are shown beside each axis. The representative structure of Trp residue in the highly-populated minima are displayed as sticks, and the χ1 and χ2 angles are colored as yellow and red, respectively. (For interpretation of the references to color in this figure legend, the reader is referred to the web version of this article.)
Fig. 9
Fig. 9
Analysis of community networks in LmIF4E-1. Community organization of (A) LmIF4E-1 apo, (B) LmIF4E-1/cap, (C) LmIF4E-1/Lm4E-IP1, and (D) LmIF4E-1/Lm4E-IP1/cap systems. The circle size is proportional to the number of residues contained within each community and the edge thickness is proportional to the strength of the intercommunity correlations. The right panel shows the community organization within the LmIF4E-1 structure in each case. Correlation values above 0.6 are represented as red lines connecting the initiation factor Cα’s. (For interpretation of the references to color in this figure legend, the reader is referred to the web version of this article.)
Fig. 10
Fig. 10
Residue centralities calculated fortheLmIF4E-1 analyzed systems. Profiles of normalized centrality values represented as a comparison between the apo form (red graph) and (A) LmIF4E-1/cap, (B) LmIF4E-1/Lm4E-IP1, and (C) LmIF4E-1/Lm4E-IP1/cap complexes. Residues with significative changes in centrality values (high ΔCentrality) are labeled in black for the apo system and in gray for the holo ones. (For interpretation of the references to color in this figure legend, the reader is referred to the web version of this article.)
Fig. 11
Fig. 11
Node degeneracy derived from calculations of the suboptimal paths connecting Y59 and W37 residues. The apo form (red) was used as a reference system and was compared with (A) LmIF4E-1/cap (green), (B) LmIF4E-1/Lm4E-IP1 (blue), and (C) LmIF4E-1/Lm4E-IP1/cap (purple) complexes. All degeneracy values are normalized. The 1000 suboptimal paths emerging from Y59 (allosteric groove) and reaching the W37 (cap-binding site) are displayed within the representative structure of LmIF4E-1 as splines, and are always compared with those of the apo system. (For interpretation of the references to color in this figure legend, the reader is referred to the web version of this article.)
Fig. 12
Fig. 12
Structural representation of the shortest paths calculated for the different LmIF4E-1 systems. Residues forming the shortest path of (A) LmIF4E-1 apo, (B) LmIF4E-1/cap, (C) LmIF4E-1/Lm4E-IP1 and (D) LmIF4E-1/Lm4E-IP1/cap complexes. The surface of source (Y59) and sink (W37) residues is colored in red and the surface of connecting residues is in yellow. Each residue involved in signal transmission is labeled and represented as green sticks. LmIF4E-1 and Lm4E-IP1 are shown in gray and teal cartoons, respectively, and the m7GpppA molecule is displayed as yellow sticks. (For interpretation of the references to color in this figure legend, the reader is referred to the web version of this article.)

Similar articles

Cited by

References

    1. Torres-Guerrero E. Leishmaniasis: a review. F1000Res. 2017;6:750. - PMC - PubMed
    1. Steverding D. The history of leishmaniasis. Parasit Vectors. 2017;10(1):82. - PMC - PubMed
    1. Hotez P.J., Savioli L., Fenwick A. Neglected tropical diseases of the Middle East and North Africa: review of their prevalence, distribution, and opportunities for control. PLoS Negl Trop Dis. 2012;6(2) - PMC - PubMed
    1. Hotez P., Bundy D.A.P. The PLOS Neglected Tropical Diseases decade. PLoS Negl Trop Dis. 2017;11(4) - PMC - PubMed
    1. Rajasekaran R., Chen Y.P. Potential therapeutic targets and the role of technology in developing novel antileishmanial drugs. Drug Discov Today. 2015;20(8):958–968. - PubMed