Review
. 2021 Apr 20:19:2057-2069.
doi: 10.1016/j.csbj.2021.04.013. eCollection 2021.

DNA replication machinery: Insights from in vitro single-molecule approaches

Affiliations
Review

DNA replication machinery: Insights from in vitro single-molecule approaches

Rebeca Bocanegra et al. Comput Struct Biotechnol J. .

Abstract

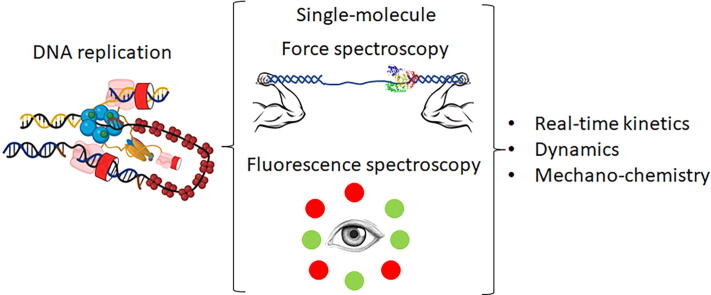
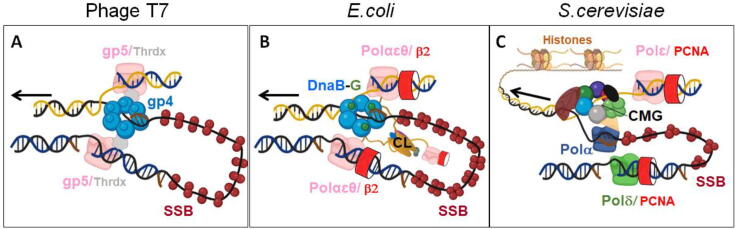
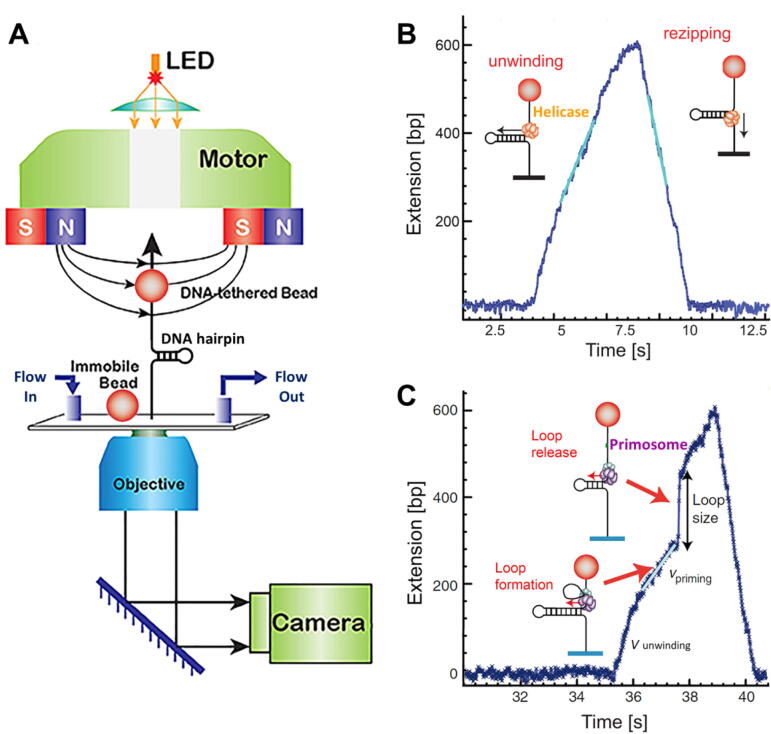
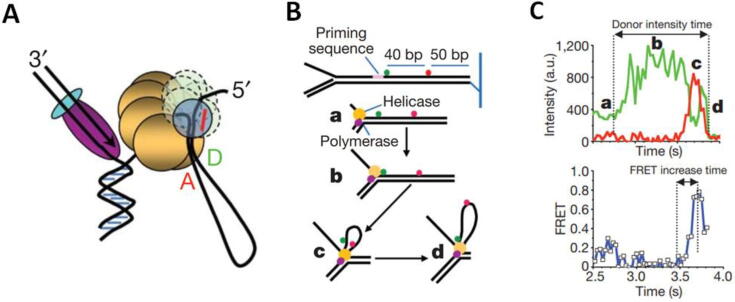
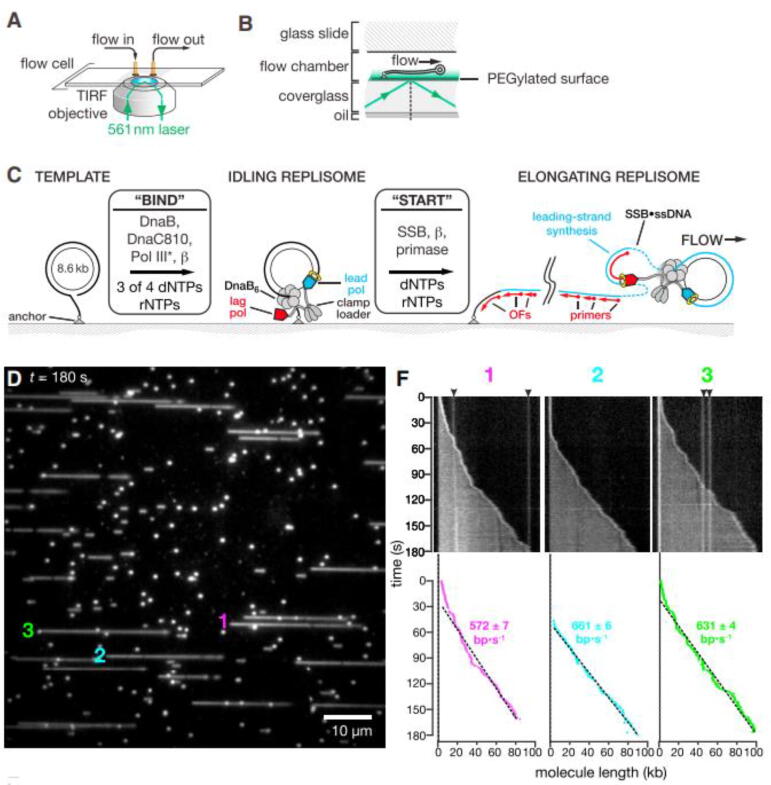
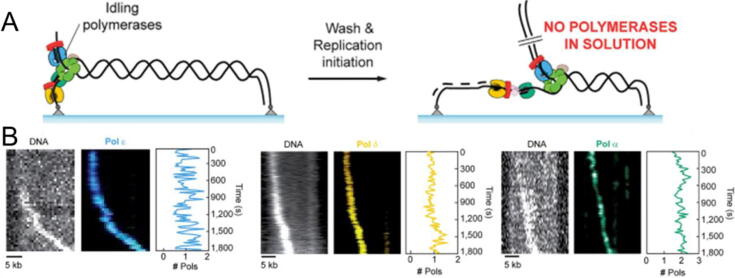
The replisome is the multiprotein molecular machinery that replicates DNA. The replisome components work in precise coordination to unwind the double helix of the DNA and replicate the two strands simultaneously. The study of DNA replication using in vitro single-molecule approaches provides a novel quantitative understanding of the dynamics and mechanical principles that govern the operation of the replisome and its components. 'Classical' ensemble-averaging methods cannot obtain this information. Here we describe the main findings obtained with in vitro single-molecule methods on the performance of individual replisome components and reconstituted prokaryotic and eukaryotic replisomes. The emerging picture from these studies is that of stochastic, versatile and highly dynamic replisome machinery in which transient protein-protein and protein-DNA associations are responsible for robust DNA replication.

Keywords: DNA replication; Fluorescence spectroscopy; Force spectroscopy; Replisome; Single-molecule.


Conflict of interest statement

The authors declare that they have no known competing financial interests or personal relationships that could have appeared to influence the work reported in this paper.

Figures

None
Graphical abstract
Fig. 1
Fig. 1
Schematic representations of replisomes of increasing complexity. For all figures arrows show the direction of the replication fork and leading strand (top) is depicted yellow and lagging strand (bottom) black. A) The bacteriophage T7 replisome is formed by 4 proteins: DNApol (gp5) and its processivity factor thioredoxin (Thrdx), the helicase-primase (gp4) and SSBs (gp2.5). The helicase (gp4) translocates in 5′–3′ direction on the lagging strand and synthesizes primers (brown) for the discontinuous synthesis of the lagging strand. Two or more DNApols (gp5) interact with the C-terminal tail of the helicase and replicate the two DNA strands. DNApols can also exchange with external DNApols at forks. The SSB gp2.5 covers exposed ssDNA regions and interacts with the DNApols and the helicase, regulating their activities. B) The Escherichia coli (E.coli) replisome is composed of at least 14 different protein subunits. The DnaB helicase translocates in 5′–3′ direction on the lagging strand, promotes strand separation, and interacts transiently with one or more DnaG primases for RNA priming (brown). The DNApol III holoenzyme is responsible for DNA synthesis and is made up of three subassemblies: (i) the αɛθ core polymerase complex that copy DNA, (ii) the β2 sliding clamp or processivity factor, and (iii) the seven-subunit clamp loader complex (CL) that loads β2 onto primer–template junctions and coordinates replication of the two strands. Up to three, readily exchangeable, core polymerase complexes bind to each fork. The coordinated synthesis of the two strands could be the outcome of the stochastic behavior of the DNApols at each strand. The SSB protein protects ssDNA and promotes helicase and DNApol activities. C) Up to 34 protein subunits built up the eukaryotic S. cerevisiae core replisome. The key components include: i) the 11-subunit heterohexameric CMG helicase that translocates on the leading strand in 3′–5′ direction, ii) three multi-subunit DNA polymerases: the leading-strand Pol ε, lagging-strand Pol δ, and Pol α-primase. Pol δ and Pol α are recycled to support the synthesis of multiple Okazaki fragments, iii) the replication factor C involved in attaching the processivity clamp (PCNA) to Pol δ, and iv) the RPA trimeric SSB protein. Numerous other proteins interact transiently with the eukaryotic replisome, some of which are known to be involved in checkpoint regulation or nucleosome handling, since in eukaryotes DNA is complexed to histones. (Adapted from [15]). (For interpretation of the references to colour in this figure legend, the reader is referred to the web version of this article.)
Fig. 2
Fig. 2
Single-molecule Förster resonance energy transfer (smFRET). A) smFRET is based on the non-radiative energy transfer between nearby located donor (green) and acceptor (red) fluorophores, which results in a decrease in the donor (green) and a concomitant increase in the acceptor (red) fluorescence signals. Monitoring the degree of energy transfer reports on the distance and dynamics of intra- and inter- molecular interactions on the sub–10 nm scale. Bottom panel shows a characteristic trace of FRET efficiency depending on donor and acceptor proximity (adapted from [9]). B) Schematic illustration of labeling strategy used to probe the finger-closing conformational change in Pol I Klenow fragment. The donor fluorophore (green) is attached to the primer DNA and the acceptor fluorophore (red) to the tip of the fingers subdomain. As the fingers pivot between the open and closed positions the distance between the two fluctuates, which induce changes in FRET signal. C) Left panel. Characteristic fluorescence intensity time traces (green donor and red acceptor), and smFRET efficiency trajectories (blue) for a DNApol-DNA complex labeled as in B. FRET efficiency histograms (right panel) show 4 major populations that the authors assigned to the open, ajar (intermediate) and closed conformations of the fingers subdomain, and a population of DNA bound at the distant exonuclease site (B and C panels are adapted from [41]). (For interpretation of the references to colour in this figure legend, the reader is referred to the web version of this article.)
Fig. 3
Fig. 3
Optical tweezers and ‘Fleezers’. A): Diagram of a dual-beam optical tweezers setup. Two high numerical aperture objectives focus two counter-propagating 808 nm lasers, A (in green) and B (in yellow) inside a flow cell to form two optical traps. The position of each laser is controlled by piezo actuators. The two traps are superimposed in the same spatial position so that they function as one trap, effectively. To monitor the optical trap position beam-splitters divert a small percentage of the incoming light of each laser to position sensitive detectors (PSDs). The light leaving from each trap is sent to a different PSD to measure forces . A CCD camera and a blue LED light (blue line) allow visualization of the interior of the flow cell (adapted from [101]). The panel on the right shows idealized lateral view of the flow cell showing a DNA molecule attached between two micron-sized polystyrene beads, one in the optical trap (orange cone) and the other on top of a micropipette. B) Experimental set-up to measure polymerization and exonucleolysis activities of individual DNApols with dual-beam optical tweezers . A single DNA molecule containing a single-stranded gap is tethered to functionalized beads as in (A). At constant mechanical tension below 30 pN, the DNApol converts the single-stranded template (ssDNA) to double-stranded DNA (dsDNA). This activity is followed in real-time as a gradual shortening of the distance between the beads (Δx, green). Tension above 30–40 pN shifts the equilibrium towards the exonuclease activity, which is measured as a gradual increase in the distance between the beads (Δx, red). C) The force–extension curves of dsDNA and ssDNA can be described using polymer physics models (red lines) (reviewed in [102]). At constant force, the conversion from one polymer to the other by DNApol activities is captured as a change in extension D) Experimental set-up to measure the wrapping dynamics of E.coli SSB with a hybrid instrument that combines high-resolution optical tweezers with fluorescence detection (Fleezers, [103]). Polystyrene beads (grey) are held in separated optical traps (orange cones), tethered by a DNA molecule containing a short ssDNA region. The DNA is labeled with a FRET acceptor at the ss-dsDNA junction (red dot) and the SSB (tetramer) with the FRET donor (green dot). Fluorophores are excited by a ~ 500 nm laser (green cone). E.coli SSB binds to ssDNA and wraps either 35 or 65 nucleotides depending on the experimental conditions (as shown on the left diagram). ssDNA wrapping decreases the extension between the beads (Δx). E) Simultaneous measurement of tether extension (top) and FRET efficiency (bottom) enables determination of both the position of SSB along the tether and the amount of ssDNA wrapped (adapted from [104]). (For interpretation of the references to colour in this figure legend, the reader is referred to the web version of this article.)
Fig. 4
Fig. 4
Magnetic tweezers. A) Diagram of a magnetic tweezers setup. A paramagnetic bead is tethered to the surface of a flow cell via a functionalized DNA molecule. Beads stuck directly to the surface are used as a reference for drift correction. Permanent magnets produce magnetic field that pulls the bead in the direction of the field gradient (arrows). The orientation of magnetic field exerts horizontal and/ or vertical magnetic forces to stretch force or twist the DNA molecule. A CCD camera is used to follow in real-time the motion of the tethered bead. The changes in DNA extension are recorded in real time by computer-assisted analysis of the bead image (adapted from [133]). B) Representative DNA unwinding trace of a single T4 helicase using magnetic tweezers. A DNA hairpin is tethered between the paramagnetic bead and the flow cell surface. At constant tension, the DNA unwinding activity of the helicase opens the hairpin, which results in an increase of the DNA molecule extension. Upon full unwinding, hairpin rezipping rate is limited by helicase translocation rate on ssDNA (adapted from [134]). C) Detection of the T4 primosome helicase and priming activities on DNA hairpins using magnetic tweezers. Experimental run showing: i) initial DNA unwinding rate by the T4 helicase (Vunwinding), ii) apparent decrease in the unwinding rate due to priming loop formation (Vpriming), and iii) sudden extension increase due to loop release upon primer synthesis by the primase (Loop size). After hairpin unwinding, rezipping is limited by helicase translocation on ssDNA (adapted from [135]).
Fig. 5
Fig. 5
smFRET detection of priming loop formation by the T7 replisome. A) Diagram showing a priming loop during the activity of a partially reconstituted T7 replisome. In T7, helicase and primase activities are carried out by the same polypeptide (gp4). During primer synthesis (red line), the excess DNA unwound by the helicase activity loops out allowing the primase-DNA interaction to stay intact as leading strand synthesis proceeds. Red A and green D, represent DNA bound acceptor and donor fluorophores, respectively, used to detect primosome activity. B) Schematic representation of fluorescently labelled DNA fork to investigate priming loop formation by smFRET. Red and green dots show the location of the acceptor and donor fluorophores, respectively, with respect to the priming sequence (pink). C) smFRET unwinding assays show: a) Before DNA unwinding the distance between the two fluorophores prevents FRET (bottom plot). b) As the T7 replisome unwinds the dsDNA, the donor shows an increase in intensity (green trace) due to protein-induced fluorescence enhancement. c) When the replisome reaches the priming sequence, the primase domain engages the lagging strand at this position causing the acceptor (red trace) to come close to the donor, as DNA unwinding continues. This event is detected as an increase in FRET. d) As the priming loop grows in size the donor and acceptor move apart, this was detected as a decrease in FRET. Adapted from . (For interpretation of the references to colour in this figure legend, the reader is referred to the web version of this article.)
Fig. 6
Fig. 6
Single-molecule TIRF assays to visualize leading- and lagging strand synthesis by the E.coli replisome. A) Schematic of a single-molecule TIRF microscope and flow-cell. TIRF microscopy use evanescent waves to excite only those molecules located within ~100 nm of the surface, substantially reducing the background fluorescence. B) Side-on view of the flow cell, showing surface-attached DNA, flow direction, the excitation beam (561 nm, green lines) and the evanescent wave range (green). C) Diagram of the rolling-circle assay to detect single-turnover replisome progressions. The template was adsorbed onto a cover-glass via biotin-streptavidin interaction. Upon assembly of a pre-initiation complex (BIND), replication was initiated (START) by introducing primase, clamp, SSB in the presence of all four dNTPs and rNTPs. D) dsDNA extension can be followed in real-time by stretching under flow (from left to right) in the presence of SYTOX Orange. The figure shows a representative field in which several circular template molecules (small foci at the start of reaction) are replicated to yield long products. F) Kymographs of three actively extending molecules (from D) showing the length of the replication product as a function of time. Bottom, linear fits to trajectories yield average rates of fork movement (magenta, cyan, and green traces). Adapted from . (For interpretation of the references to colour in this figure legend, the reader is referred to the web version of this article.)
Fig. 7
Fig. 7
Multicolor single-molecule TIRF assays to visualize simultaneously DNA synthesis and protein dynamics of the S. cerevisiae replisome. A) Schematic representation of the pre-assembly replication assay. A DNA molecule containing a premade replication fork at one end is attached at both ends to the surface of the flow cell of a TIRF microscope. Upon preassembly of the replisome, the flow cell is washed to remove the excess of DNApols and other replisome components and replication is initiated. B) Kymographs showing the advance of the replication fork and the stability and stoichiometry of eukaryotic DNApols. DNA was stained with SYTOX orange and Pol ε (blue), Pol δ (yellow), and Pol α-primase (green) were labeled fluorescently. As DNA synthesis proceeds, the leading strand appears as a diffraction-limited spot that moves along the template in one direction (left). All three DNA polymerases co-localize with the leading-strand spot during replication of thousands of nucleotides (center). This observation is consistent with a stable interaction of the DNApols with the replisome. The stoichiometry of each DNApol (right) was obtained by dividing the intensity at the fork by the intensity of a single polymerase. Adapted from . (For interpretation of the references to colour in this figure legend, the reader is referred to the web version of this article.)

Similar articles

Cited by

References

    1. Watson J.D., Crick F.H.C. Molecular Structure of Nucleic Acids: A Structure for Deoxyribose Nucleic Acid. Nature. 1953;171(4356):737–738. doi: 10.1038/171737a0. - DOI - PubMed
    1. Bessman M.J., Lehman I.R., Simms E.S., Kornberg A. Enzymatic synthesis of deoxyribonucleic acid. II. General properties of the reaction. The Journal of biological chemistry. 1958;233(1):171–177. Epub 1958/07/01. PubMed PMID: 13563463. - PubMed
    1. Lehman I.R., Bessman M.J., Simms E.S., Kornberg A. Enzymatic synthesis of deoxyribonucleic acid. I. Preparation of substrates and partial purification of an enzyme from Escherichia coli. The Journal of biological chemistry. 1958;233(1):163–170. - PubMed
    1. Meselson M., Stahl F.W. The replication of DNA in <em>Escherichia coli</em&gt. Proc Natl Acad Sci. 1958;44(7):671. doi: 10.1073/pnas.44.7.671. - DOI - PMC - PubMed
    1. Snedeker J., Wooten M., Chen X. The Inherent Asymmetry of DNA Replication. Annu Rev Cell Dev Biol. 2017;33:291–318. Epub 08/11. doi: 10.1146/annurev-cellbio-100616-060447. - PMC - PubMed

LinkOut - more resources