

How to assess the structural dynamics of transcription factors by integrating sparse NMR and EPR constraints with molecular dynamics simulations
- PMID: 33995905
- PMCID: PMC8085671
- DOI: 10.1016/j.csbj.2021.04.020
How to assess the structural dynamics of transcription factors by integrating sparse NMR and EPR constraints with molecular dynamics simulations
Abstract
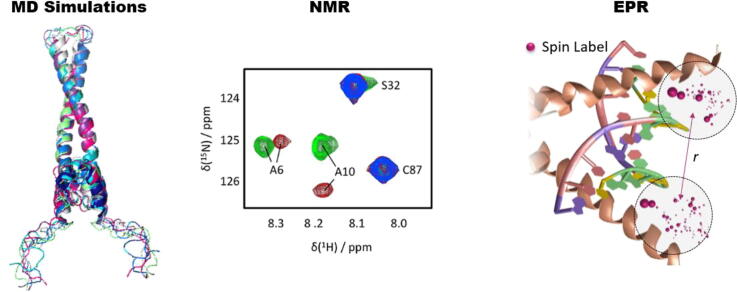
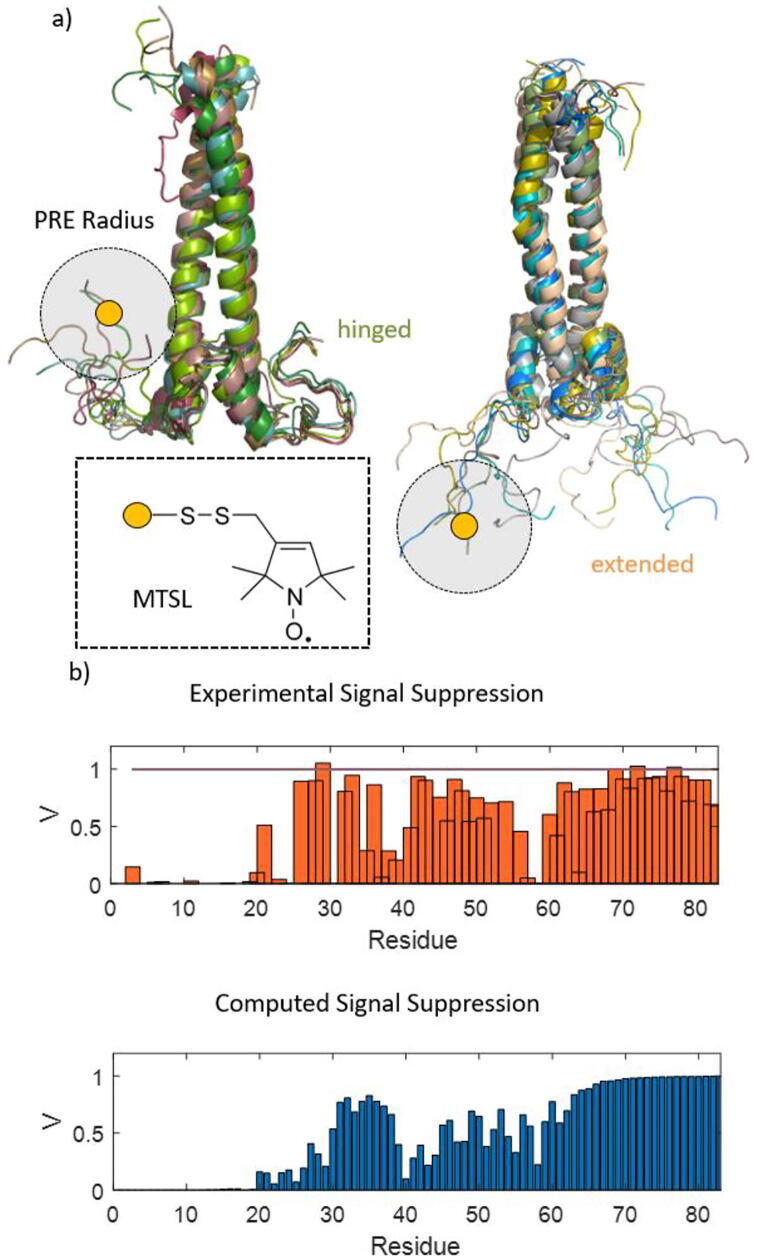
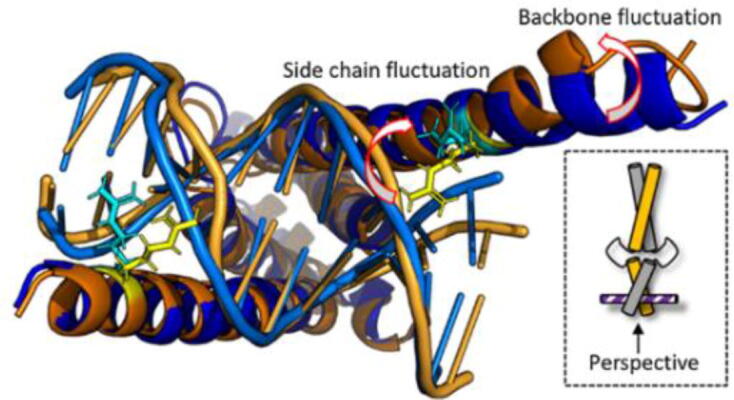
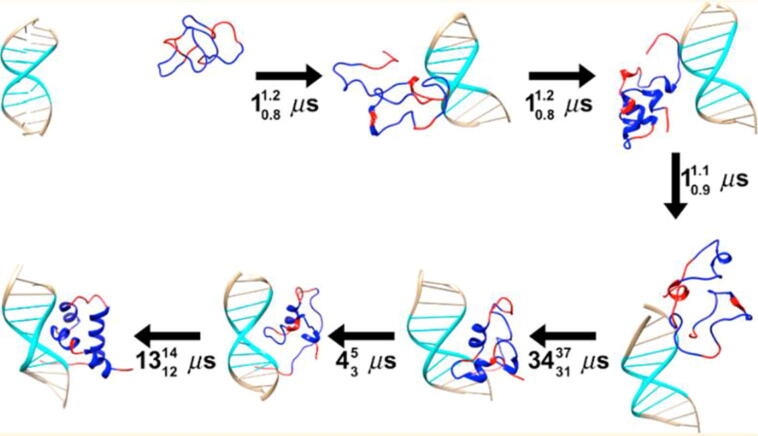
We review recent advances in modeling structural ensembles of transcription factors from nuclear magnetic resonance (NMR) and electron paramagnetic resonance (EPR) spectroscopic data, integrated with molecular dynamics (MD) simulations. We focus on approaches that confirm computed conformational ensembles by sparse constraints obtained from magnetic resonance. This combination enables the deduction of functional and structural protein models even if nuclear Overhauser effects (NOEs) are too scarce for conventional structure determination. We highlight recent insights into the folding-upon-DNA binding transitions of intrinsically disordered transcription factors that could be assessed using such integrative approaches.
Keywords: EPR; MD simulations; NMR; Structural dynamics; Transcription factors.
© 2021 The Author(s).
Conflict of interest statement
The authors declare that they have no known competing financial interests or personal relationships that could have appeared to influence the work reported in this paper.
Figures
Similar articles
-
Molecular Dynamics Simulations Combined with Nuclear Magnetic Resonance and/or Small-Angle X-ray Scattering Data for Characterizing Intrinsically Disordered Protein Conformational Ensembles.J Chem Inf Model. 2019 May 28;59(5):1743-1758. doi: 10.1021/acs.jcim.8b00928. Epub 2019 Mar 18. J Chem Inf Model. 2019. PMID: 30840442 Review.
-
A Switch between Two Intrinsically Disordered Conformational Ensembles Modulates the Active Site of a Basic-Helix-Loop-Helix Transcription Factor.J Phys Chem Lett. 2020 Nov 5;11(21):8944-8951. doi: 10.1021/acs.jpclett.0c02242. Epub 2020 Oct 8. J Phys Chem Lett. 2020. PMID: 33030907 Free PMC article.
-
NMR Spectroscopic Studies of the Conformational Ensembles of Intrinsically Disordered Proteins.Adv Exp Med Biol. 2015;870:149-85. doi: 10.1007/978-3-319-20164-1_5. Adv Exp Med Biol. 2015. PMID: 26387102 Review.
-
Integrating Electron Paramagnetic Resonance Spectroscopy and Computational Modeling to Measure Protein Structure and Dynamics.Chempluschem. 2024 Jan;89(1):e202300506. doi: 10.1002/cplu.202300506. Epub 2023 Oct 25. Chempluschem. 2024. PMID: 37801003 Review.
-
High-field EPR on membrane proteins - crossing the gap to NMR.Prog Nucl Magn Reson Spectrosc. 2013 Nov;75:1-49. doi: 10.1016/j.pnmrs.2013.07.002. Epub 2013 Jul 29. Prog Nucl Magn Reson Spectrosc. 2013. PMID: 24160760 Review.
Cited by
-
Optimization of Crystal Structures in Polylithionite Concentrate: A Molecular Dynamics Approach to Lithium Extraction Efficiency.Nanomaterials (Basel). 2024 Oct 27;14(21):1713. doi: 10.3390/nano14211713. Nanomaterials (Basel). 2024. PMID: 39513793 Free PMC article.
-
Recent advances in microresonators and supporting instrumentation for electron paramagnetic resonance spectroscopy.Rev Sci Instrum. 2022 Oct 1;93(10):101101. doi: 10.1063/5.0097853. Rev Sci Instrum. 2022. PMID: 36319314 Free PMC article.
-
Understanding Self-Assembly of Silica-Precipitating Peptides to Control Silica Particle Morphology.Adv Mater. 2023 Mar;35(11):e2207586. doi: 10.1002/adma.202207586. Epub 2023 Jan 25. Adv Mater. 2023. PMID: 36509953 Free PMC article.
-
Studying the Structures of Relaxed and Fuzzy Interactions: The Diverse World of S100 Complexes.Front Mol Biosci. 2021 Oct 11;8:749052. doi: 10.3389/fmolb.2021.749052. eCollection 2021. Front Mol Biosci. 2021. PMID: 34708078 Free PMC article. Review.
References
-
- Abragam A. Oxford University Press; 1961. Principles of Nuclear Magnetism.
-
- Schmidt-Rohr K., Spiess H.W. Academic Press; 1994. Multidimensional Solid-State NMR and Polymers.
-
- Ernst R.R., Bodenhausen G., Wokaun A. Claredon Press; Oxford: 1986. Principles of Nuclear Magnetic Resonance in One and Two Dimensions.
-
- Nilges M. Structure Calculation from NMR Data. Curr Opin Struct Biol 1996;6:617–23. https://doi.org/10.1016/S0959-440X(96)80027-3. - PubMed
Publication types
LinkOut - more resources
Full Text Sources
Other Literature Sources