. 2021 Apr 21;8(4):201721.
doi: 10.1098/rsos.201721.

Communicating personalized risks from COVID-19: guidelines from an empirical study

Affiliations

Communicating personalized risks from COVID-19: guidelines from an empirical study

Alexandra L J Freeman et al. R Soc Open Sci. .

Abstract

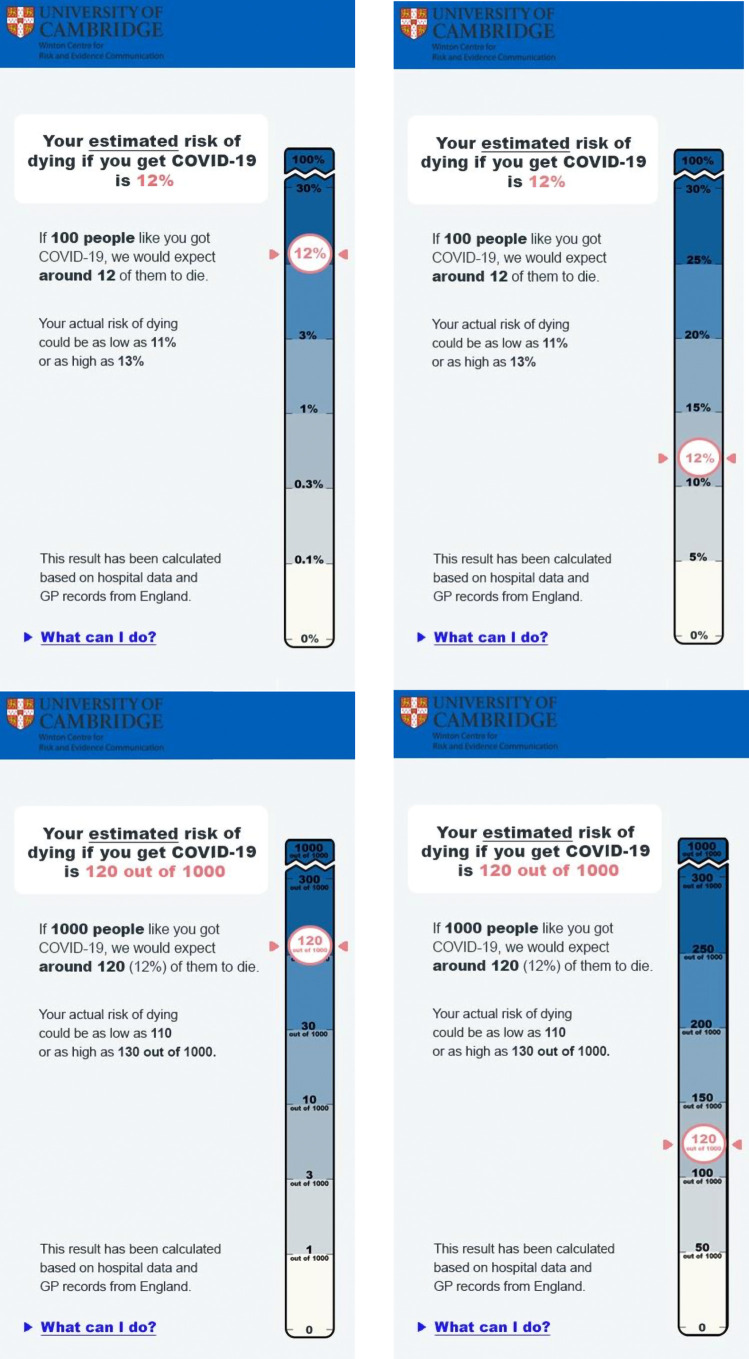
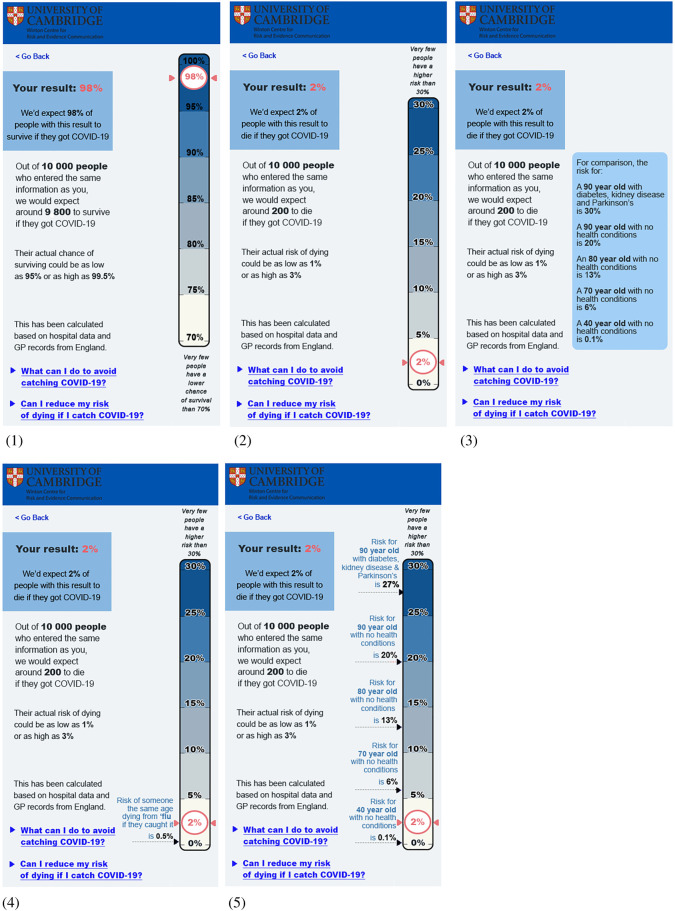
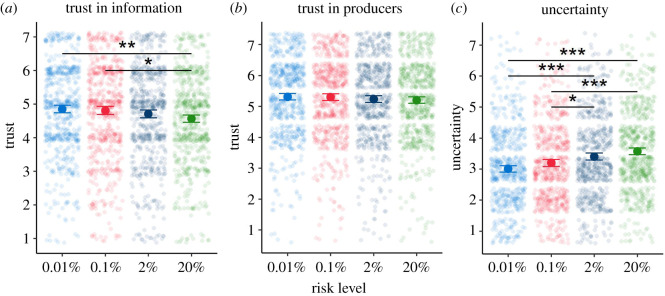
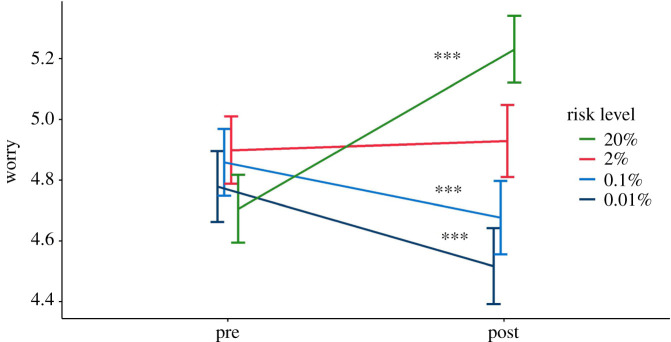
As increasing amounts of data accumulate on the effects of the novel coronavirus SARS-CoV-2 and the risk factors that lead to poor outcomes, it is possible to produce personalized estimates of the risks faced by groups of people with different characteristics. The challenge of how to communicate these then becomes apparent. Based on empirical work (total n = 5520, UK) supported by in-person interviews with the public and physicians, we make recommendations on the presentation of such information. These include: using predominantly percentages when communicating the absolute risk, but also providing, for balance, a format which conveys a contrasting (higher) perception of risk (expected frequency out of 10 000); using a visual linear scale cut at an appropriate point to illustrate the maximum risk, explained through an illustrative 'persona' who might face that highest level of risk; and providing context to the absolute risk through presenting a range of other 'personas' illustrating people who would face risks of a wide range of different levels. These 'personas' should have their major risk factors (age, existing health conditions) described. By contrast, giving people absolute likelihoods of other risks they face in an attempt to add context was considered less helpful. We note that observed effect sizes generally were small. However, even small effects are meaningful and relevant when scaled up to population levels.

Keywords: COVID-19; risk communication; risk perception.


Figures

Figure 1.
Figure 1.
The proportion of people answering 1–7 on a Likert scale ‘I think that people are entitled to know now what their personal risk of dying from COVID-19 would be if they were to catch it.’ (survey 1, n = 500).
Figure 2.
Figure 2.
Participants' rating on a 7-point Likert scale of how much they agreed or disagreed with the statement ‘If my doctor was going to tell me now my personal risk of dying from COVID-19 if I caught the virus, I would like to know that risk as a precise number, rather than as a category (e.g. low, medium, high)’—asked before people had seen any mock-up showing risk as an exact number (survey 1, n = 500).
Figure 3.
Figure 3.
The ratings of personal risk of participants (on a 1–9 Likert scale) against their approximate actual risk (presented as ‘COVID-AGE’) as calculated approximately by the algorithm by Coggon et al. [9] as a means of assessing the degree to which people's assessments of their risk from COVID-19 correlate with their actual risk (survey 1, n = 500).
Figure 4.
Figure 4.
The three formats tested in Experiment 2.2: each shows a 2% risk on a logarithmic scale. One shows no additional contextual information, one shows the comparative risks of ‘average’ people of different ages, and one attempts to illustrate the proportion of the UK population that experiences each level of risk. Please note, the risks illustrated on these visualisations are all fictional (including the age comparators) this was made clear to participants. Please take care not to reproduce these visualisations in contexts where they may be taken as genuine.
Figure 5.
Figure 5.
Means (a) (95% CI) and distributions (b) of ratings (‘very low risk’ (0) to ‘very high risk’ (100)) of five different risk levels presented as a percentage or frequency (out of 1000), with or without additional information. Asterisks indicate a significant difference between per cent and frequency formats, *p < 0.05, **p < 0.01, ***p < 0.001 (survey 2, n = 700).
Figure 6.
Figure 6.
(ac) Mean (95% CI) participant ratings of the three formats shown in figure 4 (risk result shown alongside: no additional information (control), average risk for different ages (age) or risk distribution for UK population (population). ‘Violin’ plots indicate underlying distribution. Horizontal bars indicate significant difference between conditions, *p < 0.05, ***p < 0.001 (survey 2, n = 700).
Figure 7.
Figure 7.
A 12% risk shown on a log or linear scale, in percentages or frequencies. Participants in Experiment 3.1 were randomized to see either a 12% or a 0.1% risk in one of these four formats.
Figure 8.
Figure 8.
The proportion of people answering 1–7 on a Likert scale ‘I would not like to see information like this about my own risks from COVID-19’. Results from surveys 2 and 3 combined (n = 2520).
Figure 9.
Figure 9.
Participants' ranking of the importance of different pieces of information in a hypothetical personal COVID-19 risk communication tool. Triangle indicates mean. From surveys 2 and 3 combined (n = 2520).
Figure 10.
Figure 10.
Mean risk perception (a), worry (b), subjective comprehension (c) and trust (d) among participants responding to a high (12%) risk result presented as either a frequency or percentage with either a linear or logarithmic scale. Error bars show 95% confidence intervals. ‘Violin’ plots represent underlying data distribution. Asterisks denote significant difference between frequency and per cent groups (no significant difference between scale formats) (survey 3, n = 1820).
Figure 11.
Figure 11.
Visualization formats shown to participants in Experiment 4.1 (2% risk level category only). (1) positive framing, visual scale, no comparators; (2) negative framing, visual scale, no comparators; (3) negative framing, text only, age risks as comparators; (4) negative framing, visual scale, ‘flu risk as comparator; (5) negative framing, visual scale, age risks as comparators. Planned contrasts were pre-registered between the following pairs of formats: (1, 2), (3, 5), (1, 3), (1, 4), (1, 5), for each dependent variable: risk perception, worry, communication efficacy and concern about higher-risk behaviours. Please note, the risks illustrated on these visualisations are all fictional (including the age comparators) this was made clear to participants. Please take care not to reproduce these visualisations in contexts where they may be taken as genuine.
Figure 12.
Figure 12.
Participants' rating on a 7-point Likert scale of how much they agreed or disagreed with the statement that a personal risk communication tool ‘should just tell people whether their risk is high or low’—asked after people had seen a mock-up of potential outputs giving an exact risk score (survey 4, n = 2500).
Figure 13.
Figure 13.
Mean (95% CI) estimates of different personas' risk of dying if infected with COVID-19. Participants provided their estimate as either a percentage, or a frequency out of 100 (x in 100) or 1000 (x in 1000); converted to percentage for comparison. Violin plots indicate underlying distribution. For each persona, all mean estimates differed significantly from each other by response format (p < 0.01) (survey 4, n = 2500).
Figure 14.
Figure 14.
Mean (95% CI) ratings (from ‘very low risk’ (0) to ‘very high risk’ (100)) of five different COVID-19 infection fatality risk figures, presented as either a percentage or as one of three frequency formats. Violin plots indicate underlying distribution. Dotted lines indicate a non-significant difference between means, all other pairwise comparisons were significant at p < 0.05 (survey 4, n = 2500).
Figure 15.
Figure 15.
Mean (95% CI) actionability ratings for the five formats tested in Experiment 4.3. Violin plots indicate underlying distribution (survey 4, n = 2500).
Figure 16.
Figure 16.
Mean (95% CI) ratings of trust in the information (a), trust in the producers of the information (b) and perceived uncertainty (c) (collapsed across all five formats tested in Experiment 4.3) for each of the four risk levels indicated. Jittered points indicate underlying distribution. Horizontal bars indicate significant difference between conditions, *p < 0.05, **p < 0.01,***p < 0.001 (survey 4, n = 2500).
Figure 17.
Figure 17.
Mean (95% CI) ratings of the perceived uncertainty of the information presented in a positively framed and a negatively framed mock-up. Jittered points indicate underlying distribution (survey 4, n = 891).
Figure 18.
Figure 18.
Percentage of participants in each condition correctly reporting the (a) percentage and (b) frequency presented in the information provided.
Figure 19.
Figure 19.
Distribution of participants' ratings of how worried they would be (on a 7-point Likert scale) to carry out each kind of behaviour because of the risk of catching or passing on coronavirus (UK participants, July 2020, asked before having seen any risk information about the virus) (survey 4, n = 2500).
Figure 20.
Figure 20.
Mean actual worry before (pre) and hypothetical worry after (post) receiving risk result. Error bars represent 95% CI. Asterisks indicate a significant difference between pre and post means. ***p < 0.001 (survey 4, n = 2500).
Figure 21.
Figure 21.
Participants' preferences across the five presentation formats tested in Experiment 4.3 when shown all five and asked to rank them (survey 4, n = 2500).

References

    1. Slovic P, Fischoff B, Lichtenstein S. 1981. Perceived risk: psychological factors and social implications. Proc. R. Soc. Lond. A 376, 17-34. (10.1098/rspa.1981.0073) - DOI
    1. Fischhoff B, Slovic P, Lichtenstein S, Read S, Combs B. 1978. How safe is safe enough? A psychometric study of attitudes towards technological risks and benefits. Policy Sci. 9, 127-152. (10.1007/BF00143739) - DOI
    1. Leppin A, Aro AR. 2009. Risk perceptions related to SARS and avian influenza: theoretical foundations of current empirical research. Int. J. Behav. Med. 16, 7-29. (10.1007/s12529-008-9002-8) - DOI - PMC - PubMed
    1. Bish A, Michie S. 2010. Demographic and attitudinal determinants of protective behaviours during a pandemic: a review. Br. J. Health Psychol. 15, 797-824. (10.1348/135910710X485826) - DOI - PMC - PubMed
    1. Dryhurst S, Schneider CR, Kerr J, Freeman ALJ, Recchia G, van der Bles AM, Spiegelhalter D, van der Linden S. 2020. Risk perceptions of COVID-19 around the world. J. Risk Res. 23, 1466-4461. (10.1080/13669877.2020.1758193) - DOI

LinkOut - more resources