. 2021 Mar 8;12(4):1905-1921.
doi: 10.1364/BOE.417357. eCollection 2021 Apr 1.

Accuracy of homogeneous models for photon diffusion in estimating neonatal cerebral hemodynamics by TD-NIRS

Affiliations

Accuracy of homogeneous models for photon diffusion in estimating neonatal cerebral hemodynamics by TD-NIRS

Caterina Amendola et al. Biomed Opt Express. .

Abstract

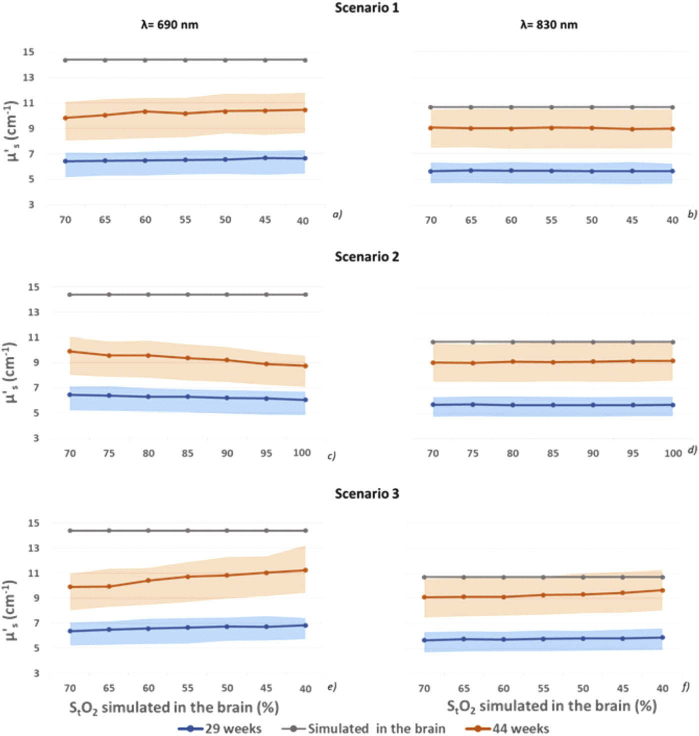
We assessed the accuracy of homogenous (semi-infinite, spherical) photon diffusion models in estimating absolute hemodynamic parameters of the neonatal brain in realistic scenarios (ischemia, hyperoxygenation, and hypoventilation) from 1.5 cm interfiber distance TD NIRS measurements. Time-point-spread-functions in 29- and 44-weeks postmenstrual age head meshes were simulated by the Monte Carlo method, convoluted with a real instrument response function, and then fitted with photon diffusion models. The results show good accuracy in retrieving brain oxygen saturation, and severe underestimation of total cerebral hemoglobin, suggesting the need for more complex models of analysis or of larger interfiber distances to precisely monitor all hemodynamic parameters.


Conflict of interest statement

The authors declare that there are no conflicts of interest related to this article.

Figures

Fig. 1.
Fig. 1.
2D Image of 44 (a, c) and 29 (b, d) weeks PMA meshes, divided in three domains: ECT (in blue), CSF (green) and brain (yellow). Figure a) and b) show coronal view in the plane identified by Cz (in the 10–20 International EEG system electrode placement), figure c) and d) show axial view in the plane at the middle between injection and detection points.
Fig. 2.
Fig. 2.
2D projection of source (red arrow) and detection (green arrow) position along the scalp surface. Detection is positioned in the AFp7 of the 10–20 International system of EEG electrode placement, the source 15 mm away along scalp surface.
Fig. 3.
Fig. 3.
IRF of the BabyLux device at 690 nm (panel a), and 830 nm (panel b).
Fig. 4.
Fig. 4.
Reduced scattering coefficient estimated for 29 (blue curve) and 44 (red curve) weeks PMA meshes with the semi-infinite homogeneous model. The gray curve represents the nominal values. The shadows represent the range of reduced scattering variations (maximum and minimum values) due to inter-subject variability. Left column and right column represent the values estimated at 690 nm and 830 nm, respectively. Top row represents the scenario 1, middle row scenario 2, and bottom row scenario 3 in Table 2.
Fig. 5.
Fig. 5.
tHb (left column) and StO2 (right column) estimated for 29 (blue curve) and 44 (red curve) weeks PMA meshes with the semi-infinite homogeneous mode for scenario 1 (top row), scenario 2 (middle row), and scenario 3 (bottom row) of Table 2. The gray curve in each panel represents the nominal values. The shadows represent the range of variations (maximum and minimum values reached) due to inter-subject variability of optical parameters.
Fig. 6.
Fig. 6.
Reduced scattering coefficient estimated for 29 (blue curve) and 44 (red curve) weeks PMA meshes with the spherical homogeneous model. The gray curve represents the nominal values. The shadows represent the range of reduced scattering variations (maximum and minimum values) due to inter-subject variability. Left column and right column represent the values estimated at 690 nm and 830 nm, respectively. Top row represents the scenario 1, middle row scenario 2, and bottom row scenario 3 of Table 2.
Fig. 7.
Fig. 7.
tHb (left column) and StO2 (right column) estimated for 29 (blue curve) and 44 (red curve) weeks PMA meshes with the spherical homogeneous mode for scenario 1 (top row), scenario 2 (middle row), and scenario 3 (bottom row). The gray curve in each panel represents the nominal values. The shadows represent the range of variations (maximum and minimum values reached) due to inter-subject variability of optical parameters.

References

    1. Perlman J. M., Mcmenamin J. B., Volpe J. J., “Fluctuating cerebral blood-flow velocity in respiratory-distress syndrome: relation to the development of intraventricular hemorrhage,” N. Engl. J. Med. 309(4), 204–209 (1983).10.1056/NEJM198307283090402 - DOI - PubMed
    1. Hatzidaki E., Giahnakis E., Maraka S., Korakaki E., Manoura A., Saitakis E., Papamastoraki I., Margari K. M., Giannakopoulou C., “Risk factors for periventricular leukomalacia,” Acta Obstet. Gynecol. Scand. 88(1), 110–115 (2009).10.1080/00016340802503039 - DOI - PubMed
    1. Miall-Allen V. M., De Vries L. S., Whitelaw A. G. L., “Mean arterial blood pressure and neonatal cerebral lesions,” Arch. Dis. Child. 62(10), 1068–1069 (1987).10.1136/adc.62.10.1068 - DOI - PMC - PubMed
    1. Lou H. C., “Perinatal hypoxic-ischemic brain damage and intraventricular hemorrhage: a pathogenetic model,” Arch. Neurol. 37(9), 585–587 (1980).10.1001/archneur.1980.00500580081017 - DOI - PubMed
    1. Rhee C. J., da Costa C. S., Austin T., Brady K. M., Czosnyka M., Lee J. K., “Neonatal cerebrovascular autoregulation,” Pediatr. Res. 84(5), 602–610 (2018).10.1038/s41390-018-0141-6 - DOI - PMC - PubMed