. 2021 Mar 15;12(4):2054-2063.
doi: 10.1364/BOE.420679. eCollection 2021 Apr 1.

Photoacoustic dual-scan mammoscope: results from 38 patients

Affiliations

Photoacoustic dual-scan mammoscope: results from 38 patients

Nikhila Nyayapathi et al. Biomed Opt Express. .

Abstract

We have developed a photoacoustics-based imaging system, the dual-scan mammoscope (DSM), that combines optical contrasts with acoustic detection, to obtain the angiographic features in human breast. In this study, we investigated whether the system can differentiate malignant tumor and healthy breast. We have imaged 38 patients with various tumor types and compared results of tumor-bearing breast with healthy breast for each patient. We also compared the photoacoustic and ultrasound imaging results with clinical US. Vascular features in and around the tumor mass were visualized. We found that tumor-bearing breast contained vessels of larger caliber and exhibited stronger variations in the background signals than those in the contralateral healthy breasts. Preliminary data on photoacoustic and ultrasound images also indicate that the technique has potential in differentiating different tumor types. Overall, our results indicate that combining photoacoustic and ultrasound images can improve breast cancer screening.


Conflict of interest statement

The authors declare no competing interests. Dr. Jun Xia is the founder of Sonioptix, LLC, which, however, did not support this work.

Figures

Fig. 1.
Fig. 1.
Schematic of Dual-scan Mammoscope. The scan-head (one on top and one on bottom) consists of a line fiber output and a 128-element linear array transducer. Dichroic mirrors were used to ensure coplanar illumination and acoustic detection.
Fig. 2.
Fig. 2.
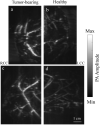
Maximum amplitude project (MAP) images of PA results for statistical analysis plotted in craniocaudal (CC) view. (a, c) Tumor-bearing breasts, (b, d) healthy breasts. Data from the same patient (images in the same row) was plotted using the same color scale. PA vascular features in tumor-bearing breast exhibit stronger signal intensity.
Fig. 3.
Fig. 3.
50-year-old patient with invasive ductal carcinoma, SBR grade II with scattered fibroglandular breast density. The tumor mass is marked with an asterisk in all figures. (a) Clinical ultrasound image shows the tumor mass. (b) Grayscale US acquired from DSM. PA features are shown in color scale as they represent the hemoglobin map in the breast: stronger PA amplitudes indicate a higher concentration of hemoglobin. The PA features can be added to the morphological features from US. Most PA features are concentrated at the periphery of the tumor. The ultrasound image in (a) was sized to share the same scale bar in (b).
Fig. 4.
Fig. 4.
49-year-old patient with infiltrating ductal carcinoma, with scattered fibroglandular breast density. The tumor is marked with an asterisk in all figures. (a) Clinical ultrasound image shows the tumor mass. (b) Grayscale US acquired from DSM. PA features (color scale) represent the hemoglobin map in the breast, which can be added to the morphological features from US. Most PA features are present inside the tumor region. The ultrasound image in (a) was sized to share the same scale bar in (b).
Fig. 5.
Fig. 5.
62-year-old patient with infiltrating ductal carcinoma, with scattered fibroglandular breast density. The tumor is marked with an asterisk in all figures. (a) Clinical ultrasound image shows the tumor mass. (b) Grayscale US acquired from DSM. PA features (color scale) represent the hemoglobin map in the breast, which can be added to the morphological features from US. PA features can be found in and around the tumor region. The tumor is identified based on the morphological features indicated by white arrows. The ultrasound image in (a) was sized to share the same scale bar in (b).
Fig. 6.
Fig. 6.
Reconstructed PA images (top row) are compared with corresponding X-ray mammography results (bottom row) for different breast densities. (a, d) Extremely dense (b, e) Heterogeneously dense (c, f) Scattered fibroglandular tissue.

References

    1. Tirona M. T., Sehgal R., Ballester O., “Prevention of breast cancer (part I): epidemiology, risk factors, and risk assessment tools,” Cancer Invest. 28(7), 743–750 (2010).10.3109/07357907.2010.494321 - DOI - PubMed
    1. Burton R., Bell R., “The global challenge of reducing breast cancer mortality,” The Oncologist 18(S2), 3–5 (2013).10.1634/theoncologist.18-S2-3 - DOI - PubMed
    1. Nothacker M., Duda V., Hahn M., Warm M., Degenhardt F., Madjar H., Weinbrenner S., Albert U.-S., “Early detection of breast cancer: benefits and risks of supplemental breast ultrasound in asymptomatic women with mammographically dense breast tissue. A systematic review,” BMC Cancer 9(1), 335 (2009).10.1186/1471-2407-9-335 - DOI - PMC - PubMed
    1. Freer P. E., “Mammography Breast Density: Impact On Breast Cancer Risk And Implications For Screening,” J. Cancer Res. Therapeutics 35(2), 302–315 (2015).10.1148/rg.352140106 - DOI - PubMed
    1. Pinsky R. W., Helvie M. A., “Mammographic breast density: effect on imaging and breast cancer risk,” J. Natl. Compr. Cancer Network 8(10), 1157–1165 (2010).10.6004/jnccn.2010.0085 - DOI - PubMed

LinkOut - more resources