

Multi-MHz MEMS-VCSEL swept-source optical coherence tomography for endoscopic structural and angiographic imaging with miniaturized brushless motor probes
- PMID: 33996236
- PMCID: PMC8086463
- DOI: 10.1364/BOE.420394
Multi-MHz MEMS-VCSEL swept-source optical coherence tomography for endoscopic structural and angiographic imaging with miniaturized brushless motor probes
Abstract
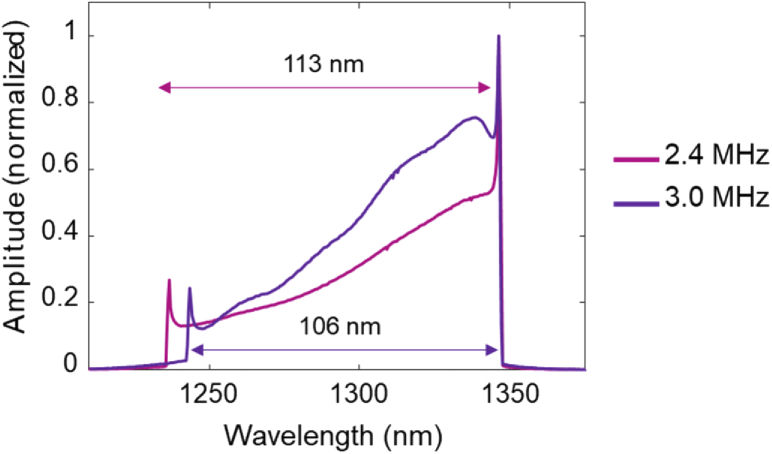
Swept source optical coherence tomography (SS-OCT) enables volumetric imaging of subsurface structure. However, applications requiring wide fields of view (FOV), rapid imaging, and higher resolutions have been challenging because multi-MHz axial scan (A-scan) rates are needed. We describe a microelectromechanical systems vertical cavity surface-emitting laser (MEMS-VCSEL) SS-OCT technology for A-scan rates of 2.4 and 3.0 MHz. Sweep to sweep calibration and resampling are performed using dual channel acquisition of the OCT signal and a Mach Zehnder interferometer signal, overcoming inherent optical clock limitations and enabling higher performance. We demonstrate ultrahigh speed structural SS-OCT and OCT angiography (OCTA) imaging of the swine gastrointestinal tract using a suite of miniaturized brushless motor probes, including a 3.2 mm diameter micromotor OCT catheter, a 12 mm diameter tethered OCT capsule, and a 12 mm diameter widefield OCTA probe. MEMS-VCSELs promise to enable ultrahigh speed SS-OCT with a scalable, low cost, and manufacturable technology, suitable for a diverse range of imaging applications.
© 2021 Optical Society of America under the terms of the OSA Open Access Publishing Agreement.
Conflict of interest statement
The content is solely the responsibility of the authors and does not necessarily represent the official views of the NIH. BP: Thorlabs, Inc. (F, E, P), VJ: Praevium Research, Inc. (F, I, E, P, S), AC: Thorlabs, Inc. (F, I, E, P, S), CB: Praevium Research, Inc. (F, E, P)
Figures


Similar articles
-
High speed, long range, deep penetration swept source OCT for structural and angiographic imaging of the anterior eye.Sci Rep. 2022 Jan 19;12(1):992. doi: 10.1038/s41598-022-04784-0. Sci Rep. 2022. PMID: 35046423 Free PMC article.
-
Ultrahigh speed endoscopic optical coherence tomography for gastroenterology.Biomed Opt Express. 2014 Nov 24;5(12):4387-404. doi: 10.1364/BOE.5.004387. eCollection 2014 Dec 1. Biomed Opt Express. 2014. PMID: 25574446 Free PMC article.
-
Circumferential optical coherence tomography angiography imaging of the swine esophagus using a micromotor balloon catheter.Biomed Opt Express. 2016 Jul 5;7(8):2927-42. doi: 10.1364/BOE.7.002927. eCollection 2016 Aug 1. Biomed Opt Express. 2016. PMID: 27570688 Free PMC article.
-
Retinal applications of swept source optical coherence tomography (OCT) and optical coherence tomography angiography (OCTA).Prog Retin Eye Res. 2021 Sep;84:100951. doi: 10.1016/j.preteyeres.2021.100951. Epub 2021 Jan 28. Prog Retin Eye Res. 2021. PMID: 33516833 Review.
-
Advances in swept-source optical coherence tomography and optical coherence tomography angiography.Adv Ophthalmol Pract Res. 2022 Nov 25;3(2):67-79. doi: 10.1016/j.aopr.2022.10.005. eCollection 2023 May-Jun. Adv Ophthalmol Pract Res. 2022. PMID: 37846376 Free PMC article. Review.
Cited by
-
All-reflective tethered capsule endoscope for multimodal optical coherence tomography in the esophagus.J Biomed Opt. 2024 Sep;29(9):096003. doi: 10.1117/1.JBO.29.9.096003. Epub 2024 Sep 19. J Biomed Opt. 2024. PMID: 39301278 Free PMC article.
-
Fourier Domain Mode Locked Laser and Its Applications.Sensors (Basel). 2022 Apr 20;22(9):3145. doi: 10.3390/s22093145. Sensors (Basel). 2022. PMID: 35590839 Free PMC article. Review.
-
Reconstruction of Optical Coherence Tomography Images from Wavelength Space Using Deep Learning.Sensors (Basel). 2024 Dec 27;25(1):93. doi: 10.3390/s25010093. Sensors (Basel). 2024. PMID: 39796883 Free PMC article.
-
High-speed, long-range and wide-field OCT for in vivo 3D imaging of the oral cavity achieved by a 600 kHz swept source laser.Biomed Opt Express. 2024 Jun 27;15(7):4365-4380. doi: 10.1364/BOE.528287. eCollection 2024 Jul 1. Biomed Opt Express. 2024. PMID: 39022551 Free PMC article.
-
Optical method to preserve residual hearing in patients receiving a cochlear implant.Front Audiol Otol. 2024;2:1376699. doi: 10.3389/fauot.2024.1376699. Epub 2024 Apr 15. Front Audiol Otol. 2024. PMID: 40791787 Free PMC article.
References
-
- Grulkowski I., Liu J. J., Potsaid B., Jayaraman V., Lu C. D., Jiang J., Cable A. E., Duker J. S., Fujimoto J. G., “Retinal, anterior segment and full eye imaging using ultrahigh speed swept source OCT with vertical-cavity surface emitting lasers,” Biomed. Opt. Express 3(11), 2733 (2012).10.1364/BOE.3.002733 - DOI - PMC - PubMed
-
- Wang T., Pfeiffer T., Regar E., Wieser W., van Beusekom H., Lancee C. T., Springeling G., Krabbendam I., van der Steen A. F. W., Huber R., van Soest G., “Heartbeat OCT: in vivo intravascular megahertz-optical coherence tomography,” Biomed. Opt. Express 6(12), 5021 (2015).10.1364/BOE.6.005021 - DOI - PMC - PubMed
Grants and funding
LinkOut - more resources
Full Text Sources
Other Literature Sources