. 2021 Mar 30;12(4):2496-2507.
doi: 10.1364/BOE.421647. eCollection 2021 Apr 1.

Synchronously pumped Raman laser for simultaneous degenerate and nondegenerate two-photon microscopy

Affiliations

Synchronously pumped Raman laser for simultaneous degenerate and nondegenerate two-photon microscopy

Michael L Buttolph et al. Biomed Opt Express. .

Abstract

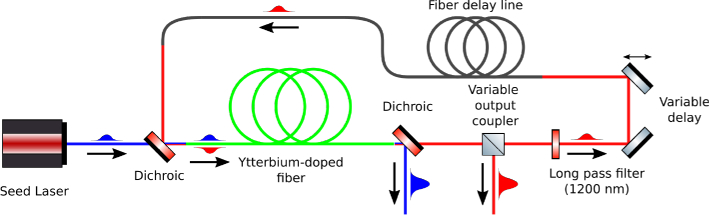
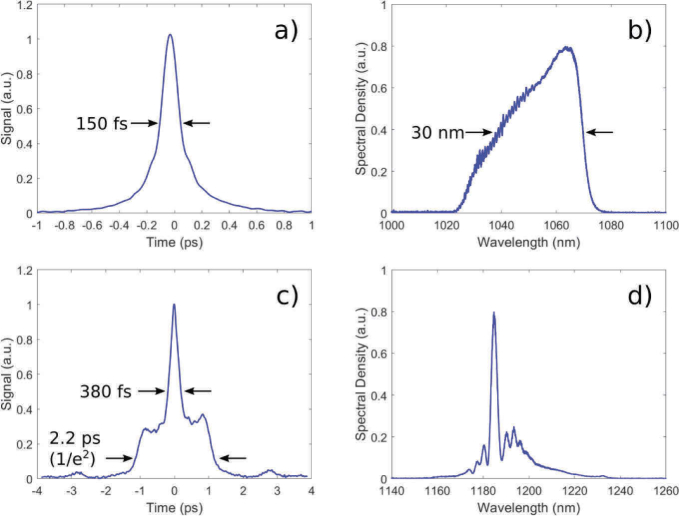
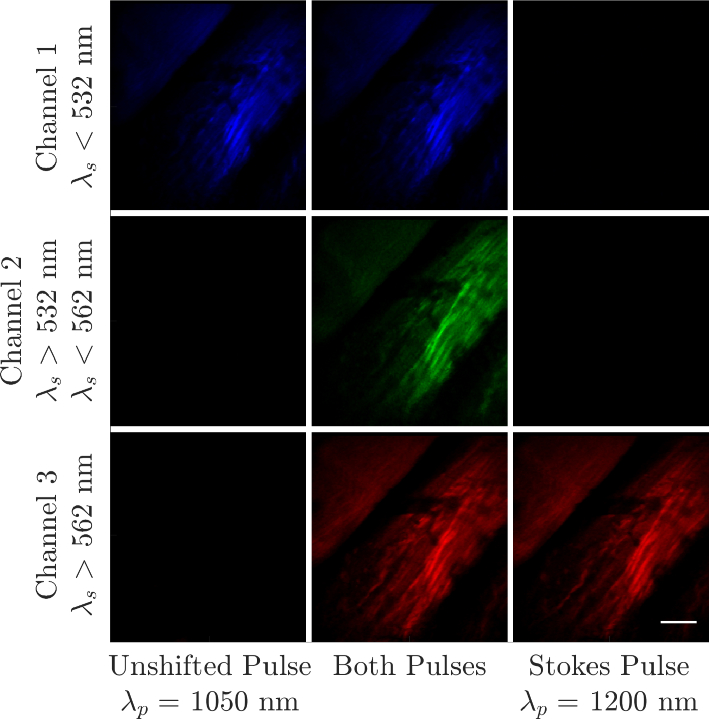
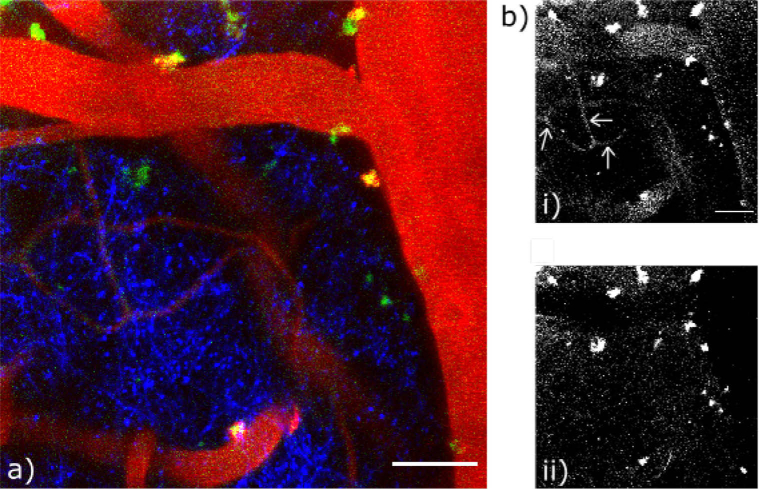
Two-photon fluorescence microscopy is a nonlinear imaging modality frequently used in deep-tissue imaging applications. A tunable-wavelength multicolor short-pulse source is usually required to excite fluorophores with a wide range of excitation wavelengths. This need is most typically met by solid-state lasers, which are bulky, expensive, and complicated systems. Here, we demonstrate a compact, robust fiber system that generates naturally synchronized femtosecond pulses at 1050 nm and 1200 nm by using a combination of gain-managed and Raman amplification. We image the brain of a mouse and view the blood vessels, neurons, and other cell-like structures using simultaneous degenerate and nondegenerate excitation.


Conflict of interest statement

The authors declare that there are no conflicts of interest related to this article.

Figures

Fig. 1.
Fig. 1.
Conceptual diagram of the synchronously-pumped Raman laser. The seed laser and ytterbium-doped fiber alone would constitute a gain-managed nonlinear amplifier, and the rest of the system provides positive feedback at wavelengths longer than 1200 nm.
Fig. 2.
Fig. 2.
Spectral evolution of the pulse in the ytterbium-doped fiber with (a) the Stokes feedback blocked and (c) the Stokes feedback engaged. The input and output spectra of the gain fiber with (b) the Stokes feedback blocked and (d) the Stokes feedback engaged.
Fig. 3.
Fig. 3.
Temporal characterization of the pulse evolution shown in Figs. 2(c) and 2(d). The top row (a-c) corresponds to the unshifted gain-managed pulse after a short-pass filter at 1070 nm is applied. The bottom row (d-f) corresponds to the Stokes pulse, without an additional filter applied. In the left column (a, d) is the temporal waveform compressed with group delay dispersion, assuming 70% compressor efficiency. In the center (b, e) is the spectrum and on the right (c, f) is the spectrogram of the chirped pulse. Values in the plots are calculated at the full-width half-maximum.
Fig. 4.
Fig. 4.
Experimental (a) and numerical (b) spectra of the cavity outputs.
Fig. 5.
Fig. 5.
The intensity autocorrelations of the compressed and filtered unshifted pulse (a) and compressed Stokes pulse (c). The corresponding spectra are shown in (b) and (d) respectively. Values in the plots are calculated at the full-width half-maximum, unless otherwise noted.
Fig. 6.
Fig. 6.
A tiling of SHG images across different excitation conditions (columns, λp is the incident pulse wavelength) and detection spectral bands (rows, λs is the signal wavelength). Notably, the signal in the intermediate band is present only when the sample is illuminated by both beams – this signal is necessarily from sum harmonic generation. Scale bar: 50 μm.
Fig. 7.
Fig. 7.
(a) In vivo degenerate and non-degenerate 2PEF imaging in the brain of a live, anesthetized transgenic mouse with YFP-labeled dendrites (blue), Alexa 647 dextran-labeled blood vessels (red), and some cortical cells labeled by intracortical injection of CellTracker Red CMTPX (green). The image is a maximum projection of a linearly-unmixed image stack (30 μm thick) based on nine separate image stacks acquired using three emission channels and under two degenerate (e.g. gain-managed and Raman laser excitation, individually) and one non-degenerate (e.g. both pulses present) excitation condition. (b) Unmixed CellTracker images using (i) all excitation conditions or (ii) only the two degenerate excitation conditions. The arrows in panel (i) indicate labeled microvessels. Note that the CellTracker images in panel (b) are shown on a different contrast scale, with brighter features saturated, than these same images in Supplement 1. Scale bars: 50 μm.

Similar articles

Cited by

References

    1. Miller D. R., Jarrett J. W., Hassan A. M., Dunn A. K., “Deep tissue imaging with multiphoton fluorescence microscopy,” Curr. Opin. Biomed. Eng. 4, 32–39 (2017).10.1016/j.cobme.2017.09.004 - DOI - PMC - PubMed
    1. Rakhymzhan A., Leben R., Zimmermann H., Günther R., Mex P., Reismann D., Ulbricht C., Acs A., Brandt A. U., Lindquist R. L., Winkler T. H., Hauser A. E., Niesner R. A., “Synergistic strategy for multicolor two-photon microscopy: application to the analysis of germinal center reactions in vivo,” Sci. Rep. 7(1), 7101 (2017).10.1038/s41598-017-07165-0 - DOI - PMC - PubMed
    1. Ricard C., Debarbieux F. C., “Six-color intravital two-photon imaging of brain tumors and their dynamic microenvironment,” Front. Cell. Neurosci. 8, 57 (2014).10.3389/fncel.2014.00057 - DOI - PMC - PubMed
    1. Radosevich A. J., Bouchard M. B., Burgess S. A., Chen B. R., Hillman E. M. C., “Hyperspectral in vivo two-photon microscopy of intrinsic contrast,” Opt. Lett. 33(18), 2164 (2008).10.1364/OL.33.002164 - DOI - PMC - PubMed
    1. Orzekowsky-Schroeder R., Klinger A., Martensen B., Blessenohl M., Gebert A., Vogel A., Hüttmann G., “In vivo spectral imaging of different cell types in the small intestine by two-photon excited autofluorescence,” J. Biomed. Opt. 16(11), 116025 (2011).10.1117/1.3655587 - DOI - PubMed

LinkOut - more resources