

RNAi targeting heparin cofactor II promotes hemostasis in hemophilia A
- PMID: 33996250
- PMCID: PMC8093307
- DOI: 10.1016/j.omtn.2021.03.022
RNAi targeting heparin cofactor II promotes hemostasis in hemophilia A
Abstract
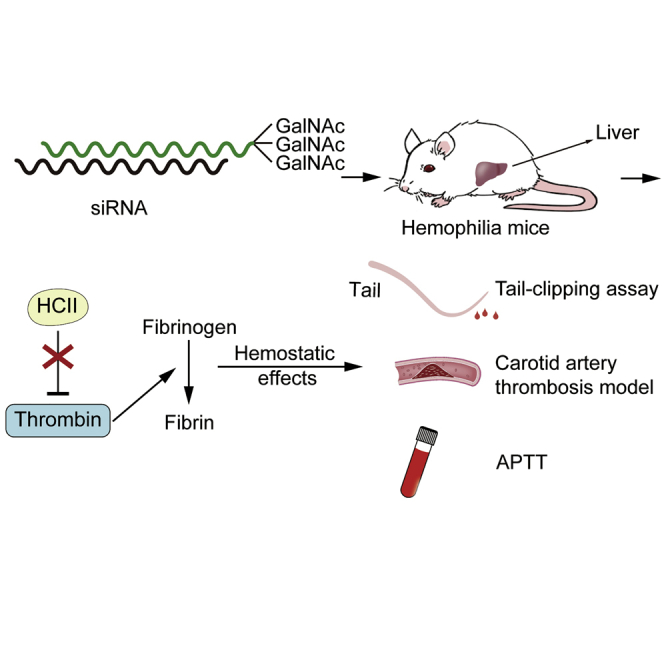
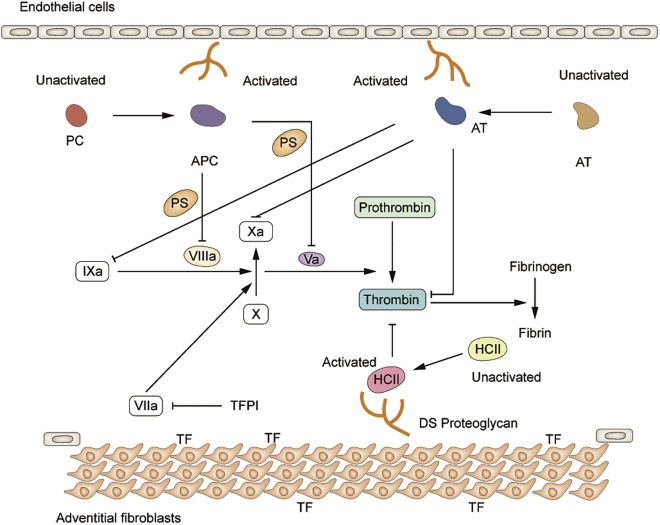
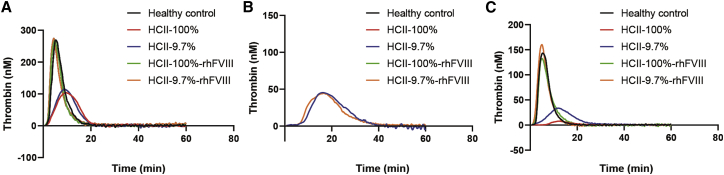
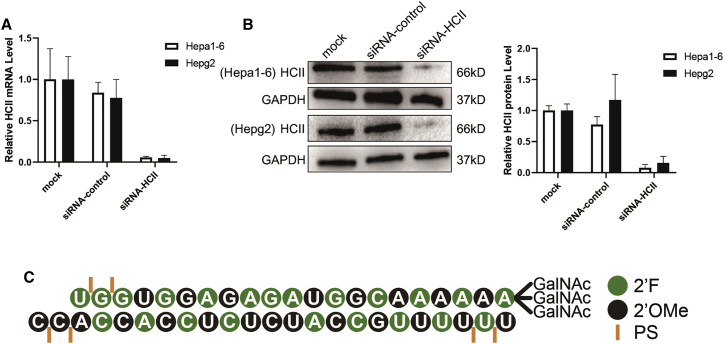
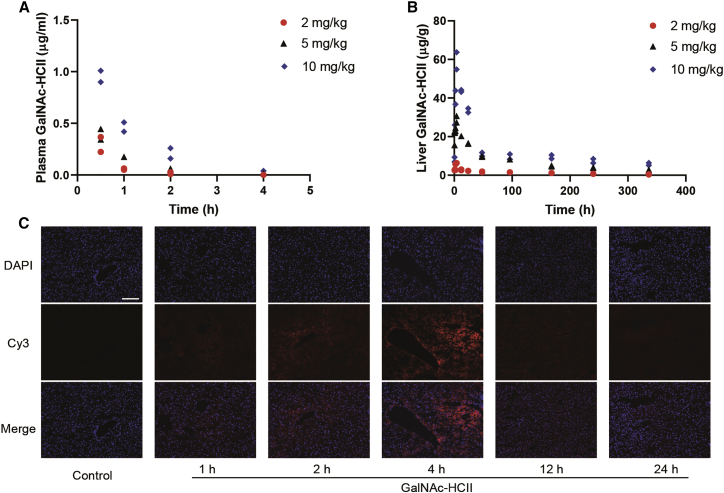
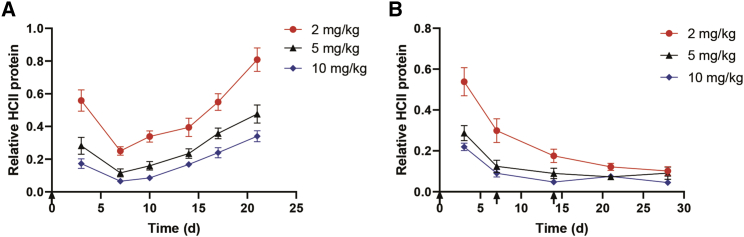
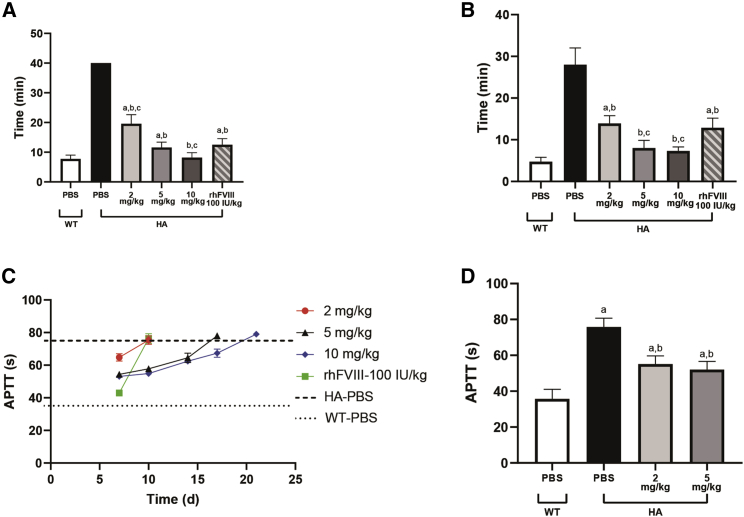
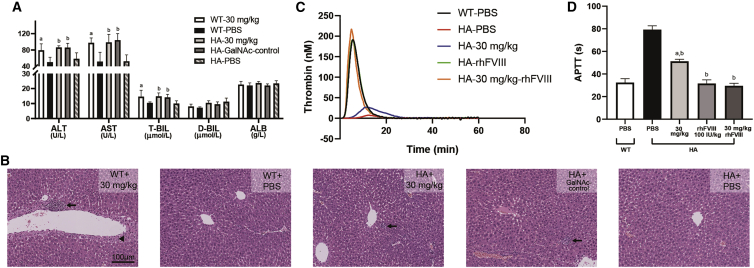
Hemophilia A is a hemorrhagic disease due to congenital deficiencies of coagulation factor VIII (FVIII). Studies show that hemophilia patients with anticoagulant deficiency present less severe hemorrhagic phenotypes. We aimed to find a new therapeutic option for hemophilia patients by RNA interference (RNAi) targeting heparin cofactor II (HCII), a critical anticoagulant protein inactivating the thrombin. The optimal small interfering RNA (siRNA) was conjugated to an asialoglycoprotein receptor ligand (N-acetylgalactosamine [GalNAc]-HCII), promoting targeted delivery to the liver. After administration, GalNAc-HCII demonstrated effective, dose-dependent, and persistent HCII inhibition. After 7 days, in normal mice, GalNAc-HCII reduced HCII levels to 25.04% ± 2.56%, 11.65% ± 2.41%, and 6.50% ± 1.73% with 2, 5, and 10 mg/kg GalNAc-HCII, respectively. The hemostatic ability of hemophilia mice in the GalNAc-HCII-treated group significantly improved, with low thrombus formation time in the carotid artery thrombosis models and short bleeding time in the tail-clipping assays. After repeated administration, the prolonged activated partial thromboplastin time (APTT) was reduced. A 30 mg/kg dose did not cause pathological thrombosis. Our study confirmed that GalNAc-HCII therapy is effective for treating hemophilia mice and can be considered a new option for treating hemophilia patients.
Keywords: RNA interference; hemophilia; hemostasis; heparin cofactor II; thrombin.
© 2021 The Authors.
Conflict of interest statement
The authors declare no competing interests.
Figures
Similar articles
-
RNAi targeting heparin cofactor II promotes hemostasis in a canine model of acquired hemophilia A.Gene Ther. 2025 Jul;32(4):398-409. doi: 10.1038/s41434-025-00541-w. Epub 2025 May 24. Gene Ther. 2025. PMID: 40413293
-
RNAi targeting LMAN1-MCFD2 complex promotes anticoagulation in mice.J Thromb Thrombolysis. 2024 Dec;57(8):1349-1362. doi: 10.1007/s11239-024-03034-6. Epub 2024 Sep 2. J Thromb Thrombolysis. 2024. PMID: 39222205 Free PMC article.
-
Depolymerized holothurian glycosaminoglycan with novel anticoagulant actions: antithrombin III- and heparin cofactor II-independent inhibition of factor X activation by factor IXa-factor VIIIa complex and heparin cofactor II-dependent inhibition of thrombin.Blood. 1995 Mar 15;85(6):1527-34. Blood. 1995. PMID: 7888673
-
Heparin cofactor II as a novel vascular protective factor against atherosclerosis.J Atheroscler Thromb. 2009 Oct;16(5):523-31. doi: 10.5551/jat.1552. Epub 2009 Sep 3. J Atheroscler Thromb. 2009. PMID: 19729870 Review.
-
Heparin cofactor II attenuates vascular remodeling in humans and mice.Circ J. 2010 Aug;74(8):1518-23. doi: 10.1253/circj.cj-10-0577. Epub 2010 Jul 17. Circ J. 2010. PMID: 20671370 Review.
Cited by
-
Innovations in RNA therapy for hemophilia.Blood. 2023 Nov 9;142(19):1613-1621. doi: 10.1182/blood.2022018661. Blood. 2023. PMID: 37478403 Free PMC article. Review.
-
Targeting and monitoring ovarian cancer invasion with an RNAi and peptide delivery system.Proc Natl Acad Sci U S A. 2024 Mar 12;121(11):e2307802121. doi: 10.1073/pnas.2307802121. Epub 2024 Mar 4. Proc Natl Acad Sci U S A. 2024. PMID: 38437557 Free PMC article.
-
Cadmium Exposure Disrupts Uterine Energy Metabolism and Coagulation Homeostasis During Labor in Institute of Cancer Research Mice: Insights from Transcriptomic Analysis.Metabolites. 2025 May 20;15(5):339. doi: 10.3390/metabo15050339. Metabolites. 2025. PMID: 40422915 Free PMC article.
-
RNAi targeting heparin cofactor II promotes hemostasis in a canine model of acquired hemophilia A.Gene Ther. 2025 Jul;32(4):398-409. doi: 10.1038/s41434-025-00541-w. Epub 2025 May 24. Gene Ther. 2025. PMID: 40413293
-
RNAi for the Treatment of People with Hemophilia: Current Evidence and Patient Selection.J Blood Med. 2023 Apr 22;14:317-327. doi: 10.2147/JBM.S390521. eCollection 2023. J Blood Med. 2023. PMID: 37123985 Free PMC article. Review.
References
-
- Peyvandi F., Garagiola I., Young G. The past and future of haemophilia: diagnosis, treatments, and its complications. Lancet. 2016;388:187–197. - PubMed
-
- Schep S.J., Schutgens R.E.G., Fischer K., Boes M.L. Review of immune tolerance induction in hemophilia A. Blood Rev. 2018;32:326–338. - PubMed
-
- Weyand A.C., Pipe S.W. New therapies for hemophilia. Blood. 2019;133:389–398. - PubMed
-
- Swystun L.L., Lillicrap D. Gene Therapy for Coagulation Disorders. Circ. Res. 2016;118:1443–1452. - PubMed
LinkOut - more resources
Full Text Sources
Other Literature Sources
