

Alternative splicing perturbation landscape identifies RNA binding proteins as potential therapeutic targets in cancer
- PMID: 33996260
- PMCID: PMC8099609
- DOI: 10.1016/j.omtn.2021.04.005
Alternative splicing perturbation landscape identifies RNA binding proteins as potential therapeutic targets in cancer
Abstract
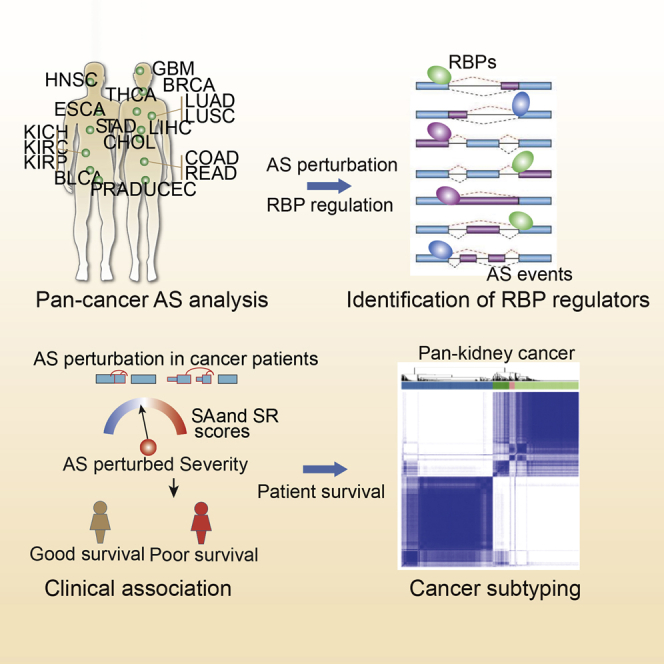
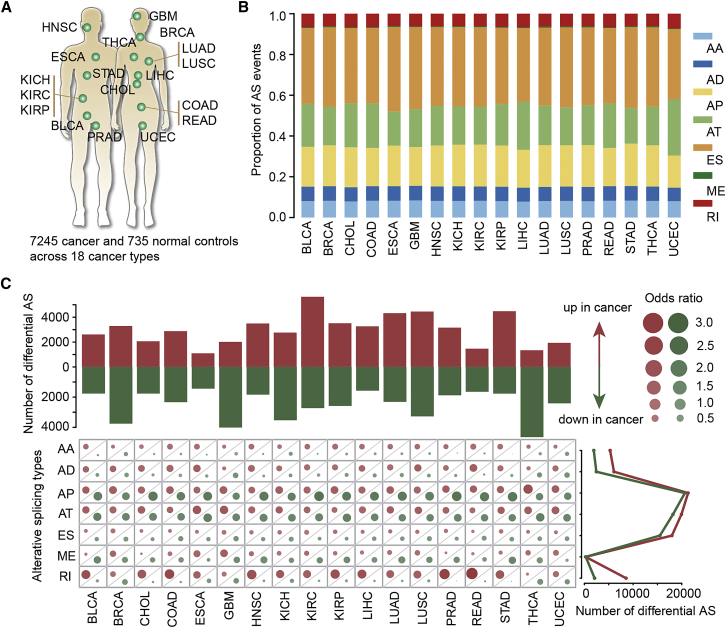
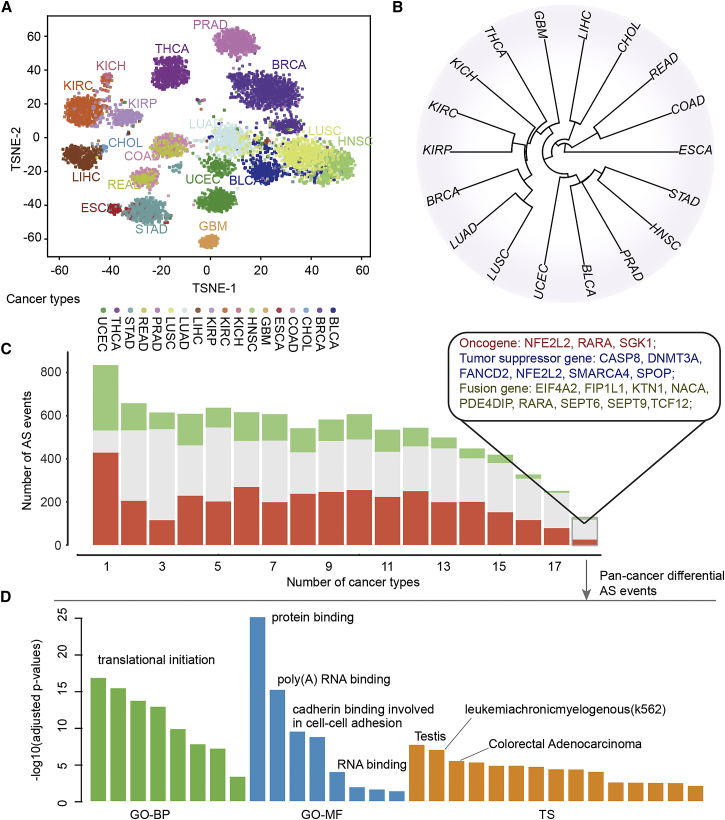
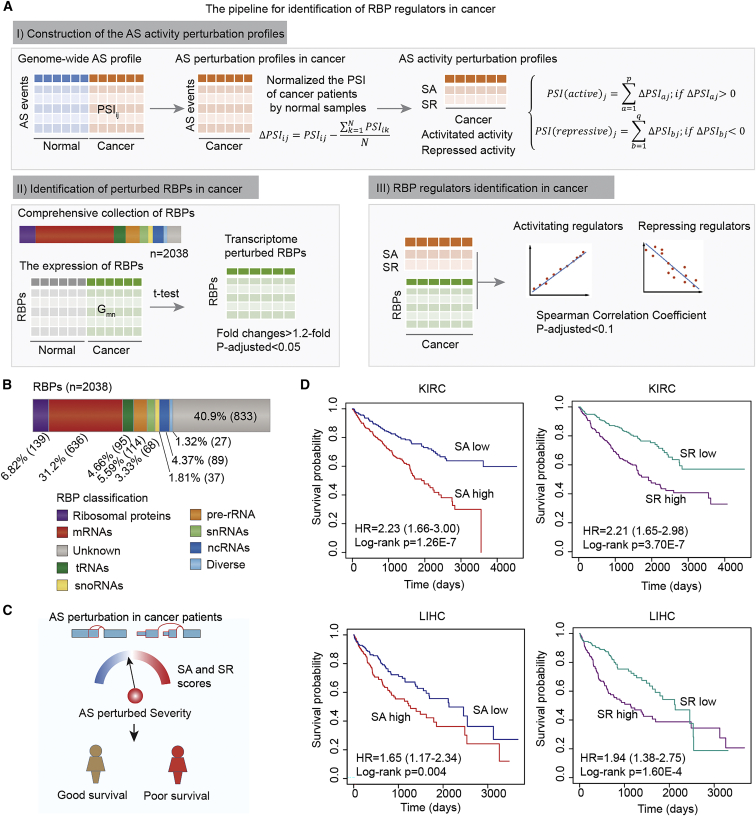
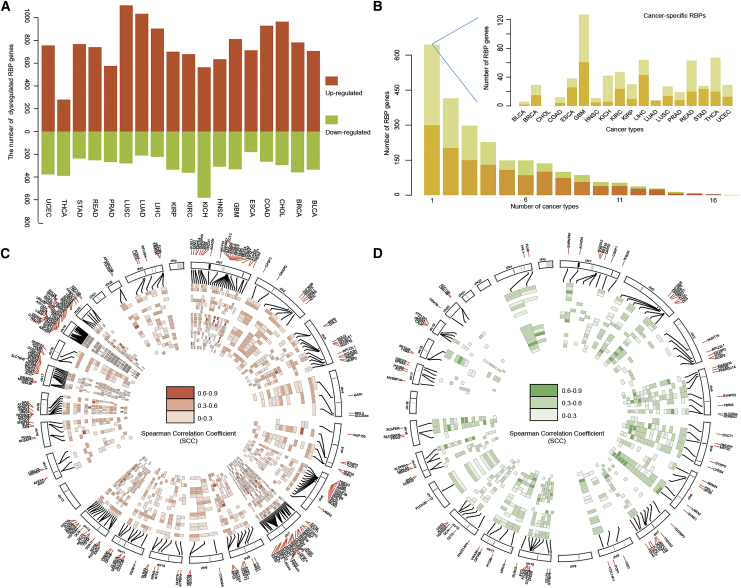
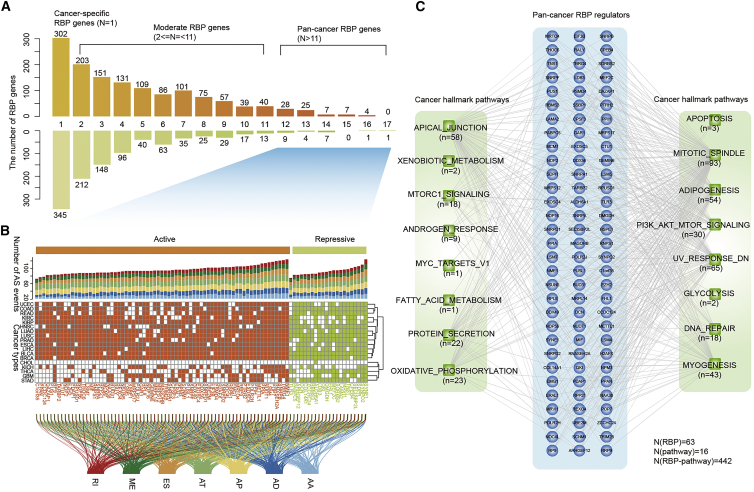
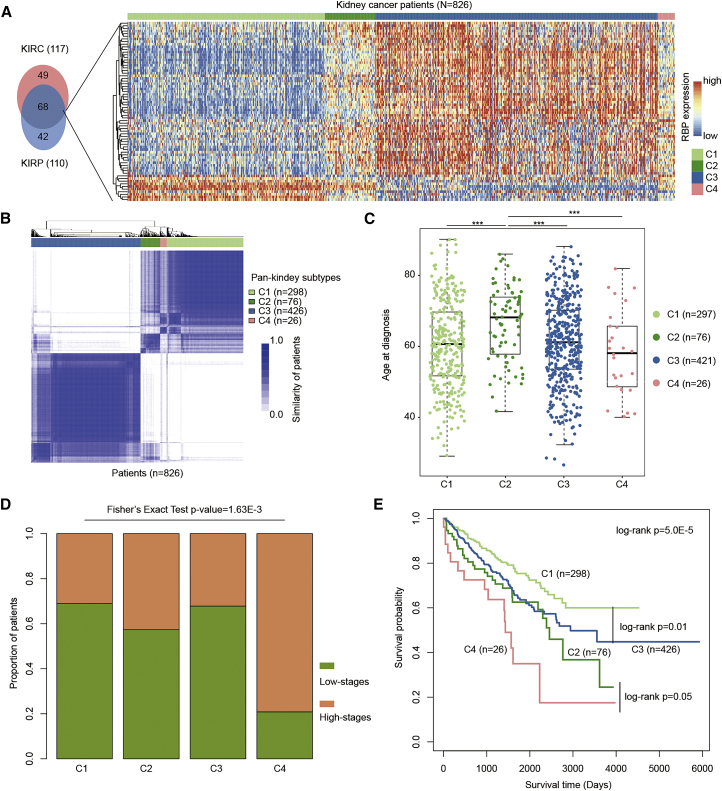
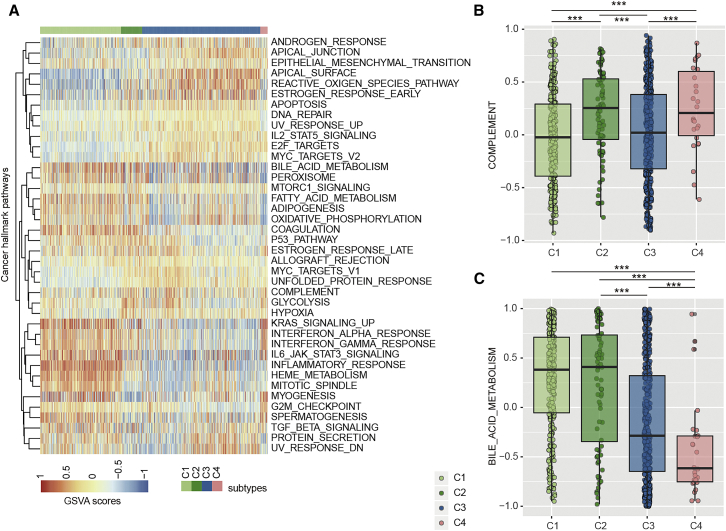
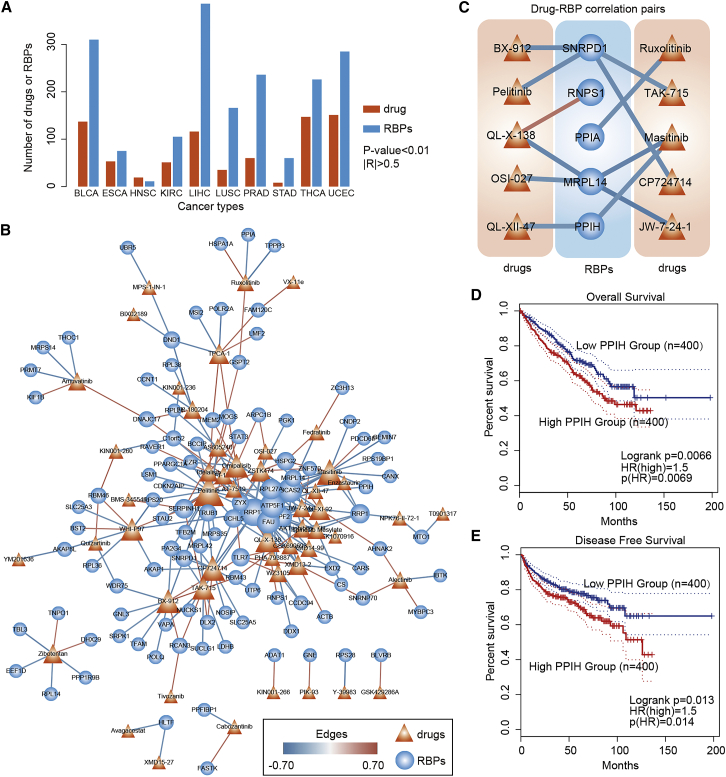
Alternative splicing (AS) plays an important role in gene regulation, and AS perturbations are frequently observed in cancer. RNA binding protein (RBP) is one of the molecular determinants of AS, and perturbations in RBP-gene network activity are causally associated with cancer development. Here, we performed a systematic analysis to characterize the perturbations in AS events across 18 cancer types. We showed that AS alterations were prevalent in cancer and involved in cancer-related pathways. Given that the extent of AS perturbation was associated with disease severity, we proposed a computational pipeline to identify RBP regulators. Pan-cancer analysis identified a number of conserved RBP regulators, which play important roles in regulating AS of genes involved in cancer hallmark pathways. Our application analysis revealed that the expression of 68 RBP regulators helped in cancer subtyping. Specifically, we identified four subtypes of kidney cancer with differences in cancer hallmark pathway activities and prognosis. Finally, we identified the small molecules that can potentially target the RBP genes and suggested potential candidates for cancer therapy. In summary, our comprehensive AS perturbation landscape analysis identified RBPs as potential therapeutic targets in cancer and provided novel insights into the regulatory functions of RBPs in cancer.
Keywords: RNA binding protein; alterative splicing; cancer; regulatory network; therapeutic targets.
© 2021 The Author(s).
Conflict of interest statement
The authors declare no competing interests.
Figures
Similar articles
-
TF-RBP-AS Triplet Analysis Reveals the Mechanisms of Aberrant Alternative Splicing Events in Kidney Cancer: Implications for Their Possible Clinical Use as Prognostic and Therapeutic Biomarkers.Int J Mol Sci. 2021 Aug 16;22(16):8789. doi: 10.3390/ijms22168789. Int J Mol Sci. 2021. PMID: 34445498 Free PMC article.
-
A comprehensive expression landscape of RNA-binding proteins (RBPs) across 16 human cancer types.RNA Biol. 2020 Feb;17(2):211-226. doi: 10.1080/15476286.2019.1673657. Epub 2019 Oct 13. RNA Biol. 2020. PMID: 31607220 Free PMC article.
-
Human protein-RNA interaction network is highly stable across mammals.BMC Genomics. 2019 Dec 30;20(Suppl 12):1004. doi: 10.1186/s12864-019-6330-9. BMC Genomics. 2019. PMID: 31888461 Free PMC article.
-
RNA-Binding Proteins in Cancer: Functional and Therapeutic Perspectives.Cancers (Basel). 2020 Sep 21;12(9):2699. doi: 10.3390/cancers12092699. Cancers (Basel). 2020. PMID: 32967226 Free PMC article. Review.
-
Emerging roles of RNA and RNA-binding protein network in cancer cells.BMB Rep. 2009 Mar 31;42(3):125-30. doi: 10.5483/bmbrep.2009.42.3.125. BMB Rep. 2009. PMID: 19335997 Review.
Cited by
-
Human papillomavirus integration transforms chromatin to drive oncogenesis.Genome Biol. 2023 Jun 27;24(1):142. doi: 10.1186/s13059-023-02926-9. Genome Biol. 2023. PMID: 37365652 Free PMC article.
-
TDP43 promotes stemness of breast cancer stem cells through CD44 variant splicing isoforms.Cell Death Dis. 2022 May 3;13(5):428. doi: 10.1038/s41419-022-04867-w. Cell Death Dis. 2022. PMID: 35504883 Free PMC article.
-
ImmReg: the regulon atlas of immune-related pathways across cancer types.Nucleic Acids Res. 2021 Dec 2;49(21):12106-12118. doi: 10.1093/nar/gkab1041. Nucleic Acids Res. 2021. PMID: 34755873 Free PMC article.
-
Data analysis guidelines for single-cell RNA-seq in biomedical studies and clinical applications.Mil Med Res. 2022 Dec 2;9(1):68. doi: 10.1186/s40779-022-00434-8. Mil Med Res. 2022. PMID: 36461064 Free PMC article. Review.
-
Splicing modulators impair DNA damage response and induce killing of cohesin-mutant MDS and AML.Sci Transl Med. 2024 Jan 3;16(728):eade2774. doi: 10.1126/scitranslmed.ade2774. Epub 2024 Jan 3. Sci Transl Med. 2024. PMID: 38170787 Free PMC article.
References
-
- Blencowe B.J. The Relationship between Alternative Splicing and Proteomic Complexity. Trends Biochem. Sci. 2017;42:407–408. - PubMed
-
- Koch L. Alternative splicing: A thermometer controlling gene expression. Nat. Rev. Genet. 2017;18:515. - PubMed
-
- Climente-González H., Porta-Pardo E., Godzik A., Eyras E. The Functional Impact of Alternative Splicing in Cancer. Cell Rep. 2017;20:2215–2226. - PubMed
LinkOut - more resources
Full Text Sources
Other Literature Sources
Research Materials
