. 2021 Apr 21;10(1):1912892.
doi: 10.1080/2162402X.2021.1912892.

PD-1 and LAG-3 blockade improve anti-tumor vaccine efficacy

Affiliations

PD-1 and LAG-3 blockade improve anti-tumor vaccine efficacy

Christopher D Zahm et al. Oncoimmunology. .

Abstract

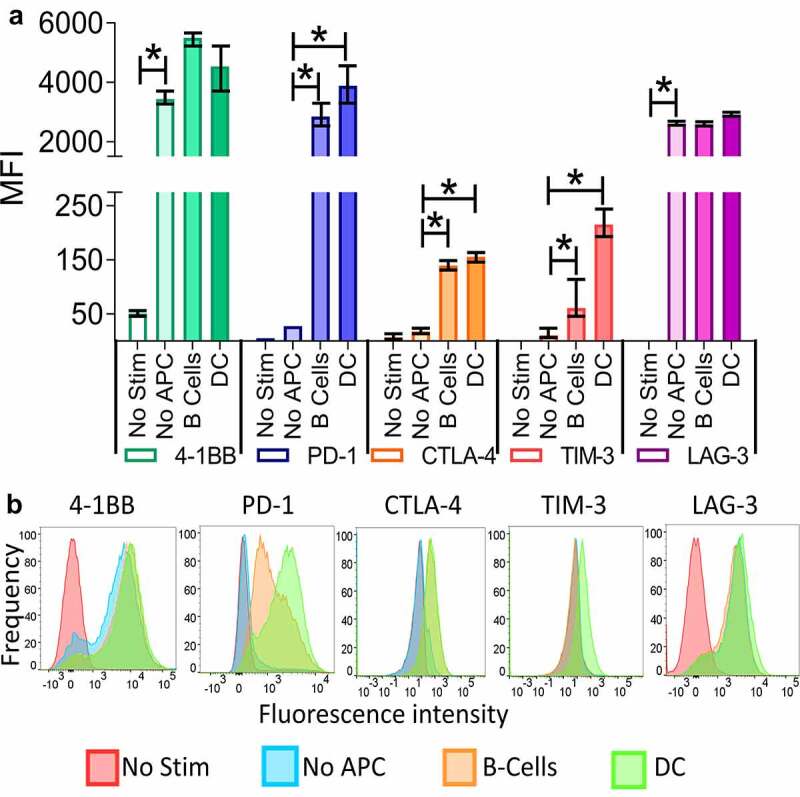
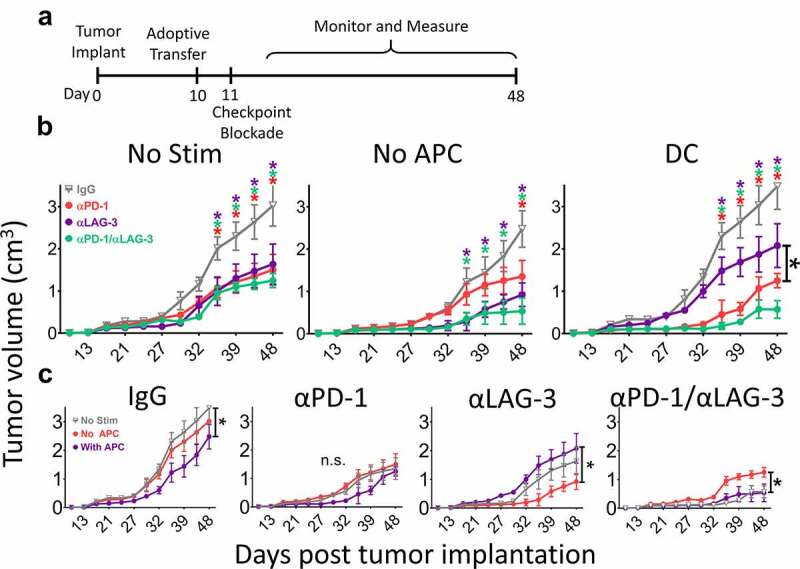
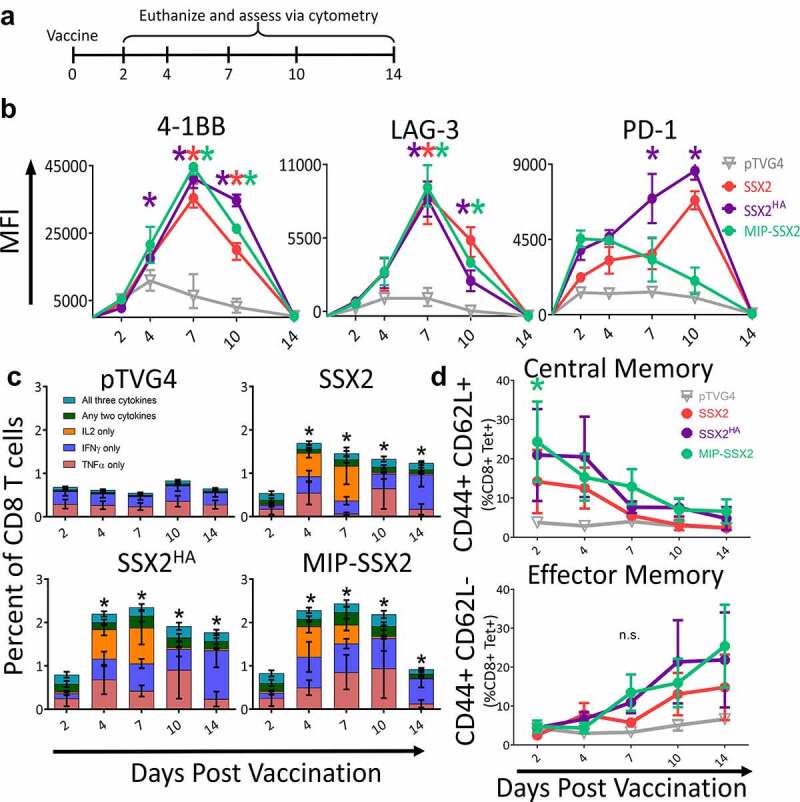
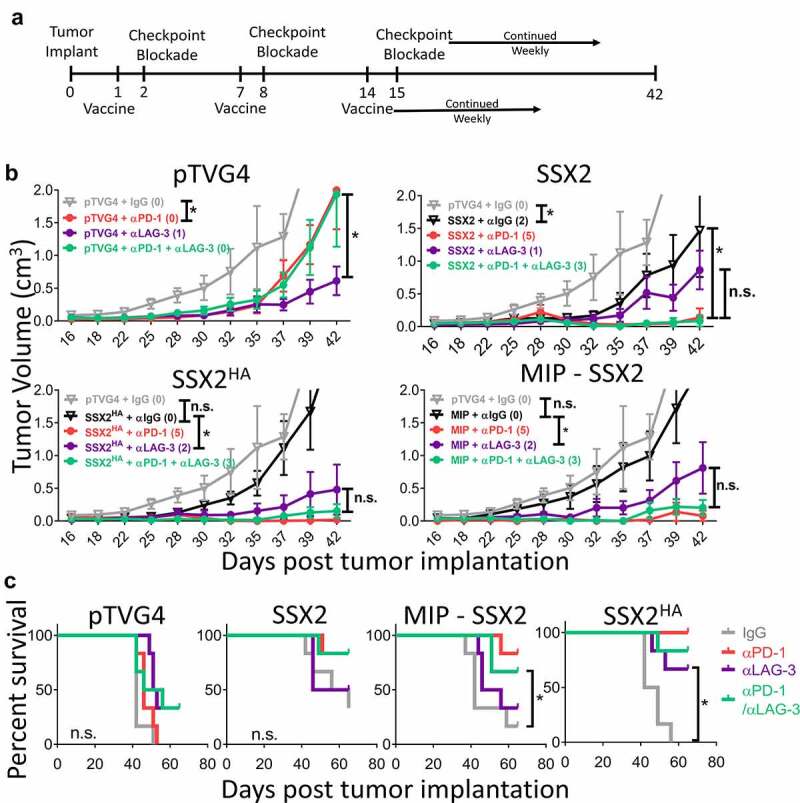
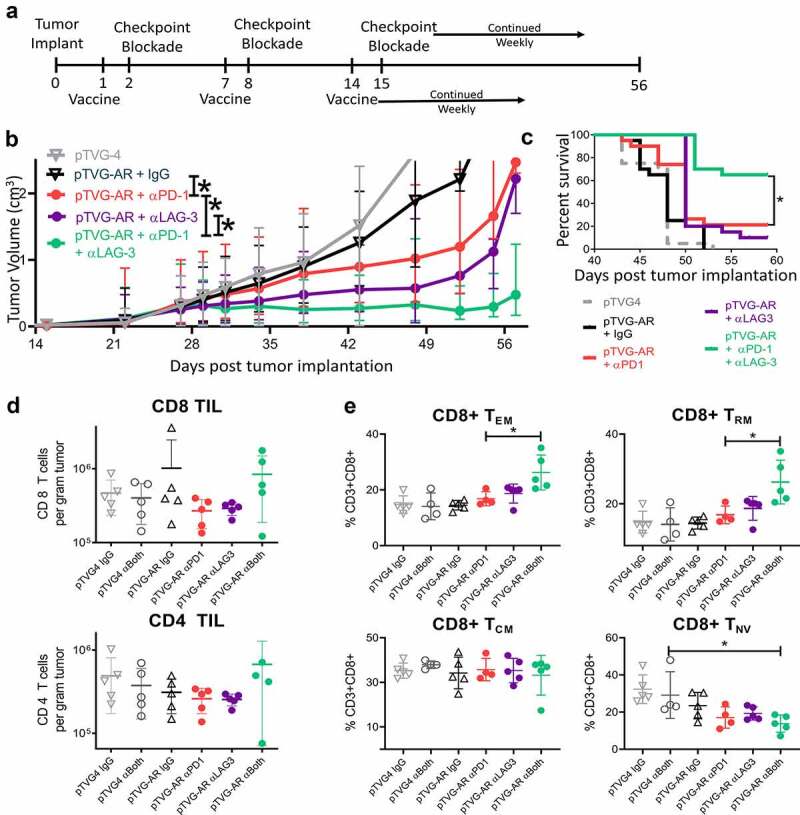
Concurrent blockade of different checkpoint receptors, notably PD-1 and CTLA-4, elicits greater anti-tumor activity for some tumor types, and the combination of different checkpoint receptor inhibitors is an active area of clinical research. We have previously demonstrated that anti-tumor vaccination, by activating CD8 + T cells, increases the expression of PD-1, CTLA-4, LAG-3 and other inhibitory receptors, and the anti-tumor efficacy of vaccination can be increased with checkpoint blockade. In the current study, we sought to determine whether anti-tumor vaccination might be further improved with combined checkpoint blockade. Using an OVA-expressing mouse tumor model, we found that CD8 + T cells activated in the presence of professional antigen presenting cells (APC) expressed multiple checkpoint receptors; however, T cells activated without APCs expressed LAG-3 alone, suggesting that LAG-3 might be a preferred target in combination with vaccination. Using three different murine tumor models, and peptide or DNA vaccines targeting three tumor antigens, we assessed the effects of vaccines with blockade of PD-1 and/or LAG-3 on tumor growth. We report that, in each model, the anti-tumor efficacy of vaccination was increased with PD-1 and/or LAG-3 blockade. However, combined PD-1 and LAG-3 blockade elicited the greatest anti-tumor effect when combined with vaccination in a MycCaP prostate cancer model in which PD-1 blockade alone with vaccination targeting a "self" tumor antigen had less efficacy. These results suggest anti-tumor vaccination might best be combined with concurrent blockade of both PD-1 and LAG-3, and potentially other checkpoint receptors whose expression is increased on CD8 + T cells following vaccine-mediated activation.

Keywords: APC; LAG-3; PD-1; tumor vaccine.


Conflict of interest statement

Douglas G. McNeel has ownership interest, has received research support, and serves as consultant to Madison Vaccines, Inc. which has licensed intellectual property related to this content. None of the other authors have relevant potential conflicts of interest.

Figures

Figure 1.
Figure 1.
T-cell activation by professional APCs can lead to distinct immune checkpoint expression on CD8 + T cells. Splenocytes were prepared from the spleens of OT-1 mice and separated into T cells (CD8+) and B-cells (CD19+) using MACS. DC (CD11c+) were prepared from the spleens of Flt3 ligand–treated B6 mice. T cells were stimulated with a control peptide (No Stim), the SIINFEKL peptide alone (No APC), or the SIINFEKL peptide in combination with either B cells or DC. After 72 hours the cells were collected and the checkpoint and 4–1BB expression analyzed by flow cytometry. Shown is the mean fluorescence intensity (MFI) and standard error of the mean of 4–1BB, PD-1, CTLA-4, TIM-3, or LAG-3 on CD8 + T cells from triplicate assessments (panel A), and a representative histogram for each marker (panel B). Asterisks indicate p < .05 by one-way ANOVA with Bonferroni’s multiple comparisons correction. Results are from one experiment (N = 3 mice per group) and are representative of two similar, independent experiments
Figure 2.
Figure 2.
Blockade of PD-1 or LAG-3 improves anti-tumor activity of activated CD8 + T-cells. As shown in panel A, B6 mice were inoculated with 1 × 106 PD-L1-expressing E.G7-OVA cells. After ten days, 1 × 106 OT-1 T cells, stimulated with or without peptide and with or without DC as in Figure 1, were adoptively transferred into the tumor-bearing mice. The following day, mice were treated with IgG isotype control (gray), PD-1 blocking (red), LAG-3 blocking (purple), or a combination of both PD-1 and LAG-3 blocking antibodies (green). Tumor growth was measured as indicated on the X axes. Shown in panel B are the growth curves for mice that received T cells which had not been incubated with DC and a nonspecific peptide (No Stim), T without DC cells stimulated with SIINFEKL peptide alone (No APC), or T cells stimulated with peptide in the presence of DC (DC). Panel C shows the same data grouped by checkpoint blockade treatment rather than T-cell stimulation conditions. Measurements for individual mice are shown in Supplemental Figure S5. Asterisks indicate p < .05 as assessed by 2-way ANOVA with Bonferroni’s multiple comparisons test. Results are from one experiment with N = 6 mice per group
Figure 3.
Figure 3.
DNA vaccination can elicit CD8 + T cells differentially expressing PD-1 and LAG-3. Panel A: six-week-old HHDII HLA-A2+ mice were immunized with pTVG4 empty vector, the native pTVG-SSX2 DNA vaccine (SSX2), pTVG-SSX2HA (SSX2HA), or MIP-SSX2. Mice were euthanized at the time points indicated and splenocytes were assessed by flow cytometry gated on CD3+ CD8+ tetramer+ cells (panels B and D, n = 6 mice/time/condition) or following stimulation with an HLA-A2-restricted peptide epitope (SSX2 p103–111) to determine the number of responding cells via intracellular cytokine analysis (panel C, n = 3 mice/timepoint). In panel C, comparisons are of total cytokine-secreting CD8 + T cells at each time point between vaccine-treated or pTVG4 control-treated animals. For all panels, asterisks indicate p < .05 by two-way ANOVA with Bonferroni’s multiple comparisons correction. MFI = mean fluorescence intensity. Results are from one experiment and are representative of two similar, independent experiments
Figure 4.
Figure 4.
PD-1 blockade is superior to LAG-3 blockade when used in combination with an anti-tumor DNA vaccine in an αPD-1 sensitive tumor. Panel A: six-week-old HHDII (HLA-A2+) mice were inoculated s.c. with SSX2+ HLA-A2+ sarcoma cells and immunized with pTVG4 empty vector, pTVG-SSX2 (SSX2), pTVG-SSX2HA (SSX2HA), or MIP-SSX2 in combination with αPD-1, αLAG-3, both αPD-1/αLAG-3, or IgG control. Tumor growth was measured over time. Panel B: shown are the tumor growth curves for each vaccine group. Animals with tumors greater than 2 cm3 in size were euthanized, and data were censored at 2 cm3. Panel C: data are presented as survival plots using the time to death or when tumors reached 2 cm3 in size, whichever occurred first. Individual tumor measurements are shown in Supplemental Figure S8. Asterisks in panel B indicate p < .05 as assessed by mixed-effects model with Geisser-Greenhouse correction and Tukey’s multiple comparisons test with individual variances; N = 6 mice/time point/condition. n.s. = not significant. Results are from one experiment (N = 6) and are representative of two similar, independent experiments. For data points above the Y axis, statistical comparisons are indicated on the figure legends. In panel C, asterisks indicate p < .05 as assessed by log-rank test
Figure 5.
Figure 5.
Vaccination with PD-1 and LAG-3 blockade is superior to vaccination with either blockade alone in αPD-1 resistant prostate cancer model. As shown in panel A, six-week-old FVB mice (n = 20 per group) were inoculated s.c. with 106 MyC-CaP cells and immunized with pTVG4 empty vector or pTVG-AR in combination with IgG control, αPD-1, αLAG-3, or both αPD-1/αLAG-3 antibodies. Tumor growth was measured over time. Panel B: Shown are the mean tumor growth curves and standard deviations; individual tumor measurements are shown in Supplemental Figure S10. Animals with tumors greater than 2 cm3 in size were euthanized, and data were censored at 2 cm3. Panel C: data are presented as survival plots using the time to death or when tumors reached 2 cm3 in size, whichever occurred first. Results shown are from one experiment and representative of three independent experiments. Panel D: Shown are the number of CD8+ (top) and CD4 (bottom) tumor-infiltrating lymphocytes per gram of tumor tissue collected at day 29 as determined by flow cytometry (gating strategy shown in Supplemental Figure S6). Panel E: Shown are the distribution of effector memory (TEM, CD44+ CD62Llo), resident memory (TRM, CD69+ CD103+), central memory (TCM, CD44+ CD62L+), and naïve (TNV, CD44-CD62L+) cells among the CD8 + T cells. Asterisks indicate p < .05 assessed by the mixed-effects model with Geisser-Greenhouse correction and Tukey’s multiple comparisons test with individual variances (panel B), by log-rank test (panel C), or by the one-way ANOVA with Tukey’s multiple comparisons test (panels D and E)

Similar articles

Cited by

References

    1. Tang F, Du X, Liu M, Zheng P, Liu Y.. Anti-CTLA-4 antibodies in cancer immunotherapy: selective depletion of intratumoral regulatory T cells or checkpoint blockade? Cell Biosci. 2018;8:30. doi:10.1186/s13578-018-0229-z. - DOI - PMC - PubMed
    1. Jin HT, Anderson AC, Tan WG, West EE, Ha SJ, Araki K, Freeman GJ, Kuchroo VK, Ahmed R. Cooperation of Tim-3 and PD-1 in CD8 T-cell exhaustion during chronic viral infection. Proc Natl Acad Sci U S A. 2010;107(33):14733–10. doi:10.1073/pnas.1009731107. - DOI - PMC - PubMed
    1. Pardoll DM. The blockade of immune checkpoints in cancer immunotherapy. Nat Rev Cancer. 2012;12(4):252–264. doi:10.1038/nrc3239. - DOI - PMC - PubMed
    1. Riley JL. PD-1 signaling in primary T cells. Immunol Rev. 2009;229(1):114–125. doi:10.1111/j.1600-065X.2009.00767.x. - DOI - PMC - PubMed
    1. Hui E, Cheung J, Zhu J, Su X, Taylor MJ, Wallweber HA, Sasmal DK, Huang J, Kim J. M, Mellman I, et al. T cell costimulatory receptor CD28 is a primary target for PD-1-mediated inhibition. Science. 2017;355(6332):1428–1433. doi:10.1126/science.aaf1292. - DOI - PMC - PubMed

Publication types