

In vivo dissolution of poorly water-soluble drugs: Proof of concept based on fluorescence bioimaging
- PMID: 33996417
- PMCID: PMC8105772
- DOI: 10.1016/j.apsb.2020.08.002
In vivo dissolution of poorly water-soluble drugs: Proof of concept based on fluorescence bioimaging
Abstract
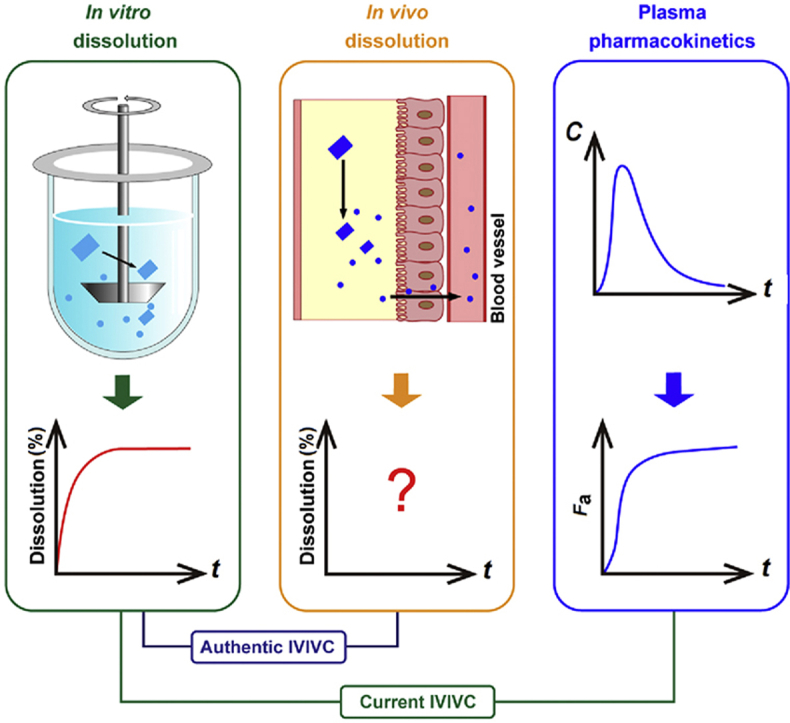
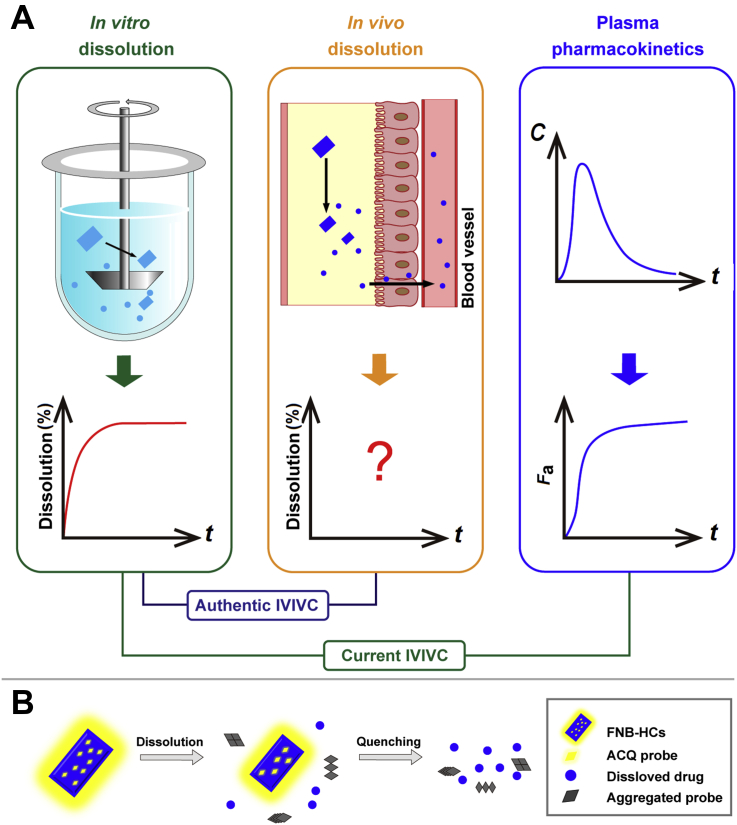
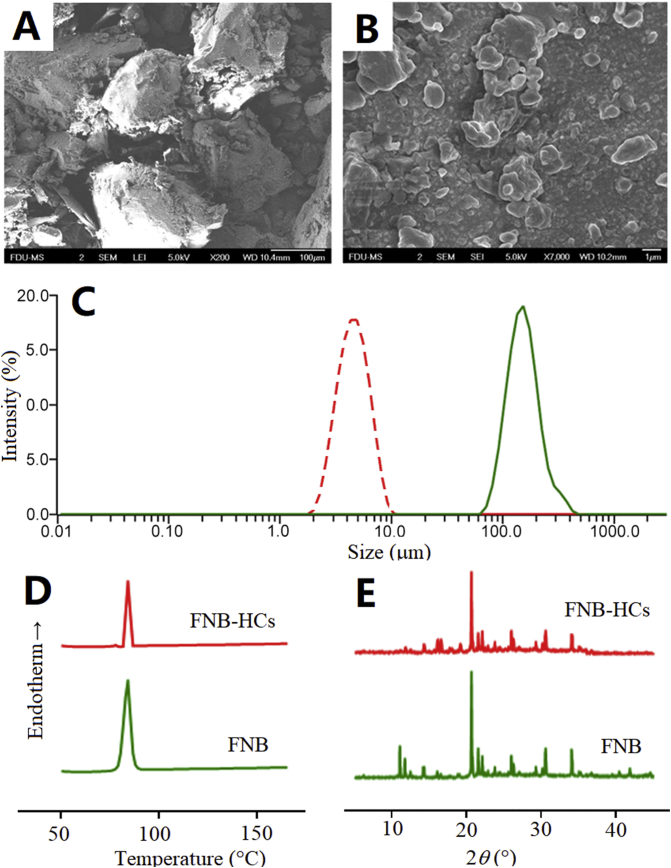
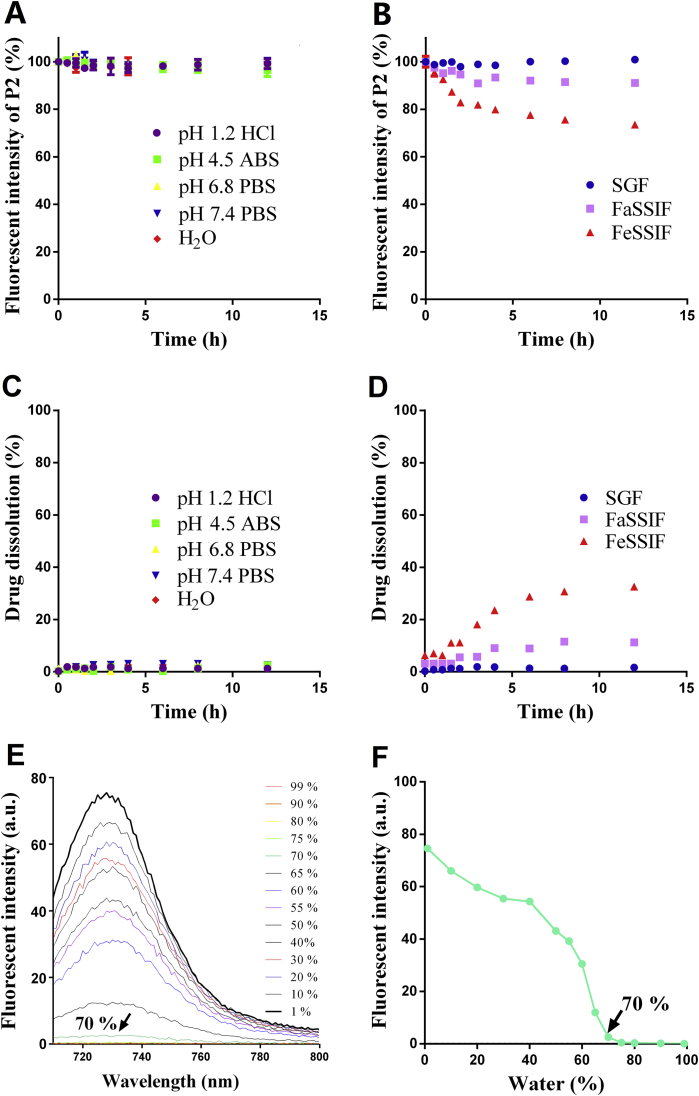
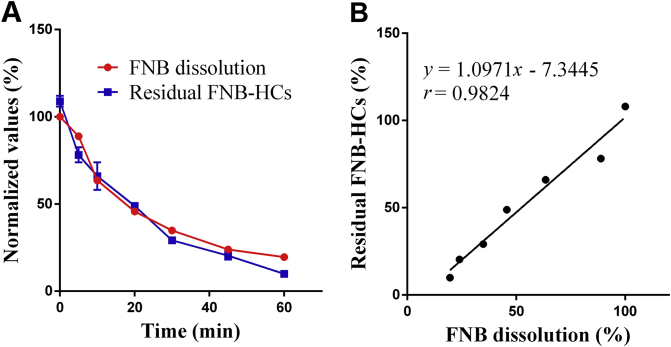
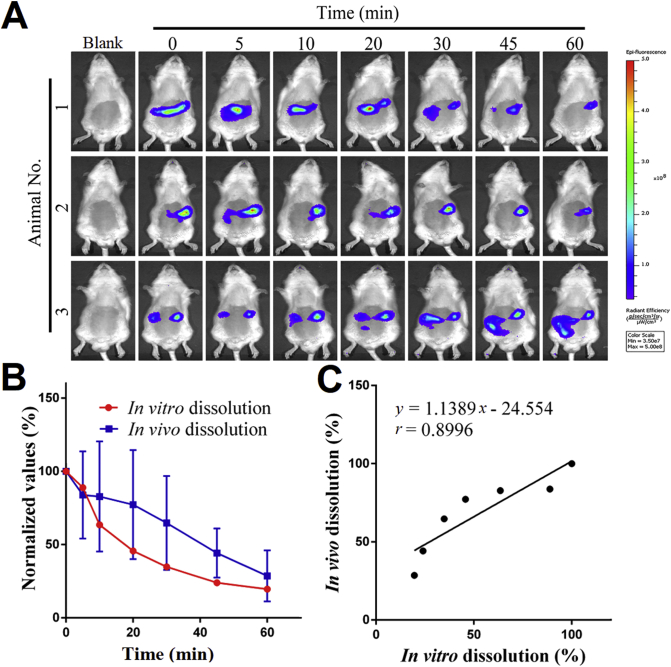
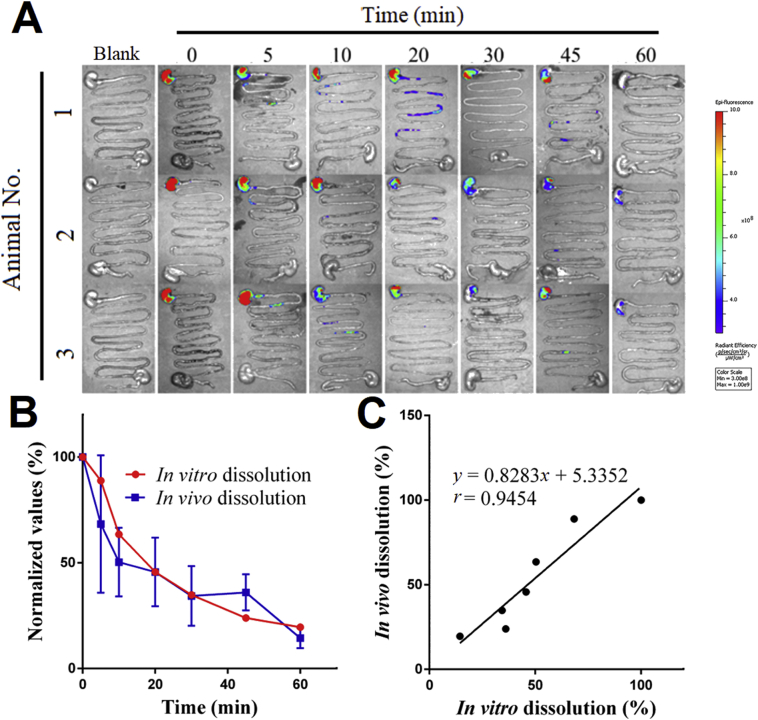
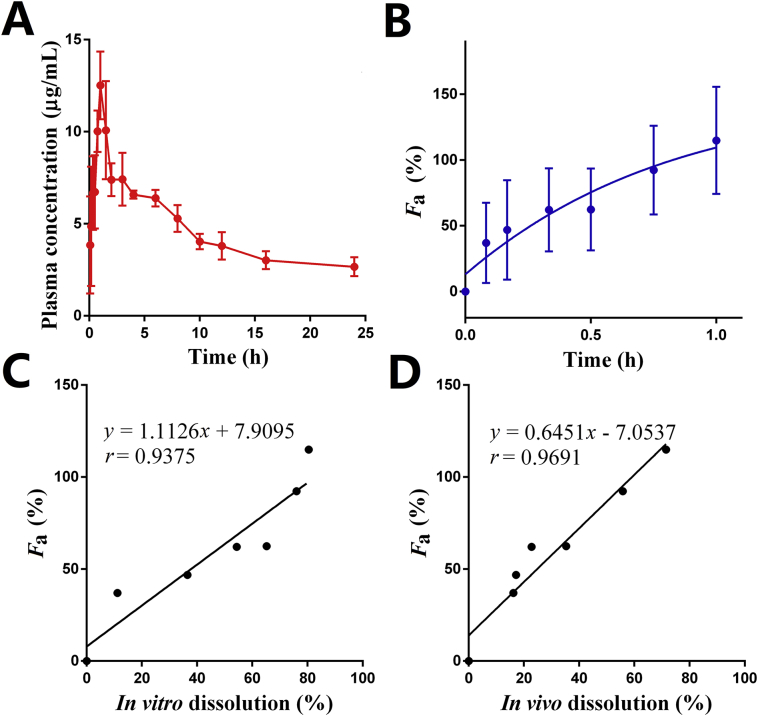
In vitro‒in vivo correlation (IVIVC) of solid dosage forms should be established basically between in vitro and in vivo dissolution of active pharmaceutical ingredients. Nevertheless, in vivo dissolution profiles have never been accurately portrayed. The current practice of IVIVC has to resort to in vivo absorption fractions (F a). In this proof-of-concept study, in vivo dissolution of a model poorly water-soluble drug fenofibrate (FNB) was investigated by fluorescence bioimaging. FNB crystals were first labeled by near-infrared fluorophores with aggregation-caused quenching properties. The dyes illuminated FNB crystals but quenched immediately and absolutely once been released into aqueous media, enabling accurate monitoring of residual drug crystals. The linearity established between fluorescence and crystal concentration justified reliable quantification of FNB crystals. In vitro dissolution was first measured following pharmacopoeia monograph protocols with well-documented IVIVC. The synchronicity between fluorescence and in vitro dissolution of FNB supported using fluorescence as a measure for determination of dissolution. In vitro dissolution correlated well with in vivo dissolution, acquired by either live or ex vivo imaging. The newly established IVIVC was further validated by correlating both in vitro and in vivo dissolution with F a obtained from pharmacokinetic data.
Keywords: Aggregation-caused quenching; Bioimaging; Fenofibrate; Fluorescence; IVIVC; In vivo dissolution.
© 2021 Chinese Pharmaceutical Association and Institute of Materia Medica, Chinese Academy of Medical Sciences. Production and hosting by Elsevier B.V.
Conflict of interest statement
The authors have no conflicts of interest to declare.
Figures
Similar articles
-
Establishment of In Vitro Dissolution Based on Similarity with In Vivo Dissolution: A Case Study on Aripiprazole.Mol Pharm. 2023 May 1;20(5):2579-2588. doi: 10.1021/acs.molpharmaceut.3c00014. Epub 2023 Apr 12. Mol Pharm. 2023. PMID: 37046179
-
Development of a Physiologically Relevant Population Pharmacokinetic in Vitro-in Vivo Correlation Approach for Designing Extended-Release Oral Dosage Formulation.Mol Pharm. 2017 Jan 3;14(1):53-65. doi: 10.1021/acs.molpharmaceut.6b00677. Epub 2016 Dec 12. Mol Pharm. 2017. PMID: 27809538
-
In vitro - in vivo correlation: from theory to applications.J Pharm Pharm Sci. 2006;9(2):169-89. J Pharm Pharm Sci. 2006. PMID: 16959187
-
In vitro Methods for In vitro-In vivo Correlation (IVIVC) for Poorly Water Soluble Drugs: Lipid Based Formulation Perspective.Curr Drug Deliv. 2018;15(7):918-929. doi: 10.2174/1567201815666180116090910. Curr Drug Deliv. 2018. PMID: 29336263 Review.
-
Physiologically Based In vitro Models to Predict the Oral Dissolution and Absorption of a Solid Drug Delivery System.Curr Drug Metab. 2015;16(9):777-806. doi: 10.2174/1389200216666150812123836. Curr Drug Metab. 2015. PMID: 26264200 Review.
Cited by
-
Geniposide-Loaded Liposomes for Brain Targeting: Development, Evaluation, and In Vivo Studies.AAPS PharmSciTech. 2021 Aug 18;22(7):222. doi: 10.1208/s12249-021-02093-9. AAPS PharmSciTech. 2021. PMID: 34409515
-
The contribution of absorption of integral nanocrystals to enhancement of oral bioavailability of quercetin.Acta Pharm Sin B. 2021 Apr;11(4):978-988. doi: 10.1016/j.apsb.2021.02.015. Epub 2021 Feb 25. Acta Pharm Sin B. 2021. PMID: 33996410 Free PMC article.
-
The long-circulating effect of pegylated nanoparticles revisited via simultaneous monitoring of both the drug payloads and nanocarriers.Acta Pharm Sin B. 2022 May;12(5):2479-2493. doi: 10.1016/j.apsb.2021.11.016. Epub 2021 Nov 18. Acta Pharm Sin B. 2022. PMID: 35646531 Free PMC article.
-
Editorial of Special Issue "The Biological Fate of Drug Nanocarriers".Acta Pharm Sin B. 2021 Apr;11(4):850-851. doi: 10.1016/j.apsb.2021.04.004. Epub 2021 May 1. Acta Pharm Sin B. 2021. PMID: 33996403 Free PMC article. No abstract available.
-
Current research trends of nanomedicines.Acta Pharm Sin B. 2023 Nov;13(11):4391-4416. doi: 10.1016/j.apsb.2023.05.018. Epub 2023 May 20. Acta Pharm Sin B. 2023. PMID: 37969727 Free PMC article. Review.
References
-
- Allen L.V., Jr., Popovich N.G., Aansel H.C. 8th ed. Lippincott Williams & Wilkins; Baltimore: 2013. Ansel's pharmaceutical dosage forms and drug delivery systems.
-
- Shargel L., Yu A.B.C. 7th ed. McGraw-Hill Education; New York: 2016. Applied biopharmaceutics & pharmacokinetics.
-
- Guo M., Wei M., Li W., Guo M., Guo C., Ma M. Impacts of particle shapes on the oral delivery of drug nanocrystals: mucus permeation, transepithelial transport and bioavailability. J Control Release. 2019;307:64–75. - PubMed
-
- Fu Q., Sun J., Ai X., Zhang P., Li M., Wang Y. Nimodipine nanocrystals for oral bioavailability improvement: role of mesenteric lymph transport in the oral absorption. Int J Pharm. 2013;448:290–297. - PubMed
-
- Xie Y., Shi B., Xia F., Qi J., Dong X., Zhao W. Epithelia transmembrane transport of orally administered ultrafine drug particles evidenced by environment sensitive fluorophores in cellular and animal studies. J Control Release. 2018;270:65–75. - PubMed
LinkOut - more resources
Full Text Sources
