

Bayesian spatio-temporal joint disease mapping of Covid-19 cases and deaths in local authorities of England
- PMID: 33996424
- PMCID: PMC8114675
- DOI: 10.1016/j.spasta.2021.100519
Bayesian spatio-temporal joint disease mapping of Covid-19 cases and deaths in local authorities of England
Abstract
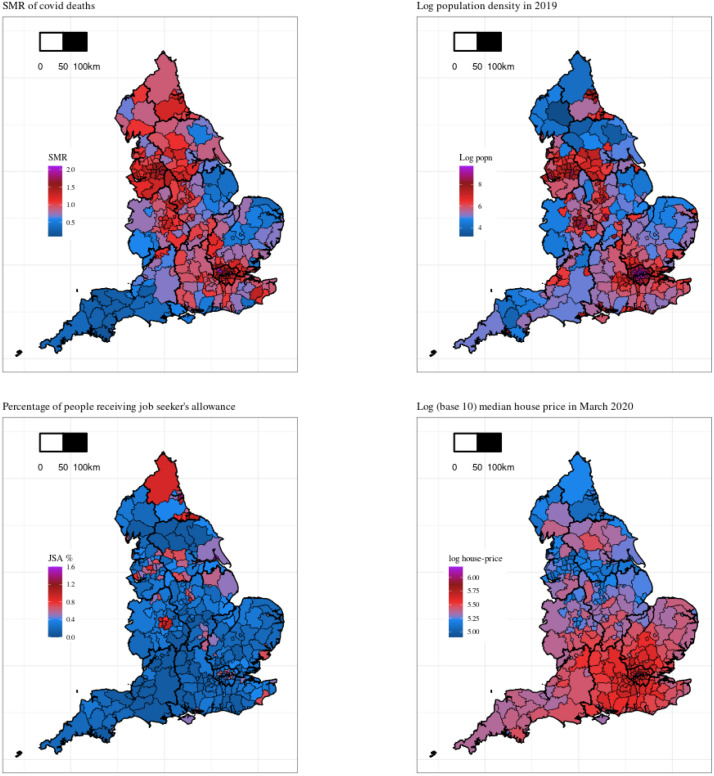
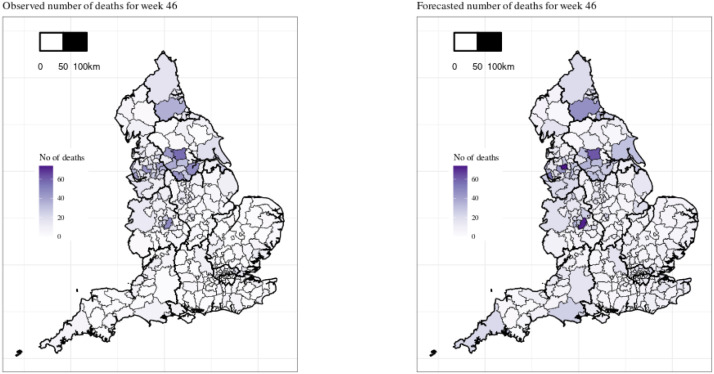
The overwhelming spatio-temporal nature of the spread of the ongoing Covid-19 pandemic demands urgent attention of data analysts and model developers. Modelling results obtained from analytical tool development are essential to understand the ongoing pandemic dynamics with a view to helping the public and policy makers. The pandemic has generated data on a huge number of interesting statistics such as the number of new cases, hospitalisations and deaths in many spatio-temporal resolutions for the analysts to investigate. The multivariate nature of these data sets, along with the inherent spatio-temporal dependencies, poses new challenges for modellers. This article proposes a two-stage hierarchical Bayesian model as a joint bivariate model for the number of cases and deaths observed weekly for the different local authority administrative regions in England. An adaptive model is proposed for the weekly Covid-19 death rates as part of the joint bivariate model. The adaptive model is able to detect possible step changes in death rates in neighbouring areas. The joint model is also used to evaluate the effects of several socio-economic and environmental covariates on the rates of cases and deaths. Inclusion of these covariates points to the presence of a north-south divide in both the case and death rates. Nitrogen dioxide, the only air pollution measure used in the model, is seen to be significantly positively associated with the number cases, even in the presence of the spatio-temporal random effects taking care of spatio-temporal dependencies present in the data. The proposed models provide excellent fits to the observed data and are seen to perform well for predicting the location specific number of deaths a week in advance. The structure of the models is very general and the same framework can be used for modelling other areally aggregated temporal statistics of the pandemics, e.g. the rate of hospitalisation.
Keywords: Bayesian space–time modelling; CAR; Covid-19 case rate; Covid-19 death rate; Ecological analysis; Temporal disease mapping.
© 2021 Elsevier B.V. All rights reserved.
Figures


Similar articles
-
Evaluation of predictive capability of Bayesian spatio-temporal models for Covid-19 spread.BMC Med Res Methodol. 2023 Aug 11;23(1):182. doi: 10.1186/s12874-023-01997-3. BMC Med Res Methodol. 2023. PMID: 37568119 Free PMC article.
-
Modelling and predicting the spatio-temporal spread of COVID-19, associated deaths and impact of key risk factors in England.Sci Rep. 2021 Mar 8;11(1):5378. doi: 10.1038/s41598-021-83780-2. Sci Rep. 2021. PMID: 33686125 Free PMC article.
-
Bayesian spatio-temporal analysis of the COVID-19 pandemic in Catalonia.Sci Rep. 2024 Feb 20;14(1):4220. doi: 10.1038/s41598-024-53527-w. Sci Rep. 2024. PMID: 38378913 Free PMC article.
-
A multivariate spatio-temporal model for the incidence of imported COVID-19 cases and COVID-19 deaths in Cuba.Spat Spatiotemporal Epidemiol. 2023 Jun;45:100588. doi: 10.1016/j.sste.2023.100588. Epub 2023 May 10. Spat Spatiotemporal Epidemiol. 2023. PMID: 37301587 Free PMC article.
-
Spatio-temporal modeling for confirmed cases of lyme disease in Virginia.Ticks Tick Borne Dis. 2021 Nov;12(6):101822. doi: 10.1016/j.ttbdis.2021.101822. Epub 2021 Sep 4. Ticks Tick Borne Dis. 2021. PMID: 34555712
Cited by
-
Bayesian negative binomial regression with spatially varying dispersion: Modeling COVID-19 incidence in Georgia.Spat Stat. 2022 Dec;52:100703. doi: 10.1016/j.spasta.2022.100703. Epub 2022 Sep 23. Spat Stat. 2022. PMID: 36168515 Free PMC article. Review.
-
A joint Bayesian spatiotemporal risk prediction model of COVID-19 incidence, IC admission, and death with application to Sweden.Ann Reg Sci. 2022 Nov 28:1-34. doi: 10.1007/s00168-022-01191-1. Online ahead of print. Ann Reg Sci. 2022. PMID: 36465998 Free PMC article.
-
Clustering spatio-temporal series of confirmed COVID-19 deaths in Europe.Spat Stat. 2022 Jun;49:100543. doi: 10.1016/j.spasta.2021.100543. Epub 2021 Oct 6. Spat Stat. 2022. PMID: 34631400 Free PMC article.
-
A joint hierarchical model for the number of cases and deaths due to COVID-19 across the boroughs of Montreal.Spat Spatiotemporal Epidemiol. 2022 Aug;42:100518. doi: 10.1016/j.sste.2022.100518. Epub 2022 May 23. Spat Spatiotemporal Epidemiol. 2022. PMID: 35934331 Free PMC article.
-
Bayesian disease mapping: Past, present, and future.Spat Stat. 2022 Aug;50:100593. doi: 10.1016/j.spasta.2022.100593. Epub 2022 Jan 19. Spat Stat. 2022. PMID: 35075407 Free PMC article.
References
-
- Akaike H. In: 2nd International Symposium on Information Theory. Petrov B.N., Csáki F., editors. Budapest: Akadémiai Kiadó; 1973. Information theory and an extension of the maximum likelihood principle; pp. 267–281.
-
- Banerjee S., Carlin B.P., Gelfand A.E. second ed. CRC Press; Boca Raton: 2015. Hierarchical Modeling and Analysis for Spatial Data.
-
- Besag J., York J., Mollié A. Bayesian image restoration with two applications in spatial statistics. Ann. Inst. Stat. Math. 1991;43:1–59.
-
- Bland M. third ed. Oxford University Press; Oxford: 2000. An Introduction to Medical Statistics.
LinkOut - more resources
Full Text Sources
Other Literature Sources