Identification of Zoophilic Dermatophytes Using MALDI-TOF Mass Spectrometry
- PMID: 33996620
- PMCID: PMC8113951
- DOI: 10.3389/fcimb.2021.631681
Identification of Zoophilic Dermatophytes Using MALDI-TOF Mass Spectrometry
Abstract
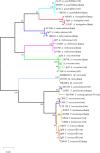
Dermatophytoses represent a major health burden in animals and man. Zoophilic dermatophytes usually show a high specificity to their original animal host but a zoonotic transmission is increasingly recorded. In humans, these infections elicit highly inflammatory skin lesions requiring prolonged therapy even in the immunocompetent patient. The correct identification of the causative agent is often crucial to initiate a targeted and effective therapy. To that end, matrix assisted laser desorption ionization time-of-flight mass spectrometry (MALDI-TOF MS) represents a promising tool. The objective of this study was to evaluate the reliability of species identification of zoophilic dermatophytes using MALDI-TOF MS. The investigation of isolates from veterinary clinical samples suspicious of dermatophytoses suggests a good MALDI-TOF MS based identification of the most common zoophilic dermatophyte Microsporum canis. Trichophyton (T.) spp. usually achieved scores only around the cutoff value for secure species identification because of a small number of reference spectra. Moreover, these results need to be interpreted with caution due to the close taxonomic relationship of dermatophytes being reflected in very similar spectra. In our study, the analysis of 50 clinical samples of hedgehogs revealed no correct identification using the provided databases, nor for zoophilic neither for geophilic causative agents. After DNA sequencing, adaptation of sample processing and an individual extension of the in-house database, acceptable identification scores were achieved (T. erinacei and Arthroderma spp., respectively). A score-oriented distance dendrogram revealed clustering of geophilic isolates of four different species of the genus Arthroderma and underlined the close relationship of the important zoophilic agents T. erinacei, T. verrucosum and T. benhamiae by forming a subclade within a larger cluster including different dermatophytes. Taken together, MALDI-TOF MS proofed suitable for the identification of zoophilic dermatophytes provided fresh cultures are used and the reference library was previously extended with spectra of laboratory-relevant species. Performing independent molecular methods, such as sequencing, is strongly recommended to substantiate the findings from morphologic and MALDI-TOF MS analyses, especially for uncommon causative agents.
Keywords: Microsporum; Trichophyton; Trichophyton erinacei; dermatophytoses; geophilic; hedgehog; zoonoses; zoophilic.
Copyright © 2021 Baumbach, Müller, Reuschel, Uhrlaß, Nenoff, Baums and Schrödl.
Conflict of interest statement
The authors declare that the research was conducted in the absence of any commercial or financial relationships that could be construed as a potential conflict of interest.
Figures


Similar articles
-
Identification of dermatophytes by matrix-assisted laser desorption/ionization time-of-flight mass spectrometry.Med Mycol. 2013 Jul;51(5):514-21. doi: 10.3109/13693786.2012.746476. Epub 2012 Dec 11. Med Mycol. 2013. PMID: 23228046
-
MALDI-TOF MS analysis of bovine and zoonotic Trichophyton verrucosum isolates reveals a distinct peak and cluster formation of a subgroup with Trichophyton benhamiae.Med Mycol. 2018 Jul 1;56(5):602-609. doi: 10.1093/mmy/myx084. Med Mycol. 2018. PMID: 29420802
-
[Zoophilic dermatophytes during coronavirus pandemic in Germany].Dermatologie (Heidelb). 2023 Jun;74(6):430-439. doi: 10.1007/s00105-023-05150-5. Epub 2023 May 3. Dermatologie (Heidelb). 2023. PMID: 37133787 Free PMC article. German.
-
[Dermatophytosis caused by rare anthropophilic and zoophilic agents].Hautarzt. 2019 Aug;70(8):561-574. doi: 10.1007/s00105-019-4429-1. Hautarzt. 2019. PMID: 31139861 Review. German.
-
Trichophyton species of Arthroderma benhamiae - a new infectious agent in dermatology.J Dtsch Dermatol Ges. 2014 Jul;12(7):571-81. doi: 10.1111/ddg.12390. J Dtsch Dermatol Ges. 2014. PMID: 24981469 Review.
Cited by
-
Comparison of Autof Ms1000 and EXS3000 MALDI-TOF MS Platforms for Routine Identification of Microorganisms.Infect Drug Resist. 2023 Feb 15;16:913-921. doi: 10.2147/IDR.S352307. eCollection 2023. Infect Drug Resist. 2023. PMID: 36814830 Free PMC article.
-
[Conventional and molecular diagnostics in onychomycosis-part 2 : Molecular identification of causative dermatophytes by polymerase chain reaction and sequence analysis of the internal transcribed spacer region of ribosomal DNA].Dermatologie (Heidelb). 2024 Mar;75(3):238-252. doi: 10.1007/s00105-023-05265-9. Epub 2023 Dec 14. Dermatologie (Heidelb). 2024. PMID: 38095686 German.
-
Current Performance of MALDI-TOF Mass Spectrometry Databases for the Identification of Dermatophyte Species.J Fungi (Basel). 2025 May 5;11(5):356. doi: 10.3390/jof11050356. J Fungi (Basel). 2025. PMID: 40422690 Free PMC article.
-
Unravelling Childhood Tinea Capitis: A Multi-Dimensional Investigation Using Dermoscopy, Scanning Electron Microscopy and Mass Spectrometry.Infect Drug Resist. 2024 Feb 26;17:727-732. doi: 10.2147/IDR.S451200. eCollection 2024. Infect Drug Resist. 2024. PMID: 38433782 Free PMC article.
-
Mini-Review: The Diagnostic Methods of Tinea Capitis.Mycopathologia. 2023 Oct;188(5):563-569. doi: 10.1007/s11046-023-00731-3. Epub 2023 Apr 17. Mycopathologia. 2023. PMID: 37067665 Review.
References
-
- Bartosch T., Heydel T., Uhrlaß S., Nenoff P., Müller H., Baums C. G., et al. . (2018). MALDI-TOF MS Analysis of Bovine and Zoonotic Trichophyton Verrucosum Isolates Reveals a Distinct Peak and Cluster Formation of a Subgroup With Trichophyton benhamiae . Med. Mycol. 56 (5), 602–609. 10.1093/mmy/myx084 - DOI - PubMed
Publication types
MeSH terms
Supplementary concepts
LinkOut - more resources
Full Text Sources
Other Literature Sources
Miscellaneous

