. 2021 Apr 28:11:640847.
doi: 10.3389/fcimb.2021.640847. eCollection 2021.

Doxycycline Induces Apoptosis of Brucella Suis S2 Strain-Infected HMC3 Microglial Cells by Activating Calreticulin-Dependent JNK/p53 Signaling Pathway

Affiliations

Doxycycline Induces Apoptosis of Brucella Suis S2 Strain-Infected HMC3 Microglial Cells by Activating Calreticulin-Dependent JNK/p53 Signaling Pathway

Zhao Wang et al. Front Cell Infect Microbiol. .

Abstract

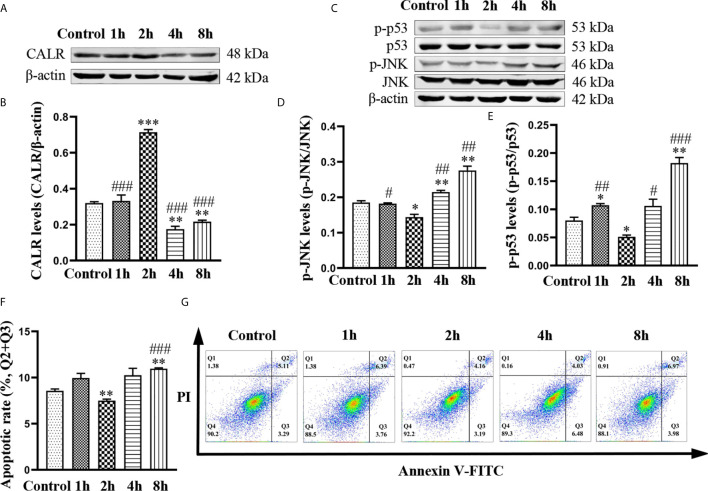
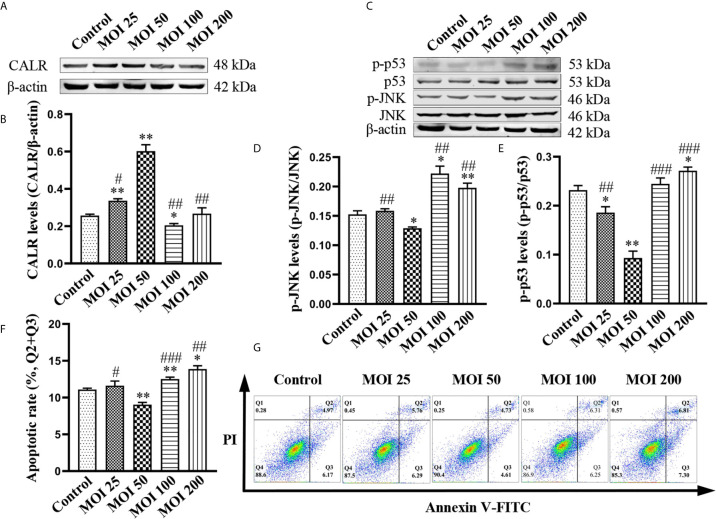
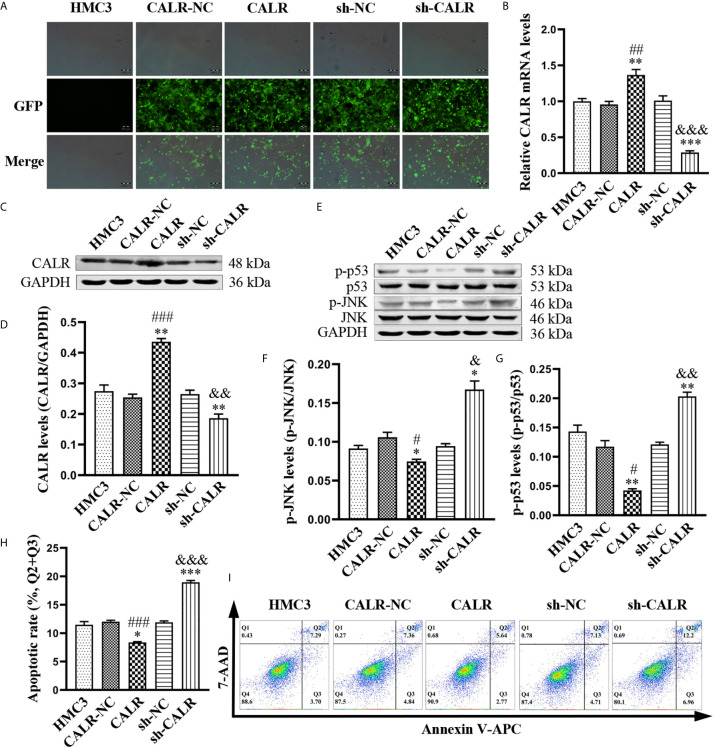
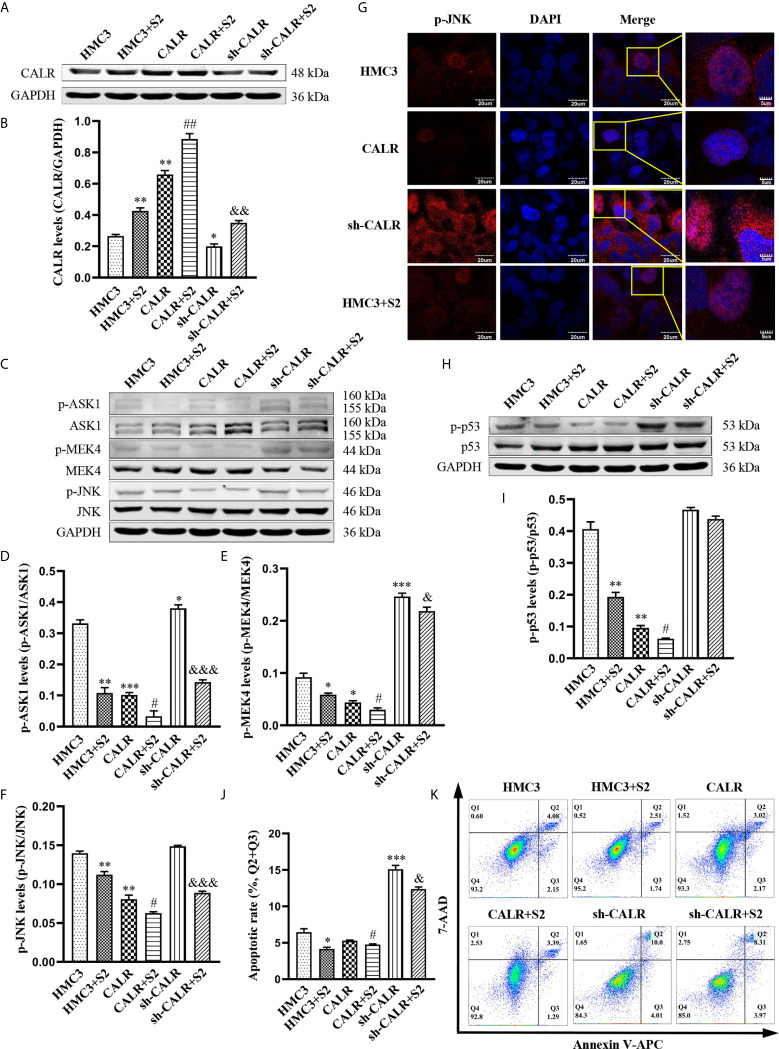
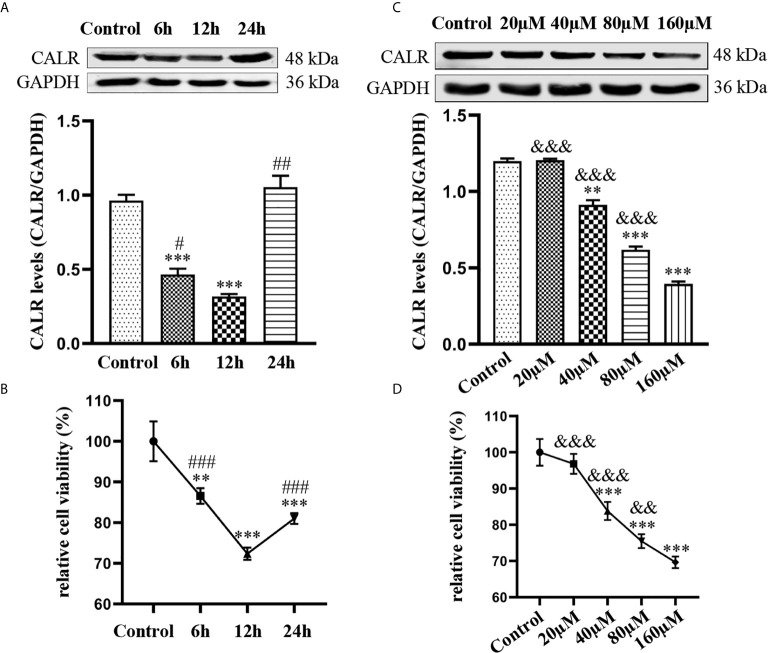
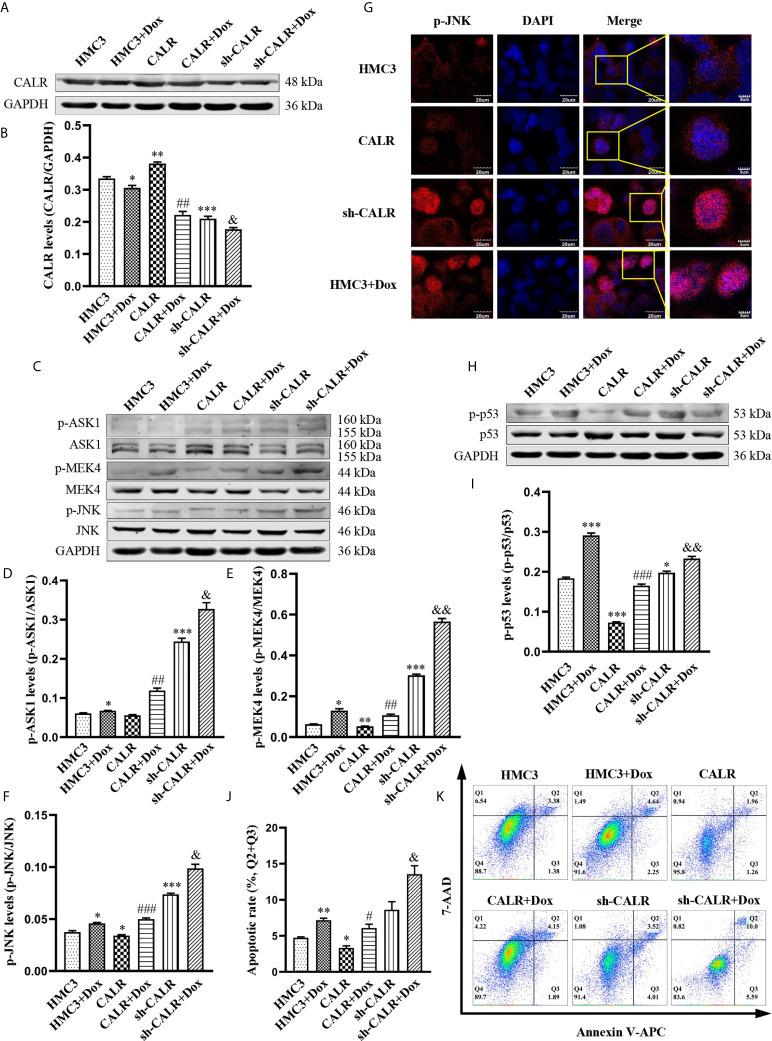
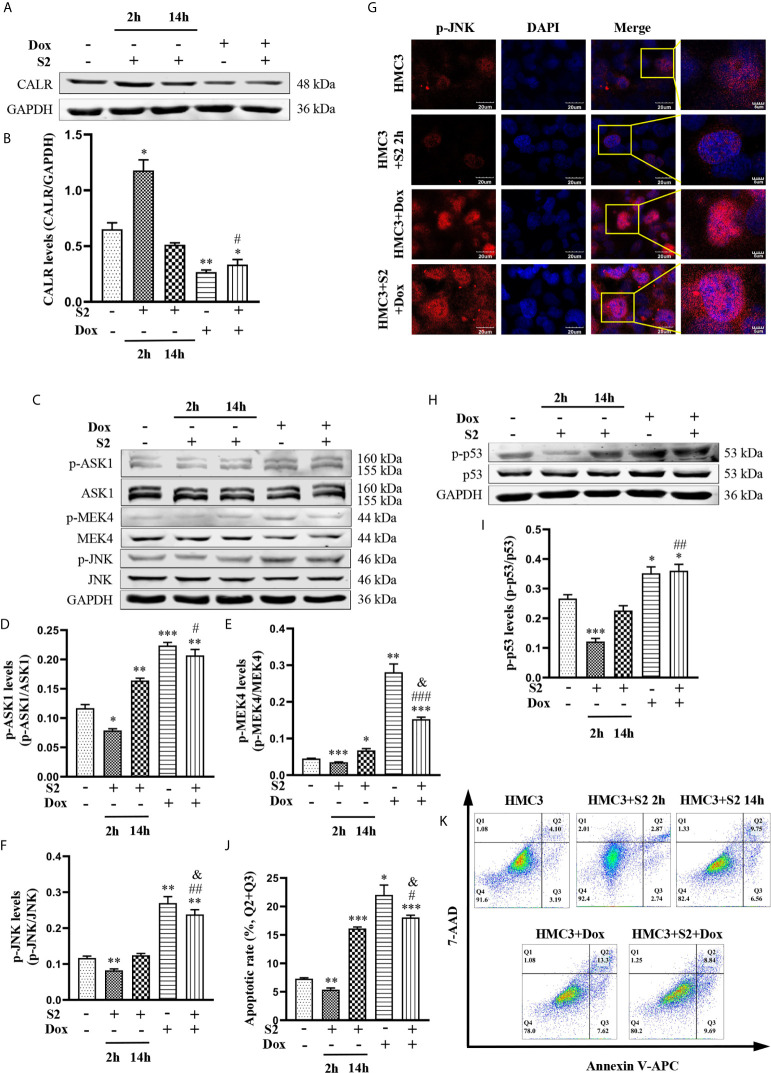
Neurobrucellosis is a chronic complication of human brucellosis that is caused by the presence of Brucella spp in the central nervous system (CNS) and the inflammation play a key role on the pathogenesis. Doxycycline (Dox) is a widely used antibiotic that induces apoptosis of bacteria-infected cells. However, the mechanisms of Brucella inhibition of microglial apoptosis and Dox induction of apoptosis are still poorly understood. In this study, we found that Brucella suis S2 strain (B. suis S2) increased calreticulin (CALR) protein levels and inhbited HMC3 cell apoptosis. Hence, we constructed two HMC3 cell line variants, one with stable overexpression (HMC3-CALR) and one with low expression of CALR (HMC3-sh-CALR). CALR was found to decrease levels of p-JNK and p-p53 proteins, as well as suppress apoptosis in HMC3 cells. These findings suggest that CALR suppresses apoptosis by inhibiting the JNK/p53 signaling pathway. Next, we treated HMC3, HMC3-CALR and HMC3-sh-CALR cell lines with B. suis S2 or Dox. Our results demonstrate that B. suis S2 restrains the JNK/p53 signaling pathway to inhibit HMC3 cell apoptosis via increasing CALR protein expression, while Dox plays the opposite role. Finally, we treated B. suis S2-infected HMC3 cells with Dox. Our results confirm that Dox induces JNK/p53-dependent apoptosis in B. suis S2-infected HMC3 cells through inhibition of CALR protein expression. Taken together, these results reveal that CALR and the JNK/p53 signaling pathway may serve as novel therapeutic targets for treatment of neurobrucellosis.

Keywords: Brucella suis S2 strain; JNK/p53 signaling pathway; apoptosis; doxycycline; human microglia; neurobrucellosis.


Conflict of interest statement

The authors declare that the research was conducted in the absence of any commercial or financial relationships that could be construed as a potential conflict of interest.

Figures

Figure 1
Figure 1
Effects of B. suis S2 on HMC3 cells at different timepoints. HMC3 cells were infected with B. suis S2 at a MOI of 50 for 1, 2, 4 and 8 h. (A) Western blots and (B) analysis of CALR protein in B. suis S2-infected HMC3 cells at different timepoints. (C) Western blot assay was used to measure protein levels of p-JNK and p-p53, and (D, E) the ratios of phosphorylated protein to total protein were calculated using densitometric analysis. (G) Plots of HMC3 cells apoptosis were generated using flow cytometry (Q1: necrotic cells, Q2: late apoptotic cells, Q3: early apoptotic cells, Q4: survival cells) and (F) analysis of apoptotic rates, the total apoptosis calculated as (Q2 + Q3). Data are presented as means ± SD; n = 3 independent repetitions; * P < 0.05, ** P < 0.01, *** P < 0.001 versus control; # P < 0.05, ## P < 0.01, ### P < 0.001 versus 2 h.
Figure 2
Figure 2
Effects of B. suis S2 on HMC3 cells at different MOI. HMC3 cells were exposed to B. suis S2 at MOI of 25, 50, 100 and 200 for 2 h. (A) Western blot analysis and (B) quantification of CALR protein expression in each group. (C) Protein levels of p-JNK and p-p53 were detected by western blotting and (D, E) the ratio of phosphorylated-to-total proteins was used to indicate quantification of phosphorylation proteins. (G) Apoptosis of HMC3 cells was determined with flow cytometry (Q1: necrotic cells, Q2: late apoptotic cells, Q3: early apoptotic cells, Q4: survival cells) and (F) the apoptosis rates were revealed as (Q2 + Q3). Data are indicated with means ± SD; n = 3 independent experiments; * P < 0.05, ** P < 0.01 versus control; # P < 0.05, ## P < 0.01, ### P < 0.001 versus MOI 50.
Figure 3
Figure 3
CALR inhibits p-JNK and p-p53, thus preventing apoptosis of HMC3 cells. (A) ZsGreen-expressing cells were observed with fluorescence microscopy after 72 h of lentiviral transfection. Scale bars = 200 µm. (B) CALR mRNA expression in each cell line was evaluated by RT-qPCR assay. (C) Protein expression of CALR was analyzed using western blot assay and (D) GAPDH was used as an internal reference protein to quantify CALR bands. (E) Protein levels of p-JNK and p-p53 were analyzed with western blot assay; (F, G) phosphorylated protein contents are indicated by specific phosphorylated-to-total-protein ratios. (H) Cell apoptosis was detected and (I) the apoptotic rates were calculated with flow cytometry (Q1: necrotic cells, Q2: late apoptotic cells, Q3: early apoptotic cells, Q4: survival cells), the total apoptosis calculated as (Q2 + Q3). Data are presented as means ± SD; n = 3 independent experiments; * P < 0.05, ** P < 0.01, *** P < 0.001 versus HMC3; # P < 0.05, ## P < 0.01, ### P < 0.001 versus CALR-NC; & P < 0.05, && P < 0.01, &&& P < 0.001 versus sh-NC.
Figure 4
Figure 4
B. suis S2 induces CALR protein expression and further inhibits JNK/p53-dependent apoptosis. HMC3, HMC3-CALR and HMC3-sh-CALR cell lines were infected with B. suis S2 at a MOI of 50 for 2 h. (A) Western blot assay was used to determine CALR protein expression and (B) to quantify protein levels relative to GAPDH. (C) Protein levels of p-ASK1, p-MEK4 and p-JNK were measured with western blot assay and (D–F) protein phosphorylation was quantified with densitometry. (G) Nuclear localization of p-JNK protein was determined by immunofluorescence assay. Scale bars = 20 µm. (H) Protein levels of p-p53 were determined by western blot (I) assay and quantitative analysis of p-p53 protein. (J, K) Apoptosis rates of all groups were analyzed by flow cytometry (Q1: necrotic cells, Q2: late apoptotic cells, Q3: early apoptotic cells, Q4: survival cells), the total apoptosis calculated as (Q2 + Q3). Data are presented in means ± SD; All experiments were repeated 3 times independently; * P < 0.05, ** P < 0.01, *** P < 0.001 versus HMC3; # P < 0.05, ## P < 0.01 versus CALR; & P < 0.05, &&& P < 0.001 versus sh-CALR.
Figure 5
Figure 5
Effects of Dox on CALR protein expression and viability of HMC3 cells. (A) HMC3 cells were treated with 40µM Dox over different periods of time (0, 6, 12 and 24 h), and CALR protein expression was determined by western blot assay (mean ± SD, n = 3). (B, D) HMC3 cell viability was analyzed using a CCK-8 assay; results were calculated as survival rates relative to control (mean ± SD, n = 6). (C) HMC3 cells were treated with different concentrations of Dox (0, 20, 40, 80 and 160µM) for 12 h and CALR protein levels were measured using western blot assay (mean ± SD, n = 3). ** P < 0.01, *** P < 0.001 versus control; # P < 0.05, ## P < 0.01 versus 12 h ### P < 0.001; && P < 0.01, &&& P < 0.001 versus 160µM.
Figure 6
Figure 6
Dox inhibits CALR protein expression and further induces JNK/p53-dependent apoptosis. (A) Expression of CALR protein in each group was detected by western blot assay; (B) GAPDH was used as an internal reference to calculate CALR relative protein expression. (C) Expression levels of p-ASK1, p-MEK4 and p-JNK were determined using western blot; (D–F) relative optical density was separately computed by calculating the ratio of p-ASK1, p-MEK4 and p-JNK phosphorylation to total protein. (G) Nuclear localization of the p-JNK protein was determined with immunofluorescence microscopy. Scale bars = 20 µm. (H) p-p53 protein levels were analysed using western blotting and (I) densitometry was use to perform quantitative analysis of p-p53 levels. (J, K) HMC3 cell apoptosis was assessed by flow cytometry (Q1: necrotic cells, Q2: late apoptotic cells, Q3: early apoptotic cells, Q4: survival cells) and the rates of apoptosis in the different experimental groups were subjected to statistical analysis, the total apoptosis calculated as (Q2 + Q3). Data represent the means ± SD from three replicates; * P < 0.05, ** P < 0.01, *** P < 0.001 versus HMC3; # P < 0.05, ## P < 0.01, ### P < 0.001 versus CALR; & P < 0.05, && P < 0.01 versus sh-CALR.
Figure 7
Figure 7
The mechanism of B. suis S2-infected HMC3 cells apoptosis induced by Dox. (A) CALR protein levels in each group were determined by western blotting and (B) relative expression of CALR protein was computed using GAPDH as an internal reference. (C) Levels of p-ASK1, p-MEK4 and p-JNK proteins were determined with western blot and (D–F) ratios of phosphorylated proteins to total proteinswere evaluated for ASK1, MEK4 and JNK. (G) Translocation of p-JNK into nuclei was determined with immunofluorescence microscopy. Scale bars = 20 µm. (H) Protein levels of p-p53 were determined by western blot and (I) the p-p53 protein bands were quantified using GAPDH as the internal reference protein. (J) Apoptosis in HMC3 cells was evaluated by flow cytometry (Q1: necrotic cells, Q2: late apoptotic cells, Q3: early apoptotic cells, Q4: survival cells) (K) apoptosis rates are shown, the total apoptosis calculated as (Q2 + Q3). Data are expressed as means ± SD from four independent experiments; * P < 0.05, ** P < 0.01, *** P < 0.001 versus HMC3; # P < 0.05, ## P < 0.01, ### P < 0.001 versus HMC3+S2 14 h; & P < 0.05 versus HMC3+Dox.

Similar articles

Cited by

References

    1. Ahmed W., Zheng K., Liu Z. F. (2016). Establishment of Chronic Infection: Brucella’s Stealth Strategy. Front. Cell. Infect. Microbiol. 6, 30. 10.3389/fcimb.2016.00030 - DOI - PMC - PubMed
    1. Alexander-Savino C. V., Hayden M. S., Richardson C., Zhao J. Y., Poligone B. (2016). Doxycycline is an NF-Kappa b Inhibitor That Induces Apoptotic Cell Death in Malignant T-Cells. Oncotarget 7, 75954–75967. 10.18632/oncotarget.12488 - DOI - PMC - PubMed
    1. Behar S. M., Martin C. J., Booty M. G., Nishimura T., Zhao X., Gan H., et al. . (2011). Apoptosis is an Innate Defense Function of Macrophages Against Mycobacterium Tuberculosis. Mucosal. Immunol. 4, 279–287. 10.1038/mi.2011.3 - DOI - PMC - PubMed
    1. Butovsky O., Jedrychowski M. P., Moore C. S., Cialic R., Lanser A. J., Gabriely G., et al. . (2014). Identification of a Unique TGF-Beta-Dependent Molecular and Functional Signature in Microglia. Nat. Neurosci. 17, 131–143. 10.1038/nn.3599 - DOI - PMC - PubMed
    1. Celli J. (2019). The Intracellular Lifecycle of Brucella Spp. Microbiol. Spectr. 7, 1–17. 10.1128/microbiolspec.BAI-0006-2019 - DOI - PMC - PubMed

Publication types