. 2021 Apr 30:9:615724.
doi: 10.3389/fped.2021.615724. eCollection 2021.

Specific Immune Response and Cytokine Production in CD70 Deficiency

Affiliations

Specific Immune Response and Cytokine Production in CD70 Deficiency

Hassan Abolhassani. Front Pediatr. .

Abstract

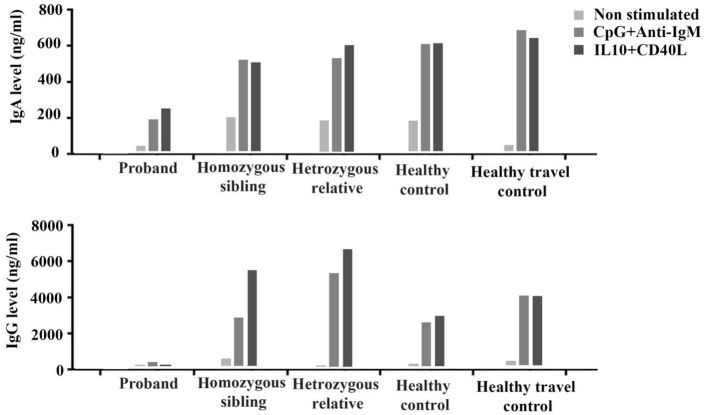
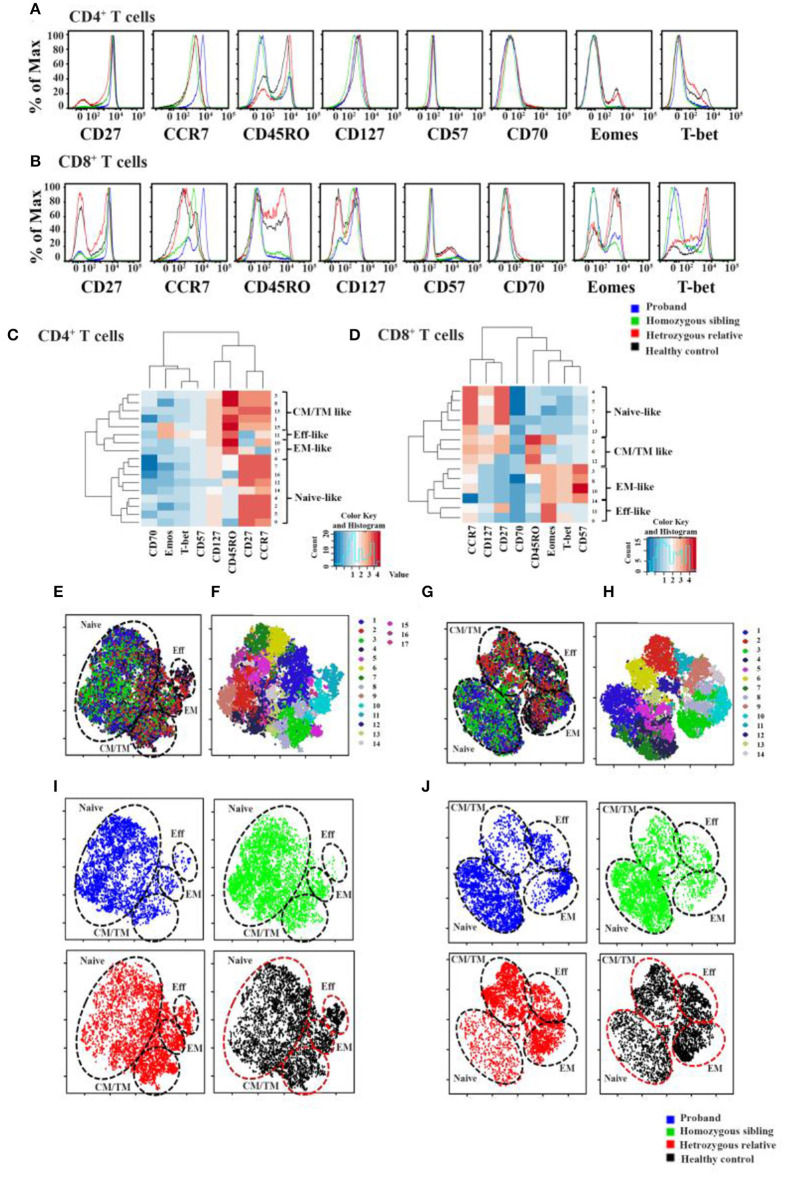
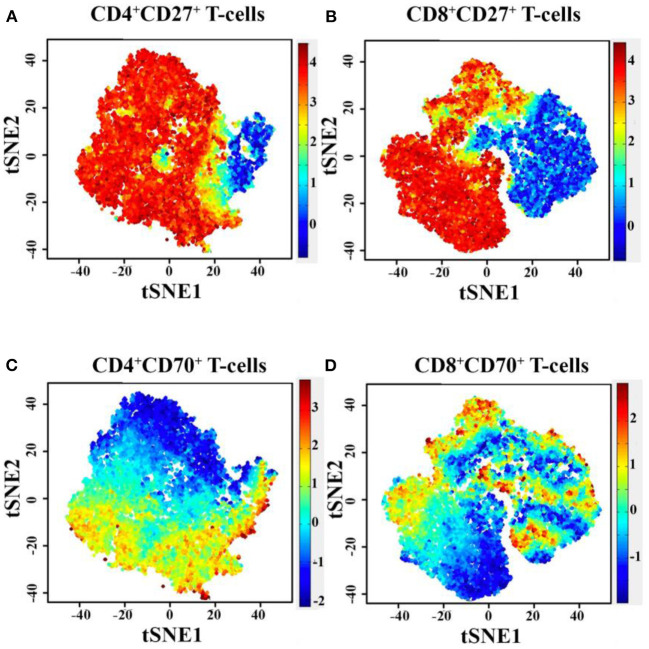
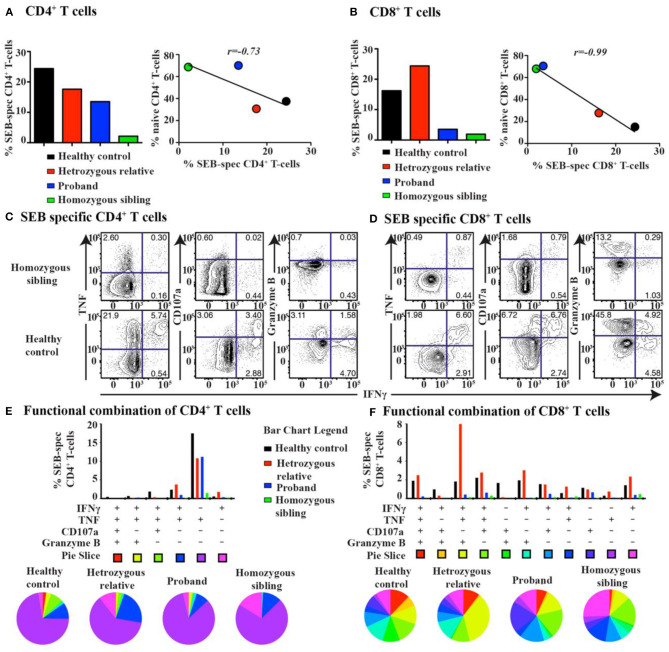
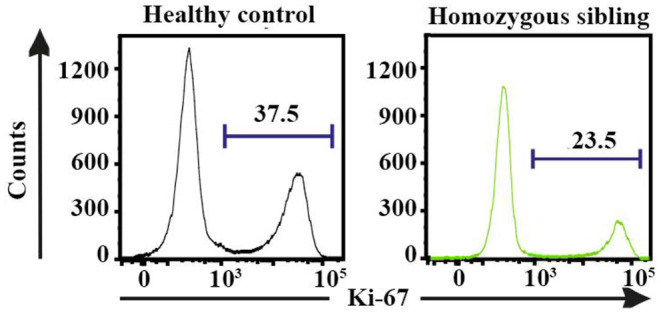
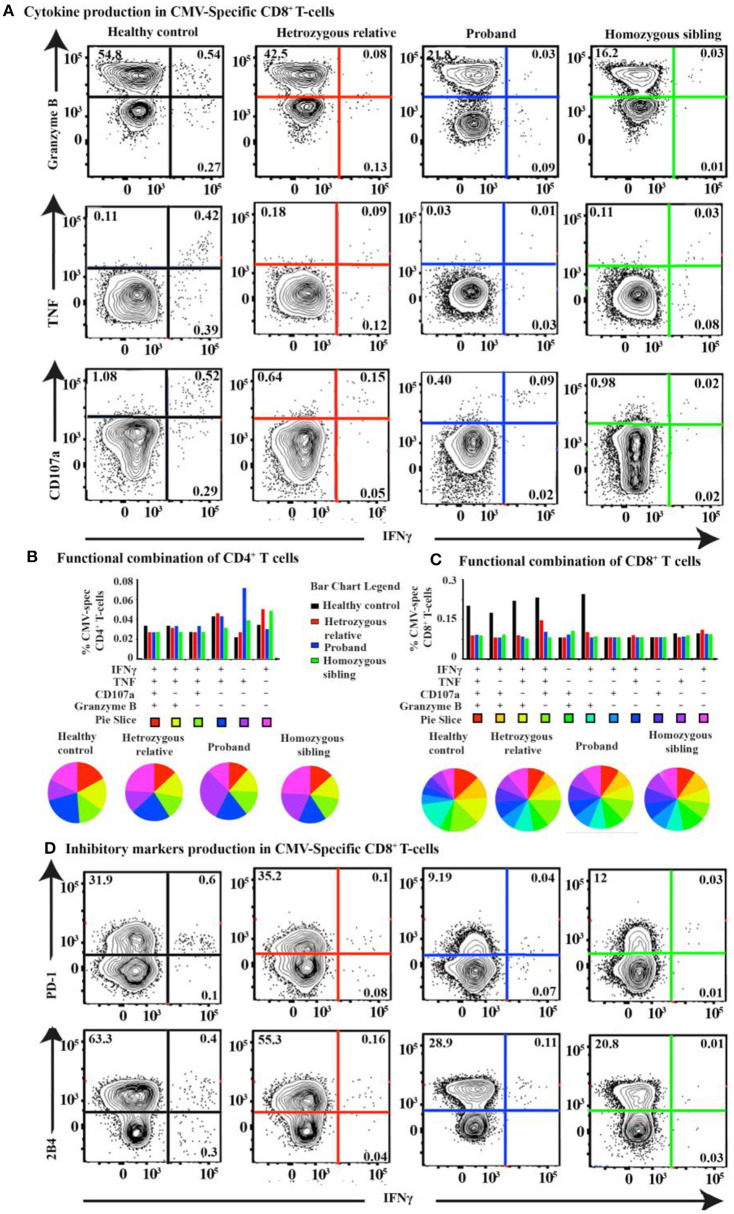
Collective clinical and immunologic findings of defects in the CD27-CD70 axis indicate a primary immunodeficiency associated with terminal B-cell development defect and immune dysregulation leading to autoimmunity, uncontrolled viral infection, and lymphoma. Since the molecular mechanism underlying this entity of primary immunodeficiency has been recently described, more insight regarding the function and profile of immunity is required. Therefore, this study aimed to investigate stimulated antibody production, polyclonal vs. virus-specific T-cell response, and cytokine production of a CD70-deficient patient reported previously with early-onset antibody deficiency suffering from chronic viral infections and B-cell lymphoma. The patient and her family members were subjected to clinical evaluation, immunological assays, and functional analyses. The findings of this study indicate an impaired ability of B cells to produce immunoglobulins, and a poor effector function of T cells was also associated with the severity of clinical phenotype. Reduced proportions of cells expressing the memory marker CD45RO, as well as T-bet and Eomes, were observed in CD70-deficient T cells. The proportion of 2B4+ and PD-1+ virus-specific CD8+ T cells was also reduced in the patient. Although the CD70-mutated individuals presented with early-onset clinical manifestations that were well-controlled by using conventional immunological and anticancer chemotherapies, with better prognosis as compared with CD27-deficient patients, targeted treatment toward specific disturbed immune profile may improve the management and even prevent secondary complications.

Keywords: CD70 deficiency; Eomes; PD-1; T-bet; class-switching recombination; inborn errors of immunity; primary immunodeficiency.


Conflict of interest statement

The author declares that the research was conducted in the absence of any commercial or financial relationships that could be construed as a potential conflict of interest.

Figures

Figure 1
Figure 1
In vitro production of IgA and IgG before (non-stimulated) and after stimulation with T-independent (CpG+anti-IgM) and T-dependent (IL-10+CD40L) cytokines in the proband, the homozygous sibling, a heterozygous relative, and two healthy controls.
Figure 2
Figure 2
Immunologic markers of cells in CD70-deficient family. Histogram overlays of all differentiation markers (CCR7, CD27, CD57, CD70, CD127, CD45RO, Eomes, and T-bet) for CD4+ (A) and CD8+ cells (B) in two homozygous patients, a heterozygous relative father, and a healthy control. Using an automated density-based algorithm called PhenoGraph, 17 CD4+ T-cell (C) and 14 CD8+ T-cell (D) subclusters were identified based on the intensity of CCR7, CD27, CD57, CD70, CD127, CD45RO, Eomes, and T-bet expression. Hierarchical Spearman clustering was performed to delineate the relationship between the different T-cell clusters using dendograms and heat maps. The relationships between different clusters were identified as naive-, central/transitional memory- (CM/TM-), effector memory- (EM-), and effector (Eff-) like T-cell populations. Localization of each PhenoGraph-derived subcluster and overlapped plotted viSNE map of individuals within the viSNE map for CD4+ and CD8+ T cells was shown in (E,F) and (G,H), respectively (for more information about each PhenoGraph population, see Supplementary Tables 4, 5). In (I,J), each subject's phenotypic data were plotted on the viSNE map, represented with different colors (blue, proband; green, homozygous brother; red, heterozygous father; black, healthy control). Naive-, CM/TM-, EM-, and Eff-like T-cell populations were marked within the viSNE plot based on the subclusters that were determined using PhenoGraph in sections (E–H).
Figure 3
Figure 3
Diagram of PhenoGraph-derived subcluster within the viSNE map, showing the level of CD27 (A,B) and CD70 (C,D) protein expression on CD4+ and CD8+ T cells. t-SNE, t-distributed stochastic neighbor embedding.
Figure 4
Figure 4
T-cell response and cytokine production after super-antigen simulation in CD70 deficiency. The total frequency of super-antigen (SEB)-specific (A) CD4+ and (B) CD8+ T cells (left). Pearson correlation analysis between the frequency of SEB-specific T cells and naive T cells for all subjects (right). Representative biaxial plots of SEB-specific (C) CD4+ and (D) CD8+ T-cell expression of IFNγ together with TNF, CD107a, or granzyme B for a homozygous patient and a healthy control. Corresponding SPICE analysis of all functional combinations (based on Boolean gating) for each patient's SEB-specific (E) CD4+ and (F) CD8+ T-cell response (below). Functional combinations with no detectable response (<0.05%) are not depicted in the graph.
Figure 5
Figure 5
The proliferative (Ki-67+) response for staphylococcal enterotoxin B-specific CD8+ T cells following 3-day stimulations in the homozygous patient and a healthy control.
Figure 6
Figure 6
T-cell response and cytokine production after CMV-pp65 antigen simulation in CD70 deficiency. (A) FACS plots of the IFNγ vs. granzyme B, TNF, and CD107a CMV-pp65-specific CD8+ T-cell response for the proband, the homozygous sibling, a heterozygous relative, and a healthy control. Corresponding SPICE analysis of all functional combinations (based on Boolean gating) for each patient's CMV-specific (B) CD4+ and (C) CD8+ T-cell response. (D) FACS plots of the IFNγ vs. PD-1 and 2B4 CMV-pp65-specific CD8+ T-cell responses.

References

    1. Hammarstrom L, Abolhassani H, Baldanti F, Marcotte H, Pan-Hammarstrom Q. Development of passive immunity against SARS-CoV-2 for management of immunodeficient patients-a perspective. J Allergy Clin Immunol. (2020) 146:58–60. 10.1016/j.jaci.2020.04.043 - DOI - PMC - PubMed
    1. Tangye SG, Al-Herz W, Bousfiha A, Chatila T, Cunningham-Rundles C, Etzioni A, et al. . Human inborn errors of immunity: 2019 update on the classification from the international union of immunological societies expert committee. J Clin Immunol. (2020) 40:24–64. 10.1007/s10875-019-00737-x - DOI - PMC - PubMed
    1. Abolhassani H, Aghamohammadi A, Fang M, Rezaei N, Jiang C, Liu X, et al. . Clinical implications of systematic phenotyping and exome sequencing in patients with primary antibody deficiency. Genet Med. (2019) 21:243–51. 10.1038/s41436-018-0012-x - DOI - PubMed
    1. Yazdani R, Habibi S, Sharifi L, Azizi G, Abolhassani H, Olbrich P, et al. . Common variable immunodeficiency: epidemiology, pathogenesis, clinical manifestations, diagnosis, classification, and management. J Investig Allergol Clin Immunol. (2020) 30:14–34. 10.18176/jiaci.0388 - DOI - PubMed
    1. Yazdani R, Abolhassani H, Kiaee F, Habibi S, Azizi G, Tavakol M, et al. . Comparison of common monogenic defects in a large predominantly antibody deficiency cohort. J Allergy Clin Immunol Pract. (2019) 7:864–78.e9. 10.1016/j.jaip.2018.09.004 - DOI - PubMed