. 2021 Apr 30:9:634649.
doi: 10.3389/fcell.2021.634649. eCollection 2021.

Superresolution Microscopy Reveals Distinct Phosphoinositide Subdomains Within the Cilia Transition Zone

Affiliations

Superresolution Microscopy Reveals Distinct Phosphoinositide Subdomains Within the Cilia Transition Zone

Sarah E Conduit et al. Front Cell Dev Biol. .

Abstract

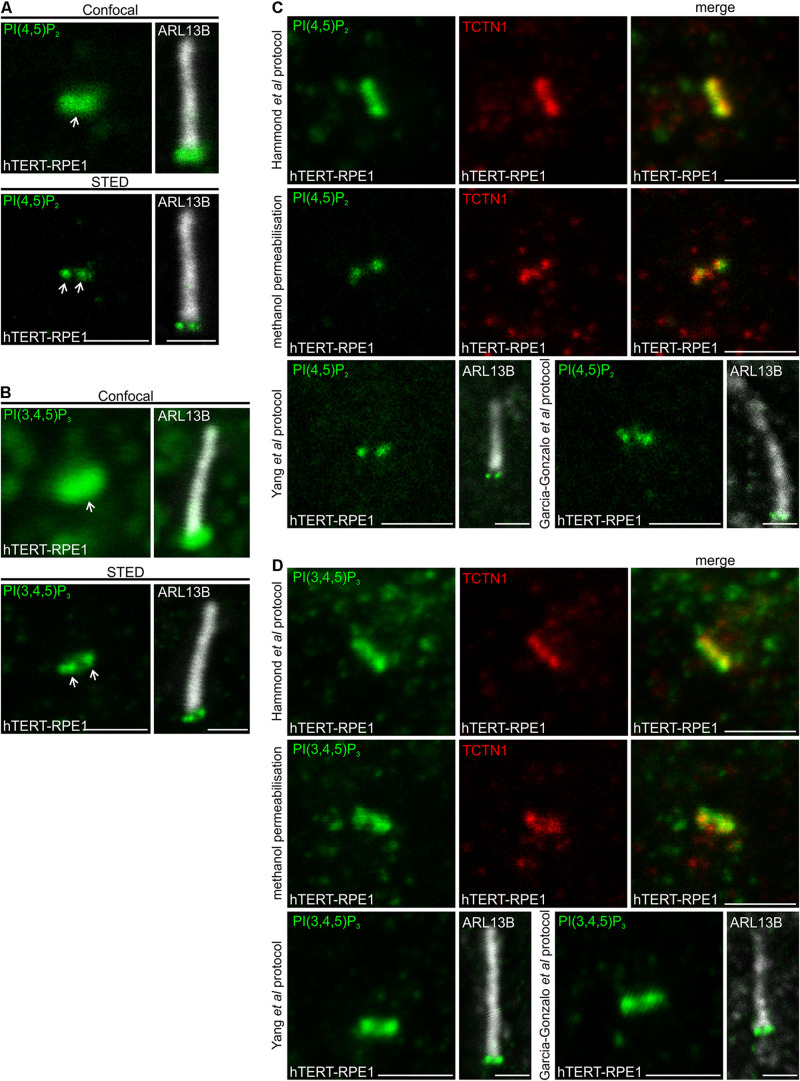
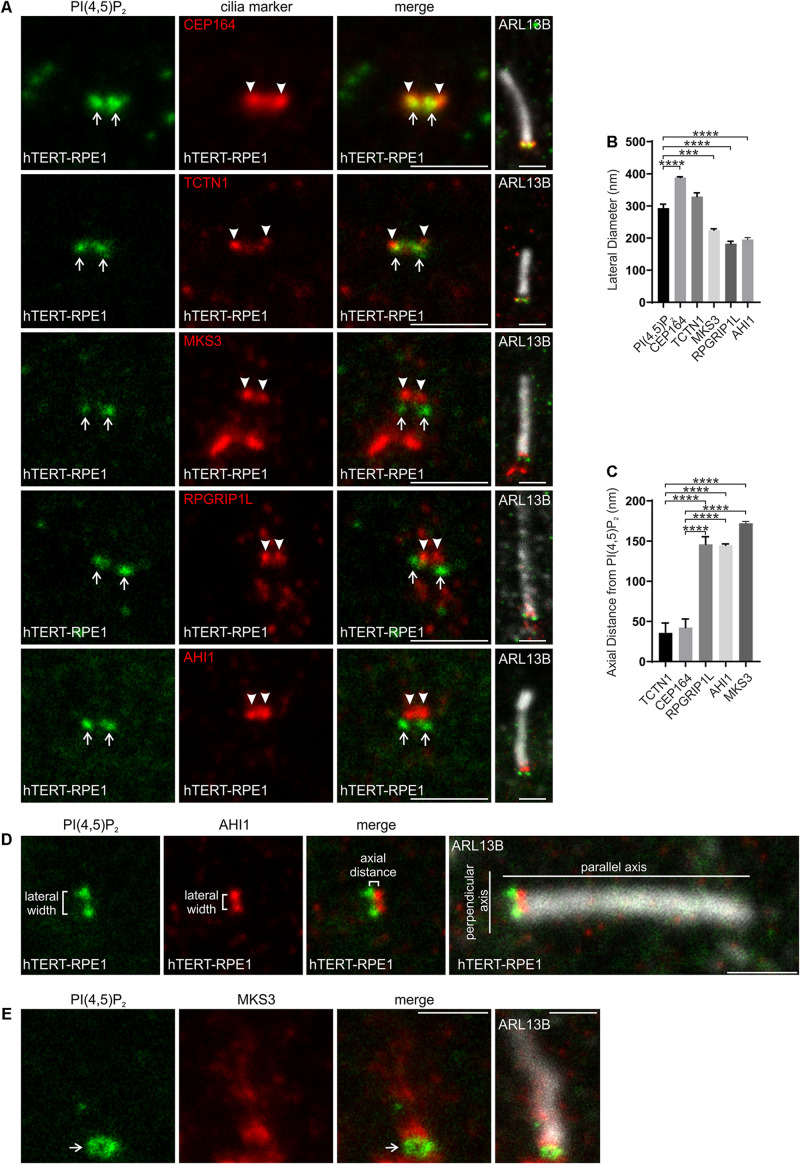
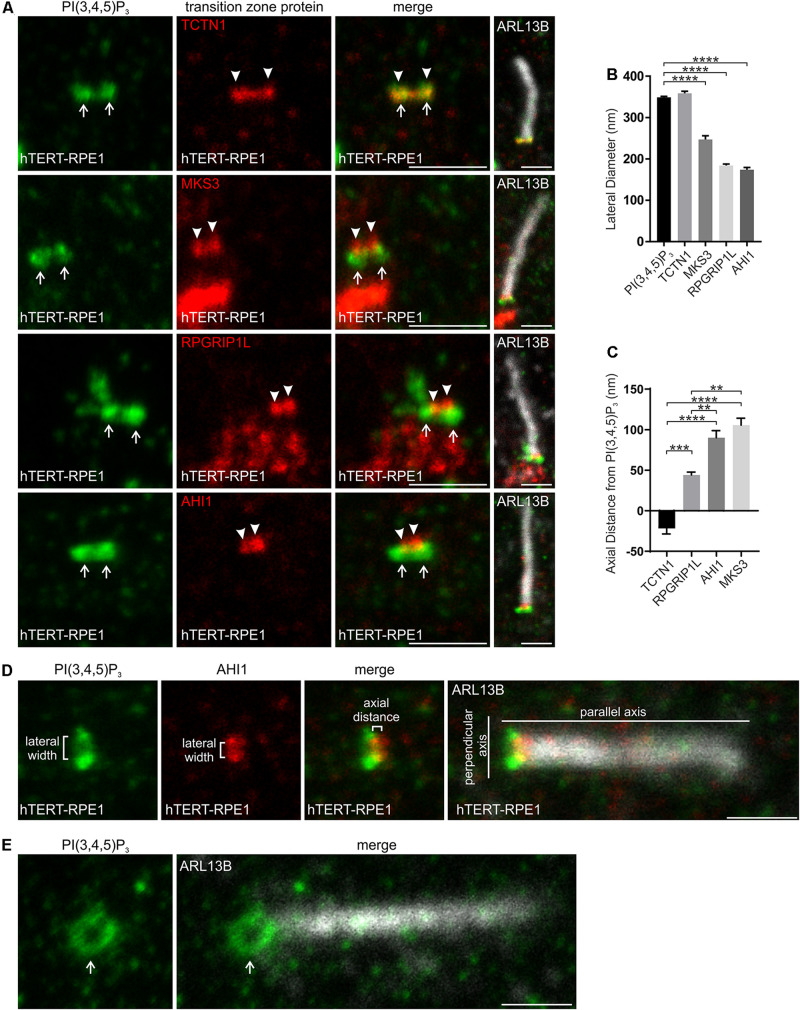
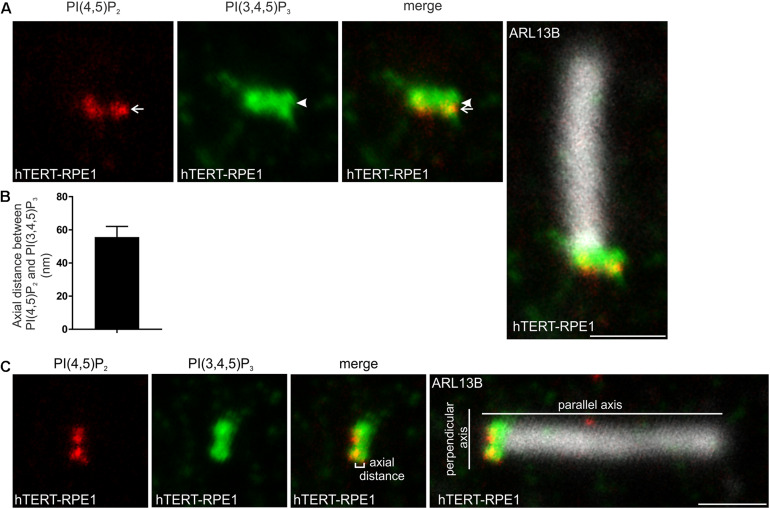
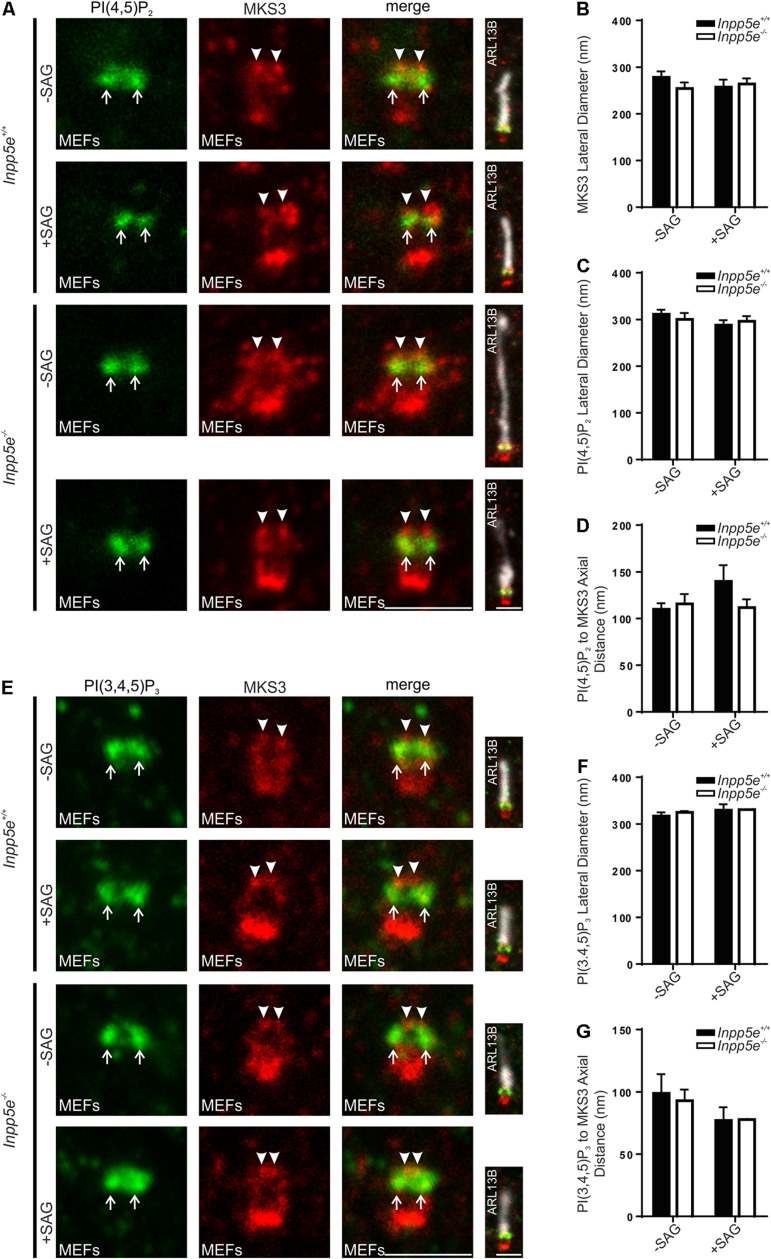
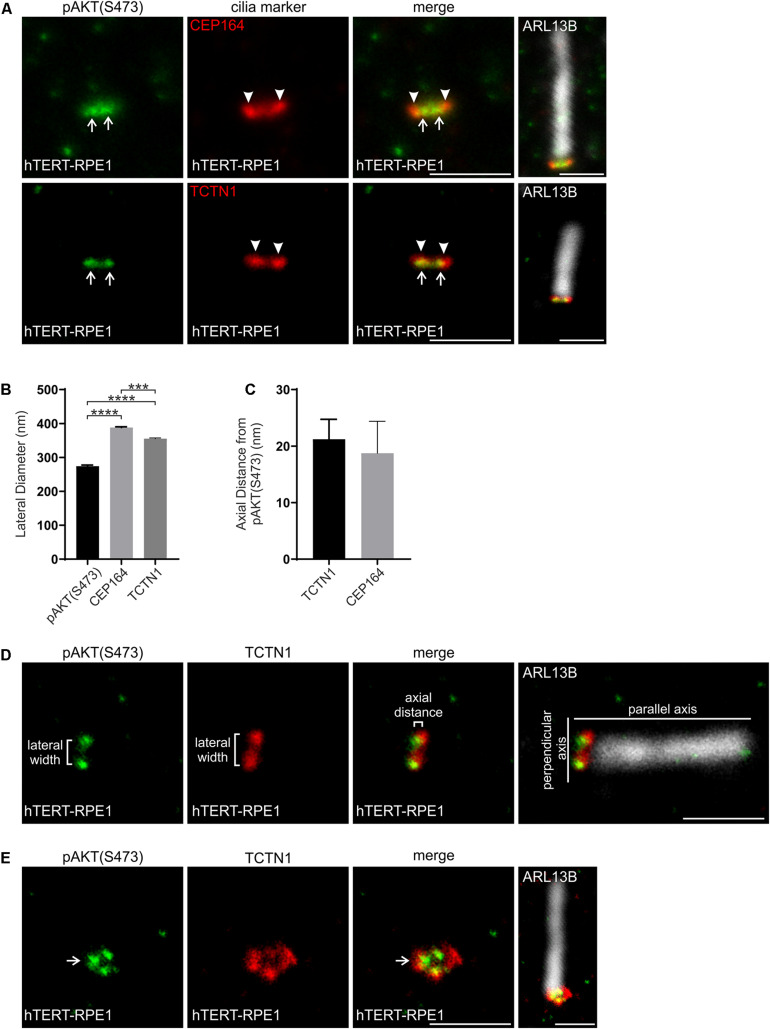
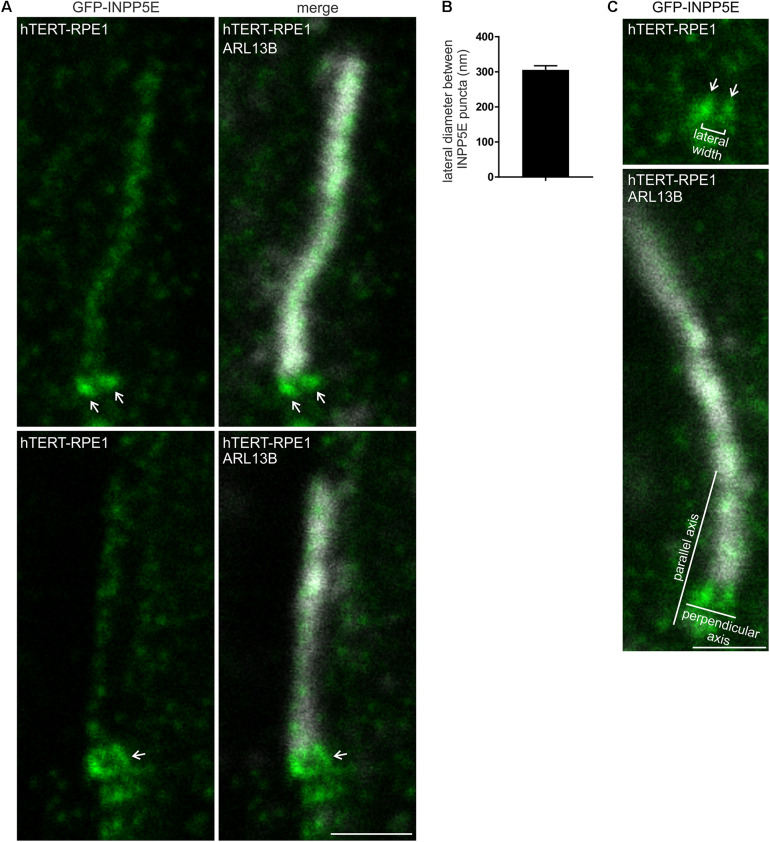
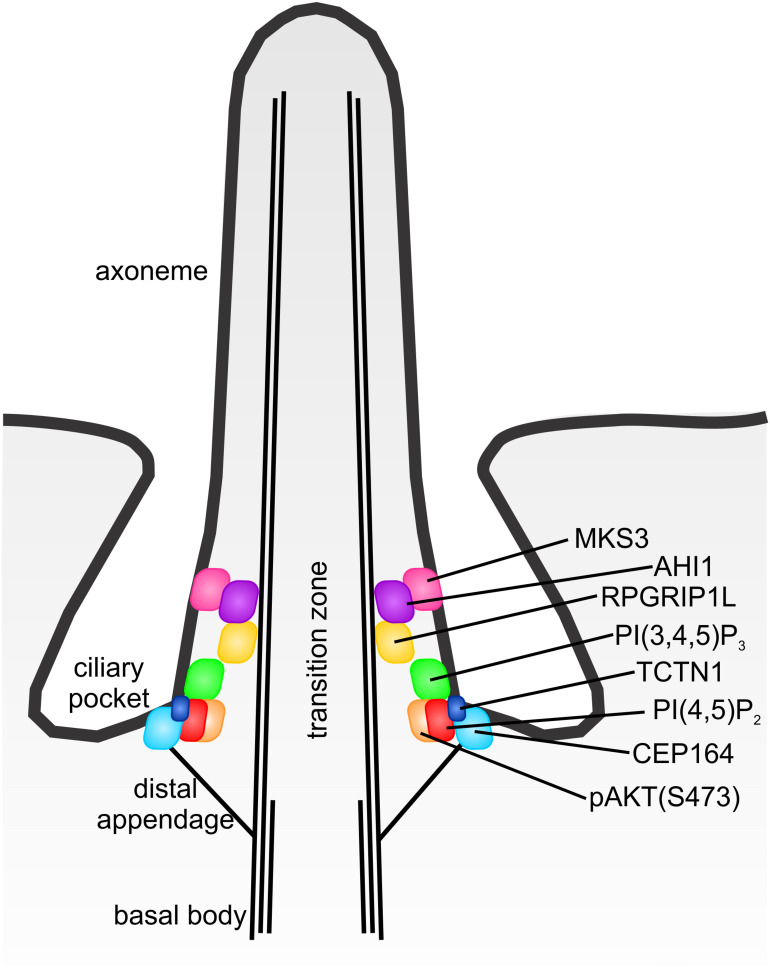
Primary cilia are evolutionary conserved microtubule-based organelles that protrude from the surface of most mammalian cells. Phosphoinositides (PI) are membrane-associated signaling lipids that regulate numerous cellular events via the recruitment of lipid-binding effectors. The temporal and spatial membrane distribution of phosphoinositides is regulated by phosphoinositide kinases and phosphatases. Recently phosphoinositide signaling and turnover has been observed at primary cilia. However, the precise localization of the phosphoinositides to specific ciliary subdomains remains undefined. Here we use superresolution microscopy (2D stimulated emission depletion microscopy) to map phosphoinositide distribution at the cilia transition zone. PI(3,4,5)P3 and PI(4,5)P2 localized to distinct subregions of the transition zone in a ring-shape at the inner transition zone membrane. Interestingly, the PI(3,4,5)P3 subdomain was more distal within the transition zone relative to PtdIns(4,5)P2. The phosphoinositide effector kinase pAKT(S473) localized in close proximity to these phosphoinositides. The inositol polyphosphate 5-phosphatase, INPP5E, degrades transition zone phosphoinositides, however, studies of fixed cells have reported recombinant INPP5E localizes to the ciliary axoneme, distant from its substrates. Notably, here using live cell imaging and optimized fixation/permeabilization protocols INPP5E was found concentrated at the cilia base, in a distribution characteristic of the transition zone in a ring-shaped domain of similar dimensions to the phosphoinositides. Collectively, this superresolution map places the phosphoinositides in situ with the transition zone proteins and reveals that INPP5E also likely localizes to a subdomain of the transition zone membrane, where it is optimally situated to control local phosphoinositide metabolism.

Keywords: INPP5E; phosphoinositides; primary cilia; superresolution microscopy; transition zone.


Conflict of interest statement

The authors declare that the research was conducted in the absence of any commercial or financial relationships that could be construed as a potential conflict of interest.

Figures

FIGURE 1
FIGURE 1
PI(4,5)P2 and PI(3,4,5)P3 localize to the transition zone in ciliated hTERT-RPE1 cells. (A,B) Ciliated hTERT-RPE1 cells were immunostained with (A) PI(4,5)P2 or (B) PI(3,4,5)P3 (green) and ARL13B (grayscale) antibodies and imaged by confocal and STED microscopy. Right panels show merged image at lower magnification. Arrows indicate transition zone PI(4,5)P2 signals, bar indicates 1 μm. (C,D) Ciliated hTERT-RPE1 cells were immunostained with (C) PI(4,5)P2 (green) or (D) PI(3,4,5)P3 (green) and TCTN1 (red) or ARL13B (grayscale) antibodies using the Hammond et al. (2009) Golgi protocol, the methanol permeabilization protocol, the Yang et al. (2015) or Garcia-Gonzalo et al. (2011) protocol and imaged by confocal microscopy, bar indicates 1 μm.
FIGURE 2
FIGURE 2
PI(4,5)P2 localizes to a specific subdomain of the transition zone. (A) Ciliated hTERT-RPE1 cells were immunostained with PI(4,5)P2 (green), ARL13B (grayscale) and CEP164, TCTN1, MKS3, RPGRIP1L or AHI1 (red) antibodies and imaged by STED microscopy (confocal resolution image of the ARL13B stained axoneme is shown). Right panels show merged image at lower magnification. Arrows indicate transition zone PI(4,5)P2 signals, arrow heads indicate transition zone protein localization, bar indicates 1 μm. (B) Graph shows the lateral diameter between the highest intensity points of the PI(4,5)P2 or cilia protein marker puncta perpendicular to the plane of the axoneme. Bars represent mean ± SEM, n = 3 independent experiments, ≥30 cilia imaged per experiment and all cilia with two distinct PI(4,5)P2 or cilia marker protein puncta measured, statistical significance was determined using one-way ANOVA (p < 0.0001) followed by Tukey’s post hoc test ***p < 0.001, ****p < 0.0001. (C) Graph shows the axial distance between the highest intensity point of the PI(4,5)P2 signal and each cilia marker protein signal parallel to the plane of the axoneme. Bars represent mean ± SEM, n = 3 independent experiments, ≥ 30 cilia imaged per experiment and all cilia with distinct PI(4,5)P2 or cilia marker protein puncta measured, statistical significance was determined using one-way ANOVA (p < 0.0001) followed by Tukey’s post hoc test, ****p < 0.0001. (D) Representative image showing the method used for lateral diameter and axial distance measurements, bar indicates 1 μm. (E) Ciliated hTERT-RPE1 cells were immunostained with PI(4,5)P2 (green), MKS3 (red) and ARL13B (grayscale) antibodies and imaged by STED microscopy (confocal resolution image of the ARL13B stained axoneme is shown). Right panel shows merged image at lower magnification. Arrow indicates ring shaped transition zone PI(4,5)P2 morphology, bar indicates 1 μm.
FIGURE 3
FIGURE 3
PI(3,4,5)P3 localizes to a specific subdomain of the transition zone. (A) Ciliated hTERT-RPE1 cells were immunostained with PI(3,4,5)P3 (green), ARL13B (grayscale) and TCTN1, MKS3, RPGRIP1L or AHI1 (red) antibodies and imaged by STED microscopy (confocal resolution image of the ARL13B stained axoneme is shown). Right panels show merged image at lower magnification. Arrows indicate transition zone PI(3,4,5)P3 signal, arrow heads indicate transition zone protein localization, bar indicates 1 μm. (B) Graph shows the lateral diameter between the highest intensity points of the PI(3,4,5)P3 or transition zone protein puncta perpendicular to the plane of the axoneme. Bars represent mean ± SEM, n = 3 independent experiments, 30 cilia imaged per experiment and all cilia with two distinct PI(3,4,5)P3 or transition zone protein puncta measured, statistical significance was determined using one-way ANOVA (p < 0.0001) followed by Tukey’s post hoc test, ****p < 0.0001. (C) Graph shows the axial distance between the highest intensity point of the PI(3,4,5)P3 signal and each transition zone protein signal parallel to the plane of the axoneme. Bars represent mean ± SEM, n = 3 independent experiments, 30 cilia imaged per experiment and all cilia with distinct PI(3,4,5)P3 or transition zone protein puncta measured, statistical significance was determined using one-way ANOVA (p < 0.0001) followed by Tukey’s post hoc test, **p < 0.01, ***p < 0.001, ****p < 0.0001. (D) Representative image showing the method used for the lateral diameter and axial distance measurements, bar indicates 1 μm. (E) Ciliated hTERT-RPE1 cells were immunostained with PI(3,4,5)P3 (green) and ARL13B (grayscale) antibodies and imaged by STED microscopy (confocal resolution image of the ARL13B stained axoneme is shown). Arrow indicates ring shaped transition zone PI(3,4,5)P2 morphology, bar indicates 1 μm.
FIGURE 4
FIGURE 4
PI(4,5)P2 and PI(3,4,5)P3 localize to distinct subdomains within the transition zone. (A) Ciliated hTERT-RPE1 cells were immunostained with PI(4,5)P2 (red), PI(3,4,5)P3 (green) and ARL13B (grayscale) antibodies and imaged by STED microscopy (confocal resolution image of the ARL13B stained axoneme is shown). Arrow indicates PI(4,5)P2 transition zone signal and arrow head indicates PI(3,4,5)P3 transition zone signal, bar indicates 1 μm. (B) Graph shows the axial distance between the highest intensity point of the PI(4,5)P2 and PI(3,4,5)P3 signals parallel to the plane of the axoneme. Bars represent mean ± SEM, n = 3 independent experiments, 30 cilia imaged per experiment and all cilia with distinct PI(4,5)P2 and PI(3,4,5)P3 puncta measured. (C) Example image showing method for the axial distance measurements, bar indicates 1 μm.
FIGURE 5
FIGURE 5
Transition zone phosphoinositide subdomain localization is not altered by stimulation or loss of a regulatory 5-phosphatase, INPP5E. (A–G) Ciliated Inpp5e+ ⁣/ + and Inpp5e–/– MEFs cells were treated + /- 100 nM SAG and immunostained with (A) PI(4,5)P2 or (E) PI(3,4,5)P3 (green), MKS3 (red) and ARL13B (grayscale) antibodies and imaged by STED microscopy (confocal resolution image of the ARL13B stained axoneme is shown). Right panels show merged image at lower magnification. Arrows indicate transition zone PI signals, arrow heads indicate MSK3 localization, bar indicates 1 μm. Graph shows the lateral diameter between the highest intensity points of the (B) MKS3, (C) PI(4,5)P2 or (F) PI(3,4,5)P3 puncta perpendicular to the plane of the axoneme. Bars represent mean ± SEM, n = 3 independent experiments, 30 cilia imaged per experiment and all cilia with two distinct PI or transition zone protein puncta measured. Graph shows the axial distance between the highest intensity point of the (D) PI(4,5)P2 or (G) PI(3,4,5)P3 signal and the MKS3 signal parallel to the plane of the axoneme. Bars represent mean ± SEM, n = 3 (n = 2 for SAG treated Inpp5e–/– cells) independent experiments, 30 cilia imaged per experiment and all cilia with distinct PI or MKS3 puncta measured.
FIGURE 6
FIGURE 6
pAKT(S473) localizes in close proximity to the PIs at the transition zone. (A) Ciliated hTERT-RPE1 cells were immunostained with pAKT(S473) (green), CEP164 or TCTN1 (red) and ARL13B (grayscale) antibodies and imaged by STED microscopy (confocal resolution image of the ARL13B stained axoneme is shown). Right panels show merged image at lower magnification. Arrows indicate transition zone pAKT(S473) signal, arrow heads indicate CEP164 or TCTN1, bar indicates 1 μm. (B) Graph shows the lateral diameter between the highest intensity points of the pAKT(S473), CEP164 or TCTN1 puncta perpendicular to the plane of the axoneme. Bars represent mean ± SEM, n = 3 independent experiments, ≥30 cilia imaged per experiment and all cilia with two distinct pAKT(S473), CEP164 or TCTN1 puncta measured, statistical significance was determined using one-way ANOVA (p < 0.0001) followed by Tukey’s post hoc test, ***p < 0.001, ****p < 0.0001. (C) Graph shows the axial distance between the highest intensity point of the pAKT(S473) signal and CEP164 or TCTN1 parallel to the plane of the axoneme. Bars represent mean ± SEM, n = 3 independent experiments, ≥ 30 cilia imaged per experiment and all cilia with distinct pAKT(S473), CEP164 or TCTN1 puncta measured, statistical significance was determined using Student’s t-test (p = 0.7284). (D) Representative image showing the method used for the lateral diameter and axial distance measurements, bar indicates 1 μm. (E) Ciliated hTERT-RPE1 cells were immunostained with pAKT(S473) (green), TCTN1 (red) and ARL13B (grayscale) antibodies and imaged by STED microscopy (confocal resolution image of the ARL13B stained axoneme is shown). Arrow indicates ring shaped transition zone pAKT(S473) morphology, bar indicates 1 μm.
FIGURE 7
FIGURE 7
INPP5E localizes to the transition zone. (A) hTERT-RPE1 or (B) NIH3T3 cells were transfected with mApple-SSTR3 and GFP or GFP-INPP5E, serum starved and imaged live by confocal microscopy. Arrow indicates transition zone INPP5E localization, bar indicates 2 μm. (C) hTERT-RPE1 cells were transfected with GFP-INPP5E ± mApple-SSTR3, serum starved and imaged live or immunostained with GFP (green) and ARL13B (red) antibodies using 4% PFA, 8% PFA added directly to the culture media in a 1:2 ratio or –20°C methanol fixation and imaged by confocal microscopy. Arrow indicates transition zone INPP5E localization, bar indicates 2 μm. (D) Graphs show the percentage of cells exhibiting exclusive axoneme, exclusive transition zone or axoneme and transition zone INPP5E localization. Bars represent mean ± SEM, n = 3 independent experiments, 30 cilia imaged per experiment, statistical significance was determined by one-way ANOVA (p = 0.0002) followed by Tukey’s post hoc test **p < 0.01, ***p < 0.001.
FIGURE 8
FIGURE 8
INPP5E exhibits a ring-shaped localization at the transition zone. (A) hTERT-RPE1 cells were transfected with GFP-INPP5E, serum starved and immunostained with GFP (green) and ARL13B (grayscale) antibodies and imaged by STED microscopy (confocal resolution image of the ARL13B stained axoneme is shown). Arrows indicate transition zone INPP5E localization, bar indicates 1 μm. (B) Graph shows the lateral diameter between the highest intensity points of the INPP5E transition zone protein puncta perpendicular to the plane of the axoneme. Bars represent mean ± SEM, n = 3 independent experiments, 30 cilia imaged per experiment and all cilia with two distinct INPP5E puncta measured. (C) Example image showing method for the lateral diameter and axial distance measurements, bar indicates 1 μm.
FIGURE 9
FIGURE 9
Model of transition zone phosphoinositide localization. Model depicting the superresolution localization of PI(4,5)P2, PI(3,4,5)P3 and pAKT(S473) in the context of the transition zone protein and distal appendage components.

Similar articles

Cited by

References

    1. Bailey C. C., Zhong G., Huang I. C., Farzan M. (2014). IFITM-family proteins: the cell’s first line of antiviral defense. Annu. Rev. Virol. 1 261–283. 10.1146/annurev-virology-031413-085537 - DOI - PMC - PubMed
    1. Bangs F., Anderson K. V. (2017). Primary cilia and mammalian hedgehog signaling. Cold Spring Harb. Perspect. Biol. 9:a028175. 10.1101/cshperspect.a028175 - DOI - PMC - PubMed
    1. Bielas S. L., Silhavy J. L., Brancati F., Kisseleva M. V., Al-Gazali L., Sztriha L., et al. (2009). Mutations in INPP5E, encoding inositol polyphosphate-5-phosphatase E, link phosphatidyl inositol signaling to the ciliopathies. Nat. Genet. 41 1032–1036. 10.1038/ng.423 - DOI - PMC - PubMed
    1. Chavez M., Ena S., Van Sande J., De Kerchove D’exaerde A., Schurmans S., Schiffmann S. N. (2015). Modulation of ciliary phosphoinositide content regulates trafficking and sonic hedgehog signaling output. Dev. Cell. 34 338–350. 10.1016/j.devcel.2015.06.016 - DOI - PubMed
    1. Chih B., Liu P., Chinn Y., Chalouni C., Komuves L. G., Hass P. E., et al. (2011). A ciliopathy complex at the transition zone protects the cilia as a privileged membrane domain. Nat. Cell. Biol. 14 61–72. 10.1038/ncb2410 - DOI - PubMed