. 2021 Apr 29:9:642212.
doi: 10.3389/fcell.2021.642212. eCollection 2021.

Gene Families With Stochastic Exclusive Gene Choice Underlie Cell Adhesion in Mammalian Cells

Affiliations

Gene Families With Stochastic Exclusive Gene Choice Underlie Cell Adhesion in Mammalian Cells

Mikhail Iakovlev et al. Front Cell Dev Biol. .

Abstract

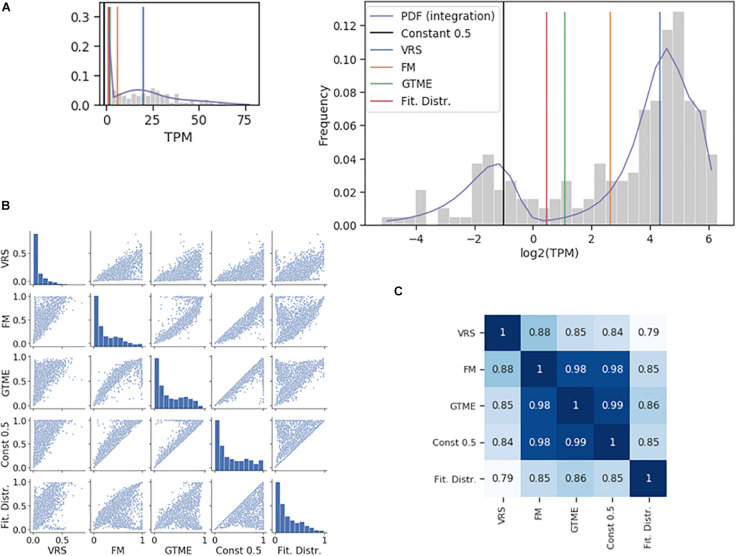
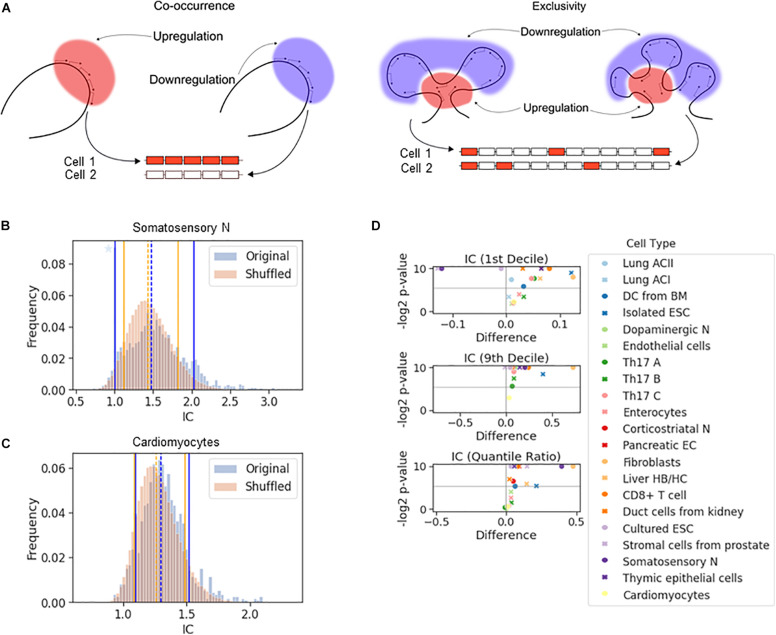
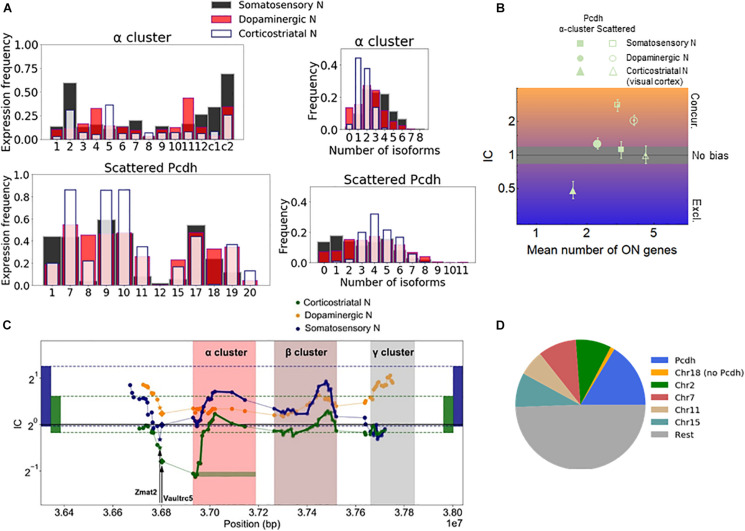
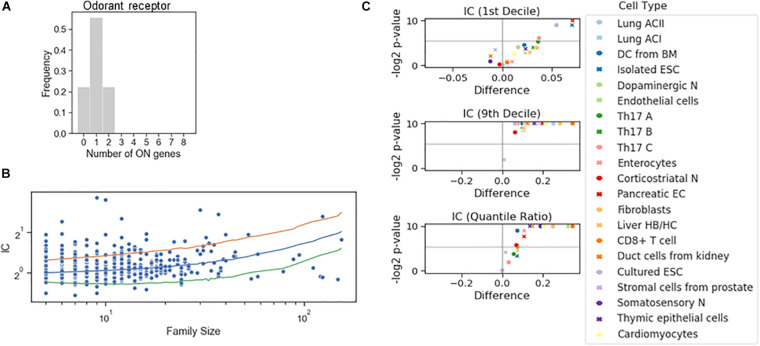
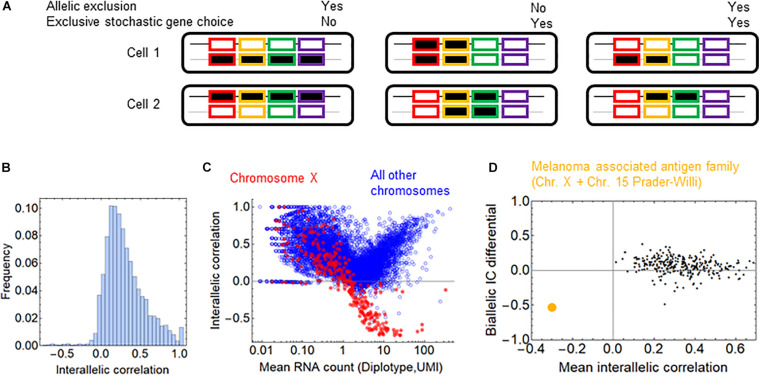
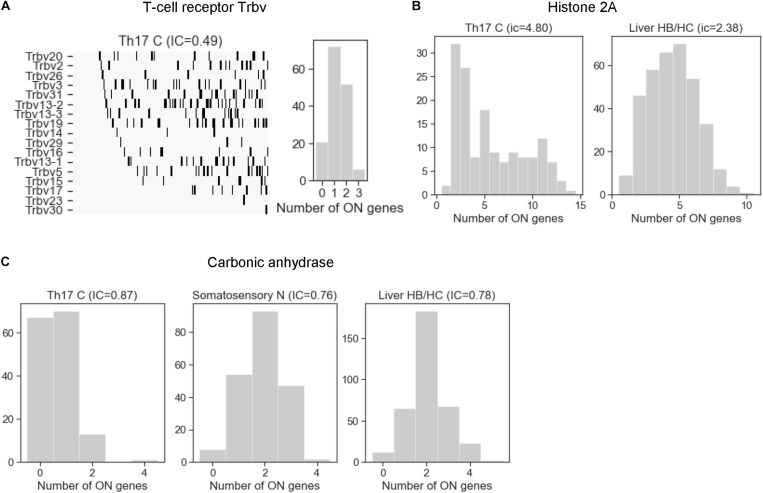
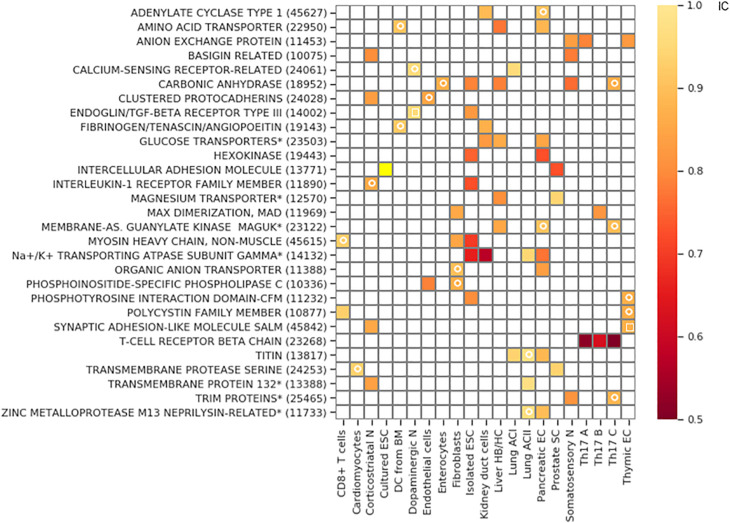
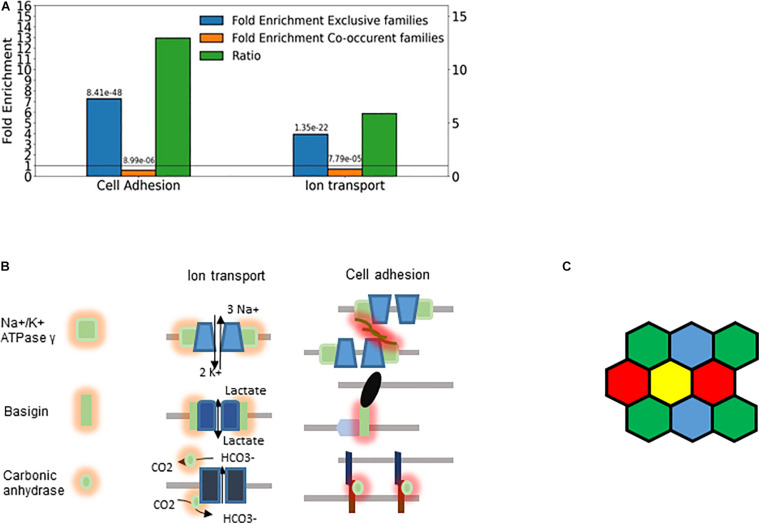
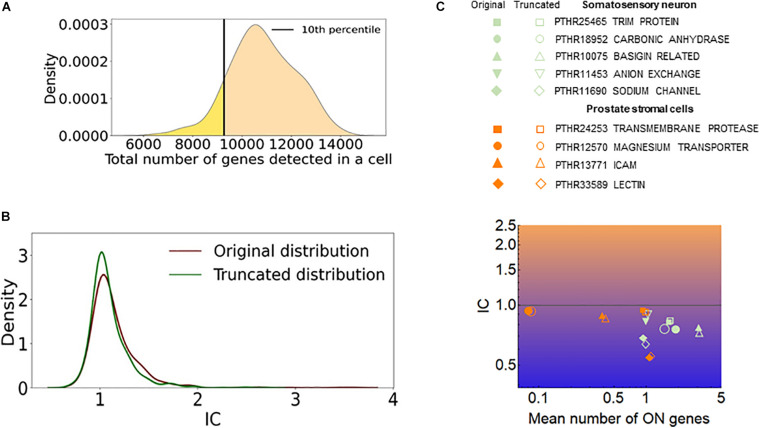
Exclusive stochastic gene choice combines precision with diversity. This regulation enables most T-cells to express exactly one T-cell receptor isoform chosen from a large repertoire, and to react precisely against diverse antigens. Some cells express two receptor isoforms, revealing the stochastic nature of this process. A similar regulation of odorant receptors and protocadherins enable cells to recognize odors and confer individuality to cells in neuronal interaction networks, respectively. We explored whether genes in other families are expressed exclusively by analyzing single-cell RNA-seq data with a simple metric. This metric can detect exclusivity independently of the mean value and the monoallelic nature of gene expression. Chromosomal segments and gene families are more likely to express genes concurrently than exclusively, possibly due to the evolutionary and biophysical aspects of shared regulation. Nonetheless, gene families with exclusive gene choice were detected in multiple cell types, most of them are membrane proteins involved in ion transport and cell adhesion, suggesting the coordination of these two functions. Thus, stochastic exclusive expression extends beyond the prototypical families, permitting precision in gene choice to be combined with the diversity of intercellular interactions.

Keywords: Poisson-binomial distribution; allelic exclusion; basigin; carbonic anhydrase; cell identity; mouse; olfactory receptor; single-cell RNA-seq.


Conflict of interest statement

The authors declare that the research was conducted in the absence of any commercial or financial relationships that could be construed as a potential conflict of interest.

Figures

FIGURE 1
FIGURE 1
Comparison of dichotomization methods. (A) The histogram of the Pcdhac2 transcript numbers in the somatosensory neurons. The dichotomization yielded the following thresholds: 2.11 (GTME), 6.28 (FM), and 20.21 (VRS) TPM. The fitted probability density function (pdf) is a mixture of normal distributions, with an antimode at 1.37. The pdf is integrated piecewise according to the logarithmic bins. The thumbnail plot is a version of the main plot with a linearly scaled x-axis. (B) Pair-wise scatter plots showing the ON cell frequencies of each gene in the somatosensory neuron dataset with a bimodality coefficient greater than 0.55, after dichotomization with different methods. (C) The Spearman rank correlation of the ON cell frequencies shown in (B).
FIGURE 2
FIGURE 2
The effect of chromosomal adjacency on stochastic gene choice. (A) Schemes showing examples of how the two major forms of stochastic gene choice, concurrence and exclusivity, can arise from alternative chromosomal configurations. (B,C) The IC distributions calculated from the original and the shuffled genomes of the somatosensory neurons (B) and cardiomyocytes (C). Segmentation size: 14 genes. The blue star denotes a high bar in the histogram hidden by the full line. The location of the 1st (full line), 5th (dashed line) and 9th (full line) deciles is given in the order of original and reshuffled distribution, followed by the P-values for the differences: 1.00, 1.48, 2.02; 1.12, 1.44, 1.82; 0.001, 0.016, 0.001. (B) 1.10, 1.29, 1.52; 1.09, 1.26, 1.49; 0.217, 0.002, 0.137 (C). (D) Volcano plots showing the difference of 1st decile, 9th decile and quantile ratio IC values between the original and the shuffled genomes, along with the corresponding P-values (permutation test, segment size: 14 genes). The gray horizontal line at 0.025 corresponds to a two-tailed significance level of 0.05.
FIGURE 3
FIGURE 3
Chromosomal segments with stochastic exclusive gene choice in multiple cell types. (A) The expression of the Pcdh α-array and the scattered Pcdhs in different neuronal types. The expression frequency indicates the proportion of cells expressing a particular gene isoform. The distribution of the number of expressed gene isoforms per cell indicates the proportion of cells expressing 0, 1, 2 or more isoforms per cell at the RNA level. (B) The IC values calculated from the data shown in (A). The error bars denote the 95% confidence intervals obtained by bootstrapping. (C) The IC of segments with 14 genes along the chromosome. The symbols indicate the position of the most upstream gene in each segment. A full segment is denoted by the green horizontal rectangle, at the first gene of the Pcdh-α cluster. The two genes upstream of the Pcdh α cluster (Vaultrc5 and Zmat2) are marked with a star and diamond. The rectangles located at the two extremes of the plot indicate the 2.5 and 97.5 percentiles of the IC distribution calculated for the chromosomal segments in the genome. (D) The number of chromosomal segments with exclusive gene choice (as shown in Supplementary Figure 5) in each chromosome for all cell types combined.
FIGURE 4
FIGURE 4
Stochastic interdependence in gene families. (A) The number of expressed genes per cell in the family of odorant receptor genes, dichotomized with the familywise threshold (70.7 TPM). Number of cells is N = 27. (B) IC values of individual families in somatosensory neuron dataset, grouped by the family size. The majority of the families with ICs exceeding either 2.5 or 97.5 IC percentiles of the shuffled genome (orange and green lines, respectively) are concurrent. (C) Volcano plots showing the difference of 1st decile, 9th decile and quantile Ratio IC values between the original and the shuffled genomes, along with the corresponding P-values (permutation test) calculated for the gene families consisting of 7 genes.
FIGURE 5
FIGURE 5
Allelic exclusion and exclusivity in stochastic gene choice. (A) Schematic representation of different combinations of exclusivity in allelic and gene choice in an array of four genes. The black and gray lines represent the maternal and paternal chromosomes. The rectangles with no or black filling represent the OFF and ON expression states, respectively (B) The interallelic correlation in fibroblasts (Larsson et al., 2019). Negative correlations indicate the allelic exclusion. (C) The relation between RNA count and interallelic correlation. The genes on the chromosome X are shown in red. (D) The melanoma-associated antigen gene family is highlighted in orange among the gene families. It is the only family with negative mean interallelic correlation.
FIGURE 6
FIGURE 6
The distribution of the number of expressed gene isoforms (ON genes) per cell in gene families with exclusive and concurrent expression. (A) The T-cell receptor beta chain family shows a clear exclusivity in Th17 cells (IC = 0.49). The left plot shows the dichotomized expression states. Each column represents a single cell. The gene isoforms are ordered according to expression frequency (highest on the top) and the cells are ordered according to number of expressed isoforms per cell (lowest on the left side). (B) The histone 2A family shows co-occurrence in Th17 and liver HB/HC cells, with an IC value of 4.8 and 2.38, respectively. (C) The number of expressed carbonic anhydrase genes per cell in Th17 cells, somatosensory neurons, and liver HB/HC (IC = 0.87, 0.76 and 0.78, respectively).
FIGURE 7
FIGURE 7
Gene families with exclusive gene choice. Gene families with stochastic exclusive gene choice in two or more cell types; further details of selection as in Supplementary Figure 5 (see also Supplementary Data 1). For the families labeled with star, descriptive names were given instead of the Panther names. The Panther numbers of the families are indicated in parenthesis. The white circle denotes segments with an IC numerically less than 1 without reaching significance. The white empty squares indicates the families that lose exclusivity after truncation of the cell population at the 10th percentile of the total number of detected genes per cell.
FIGURE 8
FIGURE 8
Cellular individuality and cell adhesion. (A) Enrichment analysis of the genes belonging to exclusive and concurrent gene families. The P-values are indicated on the top of the bars. The exclusive families were selected with the criteria described in Figures 4B, 7. The concurrent families (IC belonging to top 2.5 percentile) were constrained with the following criteria: mean number of expressed genes per cell higher than 0.03, IC significantly higher than 1 and at least 5 non-zero genes per family. We considered all the genes expressed at least in one cell type belonging to the selected families. The enrichment analysis was performed though an enrichment analysis tool (http://geneontology.org/). The figure shows two selected functions: Cell adhesion (GO: 0007155) and Ion transport (GO: 0006811). The ratio of the fold-enrichment in the exclusive to that in concurrent families is shown. (B) Schematic representation highlighting the dual role of three gene families (Fxyd, basigin, and carbonic anhydrase genes). On the left side, the cis interaction of the corresponding proteins with channels and pumps is denoted by orange shades. These functions are related to metabolic and ion homeostasis. On the right side, the trans-interaction with ligands on the adjacent cells is labeled with red shades. The glycosylation of the Fxyd protein affects the transdimerization of the Na+/K+ ATPase. The carbonic anhydrase interacts with the anion exchange protein, which transports HCO3. (C) Schematic representation of cells showing that the exclusive expression of four gene isoforms (colors) is sufficient to confer cellular individuality in a two dimensional tissue.
FIGURE 9
FIGURE 9
The effect of cells with low number of detected genes on the IC. (A) The distribution of the total number of detected genes per cell (dgpc) in the somatosensory neuron dataset. The black line indicates the dgpc below which the cells were removed to obtain the truncated distribution. (B) The distribution of IC values of gene families calculated from the original and truncated cell populations shown in (A). (C) The IC and the mean number of ON genes calculated with the original (full) and the truncated (empty) datasets. The prostate stromal cell and the somatosensory neuron datasets were used.

Similar articles

Cited by

References

    1. Ahrens T., Pertz O., Haussinger D., Fauser C., Schulthess T., Engel J. (2002). Analysis of heterophilic and homophilic interactions of cadherins using the c-Jun/c-Fos dimerization domains. J. Biol. Chem. 277 19455–19460. 10.1074/jbc.m200606200 - DOI - PubMed
    1. Alexander R. A. (1990). A note on averaging correlations. Bull. Psychon. Soc. 28 335–336. 10.3758/bf03334037 - DOI
    1. Almenar-Queralt A., Merkurjev D., Kim H. S., Navarro M., Ma Q., Chaves R. S., et al. (2019). Chromatin establishes an immature version of neuronal protocadherin selection during the naive-to-primed conversion of pluripotent stem cells. Nat. Genet. 51 1691–1701. 10.1038/s41588-019-0526-4 - DOI - PMC - PubMed
    1. Arcangeli A., Becchetti A. (2006). Complex functional interaction between integrin receptors and ion channels. Trends Cell Biol. 16 631–639. 10.1016/j.tcb.2006.10.003 - DOI - PubMed
    1. Baran-Gale J., Chandra T., Kirschner K. (2018). Experimental design for single-cell RNA sequencing. Brief. Funct. Genom. 17 233–239. 10.1093/bfgp/elx035 - DOI - PMC - PubMed

LinkOut - more resources