

Proteomic Analysis on Anti-Proliferative and Apoptosis Effects of Curcumin Analog, 1,5-bis(4-Hydroxy-3-Methyoxyphenyl)-1,4-Pentadiene-3-One-Treated Human Glioblastoma and Neuroblastoma Cells
- PMID: 33996900
- PMCID: PMC8119891
- DOI: 10.3389/fmolb.2021.645856
Proteomic Analysis on Anti-Proliferative and Apoptosis Effects of Curcumin Analog, 1,5-bis(4-Hydroxy-3-Methyoxyphenyl)-1,4-Pentadiene-3-One-Treated Human Glioblastoma and Neuroblastoma Cells
Abstract
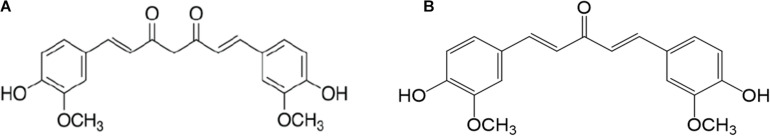
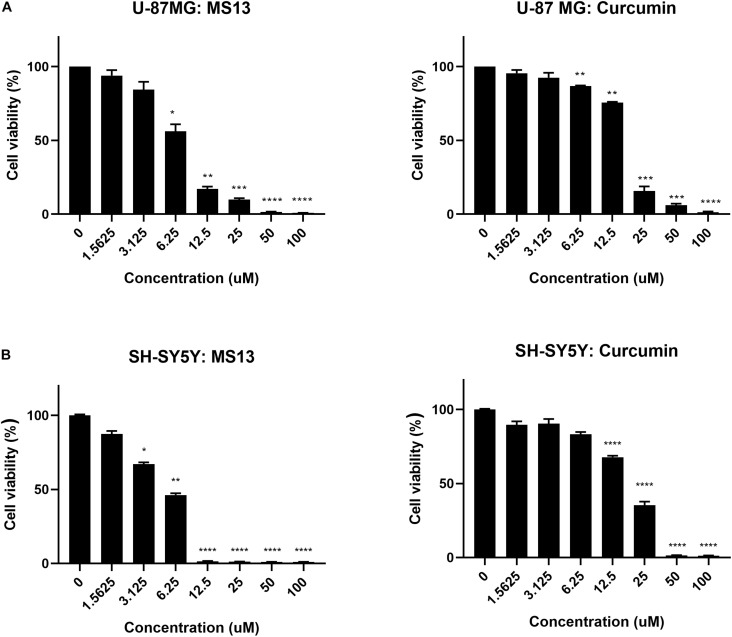
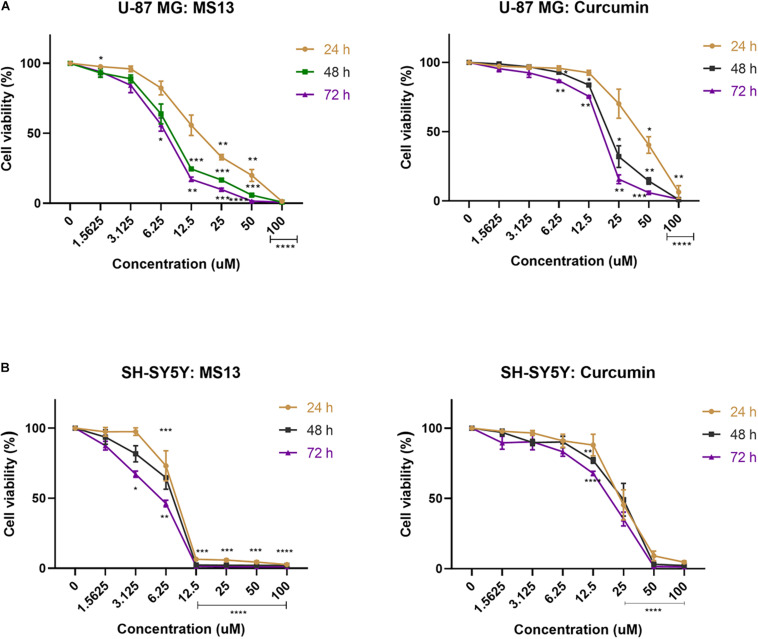
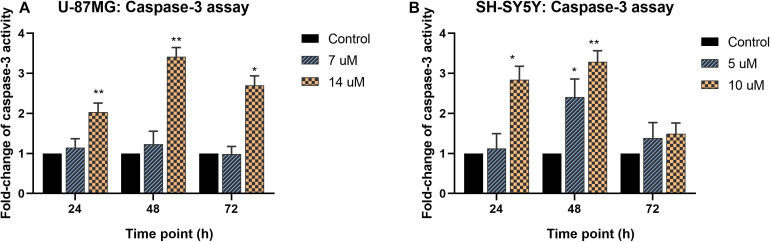
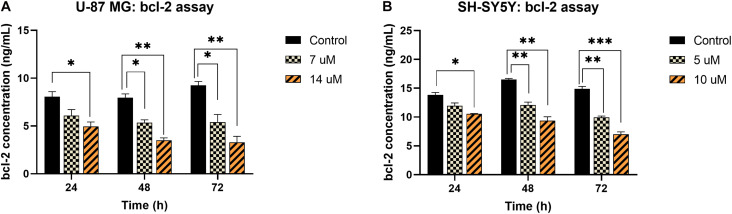
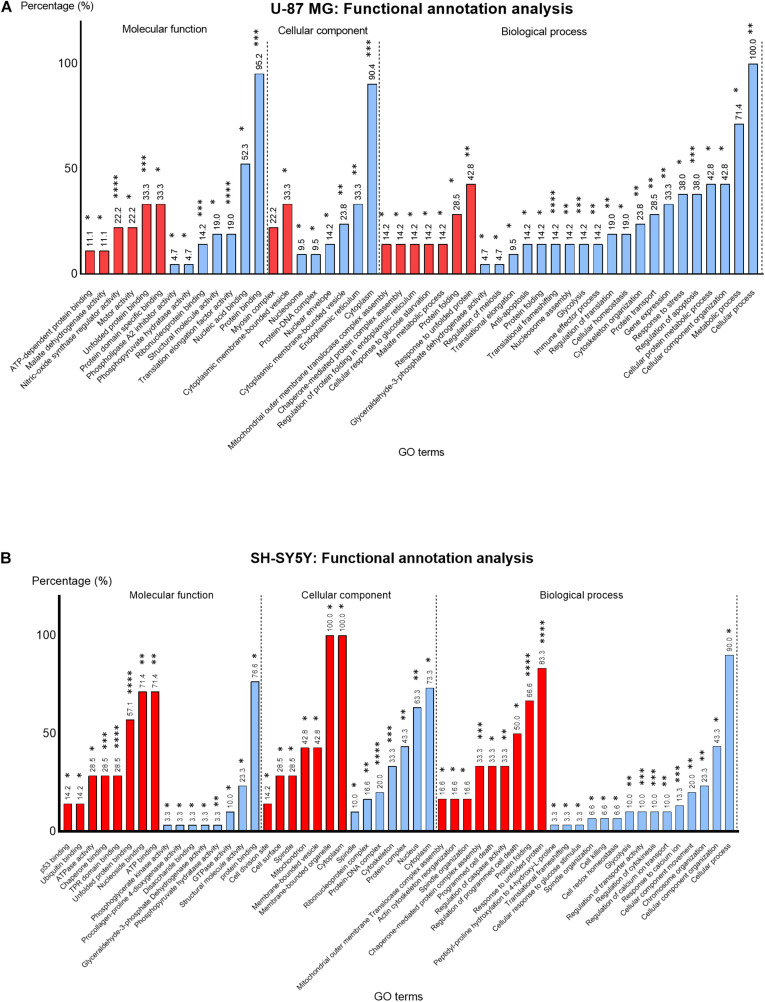
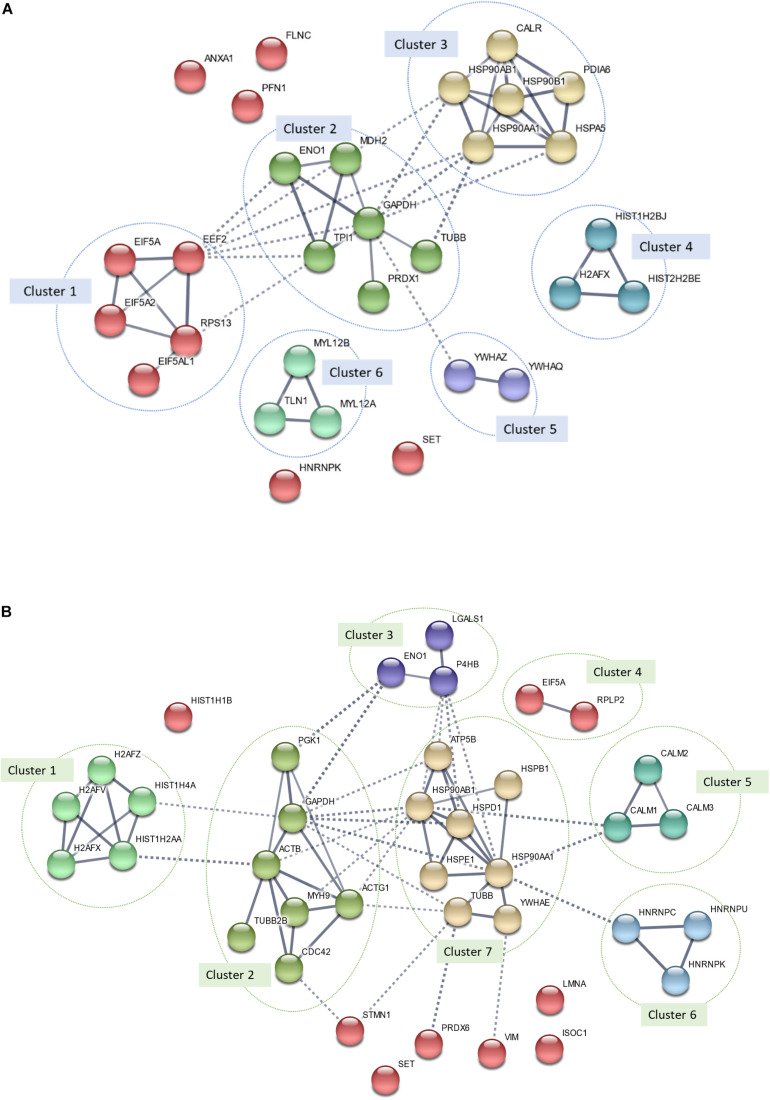
Curcumin analogs with excellent biological properties have been synthesized to address and overcome the poor pharmacokinetic profiles of curcumin. This study aims to investigate the cytotoxicity, anti-proliferative, and apoptosis-inducing ability of curcumin analog, MS13 on human glioblastoma U-87 MG, and neuroblastoma SH-SY5Y cells, and to examine the global proteome changes in these cells following treatment. Our current findings showed that MS13 induced potent cytotoxicity and anti-proliferative effects on both cells. Increased caspase-3 activity and decreased bcl-2 concentration upon treatment indicate that MS13 induces apoptosis in these cells in a dose- and time-dependent manner. The label-free shotgun proteomic analysis has defined the protein profiles in both glioblastoma and neuroblastoma cells, whereby a total of nine common DEPs, inclusive of glyceraldehyde 3-phosphate dehydrogenase (GAPDH), alpha-enolase (ENO1), heat shock protein HSP 90-alpha (HSP90AA1), Heat shock protein HSP 90-beta (HSP90AB1), Eukaryotic translation initiation factor 5A-1 (EFI5A), heterogenous nuclear ribonucleoprotein K (HNRNPK), tubulin beta chain (TUBB), histone H2AX (H2AFX), and Protein SET were identified. Pathway analysis further elucidated that MS13 may induce its anti-tumor effects in both cells via the common enriched pathways, "Glycolysis" and "Post-translational protein modification." Conclusively, MS13 demonstrates an anti-cancer effect that may indicate its potential use in the management of brain malignancies.
Keywords: anti-proliferation; apoptosis; cytotoxicity; diarylpentanoids; glioblastoma; neuroblastoma; shotgun proteomics.
Copyright © 2021 Lee, Rajadurai, Abas, Othman and Naidu.
Conflict of interest statement
The authors declare that the research was conducted in the absence of any commercial or financial relationships that could be construed as a potential conflict of interest.
Figures
Similar articles
-
Diarylpentanoid (1,5-bis(4-hydroxy-3-methoxyphenyl)-1,4-pentadiene-3-one) (MS13) Exhibits Anti-proliferative, Apoptosis Induction and Anti-migration Properties on Androgen-independent Human Prostate Cancer by Targeting Cell Cycle-Apoptosis and PI3K Signalling Pathways.Front Pharmacol. 2021 Jul 20;12:707335. doi: 10.3389/fphar.2021.707335. eCollection 2021. Front Pharmacol. 2021. PMID: 34366863 Free PMC article.
-
The Curcumin Analogue, MS13 (1,5-Bis(4-hydroxy-3- methoxyphenyl)-1,4-pentadiene-3-one), Inhibits Cell Proliferation and Induces Apoptosis in Primary and Metastatic Human Colon Cancer Cells.Molecules. 2020 Aug 20;25(17):3798. doi: 10.3390/molecules25173798. Molecules. 2020. PMID: 32825505 Free PMC article.
-
Molecular Mechanisms of Antiproliferative and Apoptosis Activity by 1,5-Bis(4-Hydroxy-3-Methoxyphenyl)1,4-Pentadiene-3-one (MS13) on Human Non-Small Cell Lung Cancer Cells.Int J Mol Sci. 2021 Jul 10;22(14):7424. doi: 10.3390/ijms22147424. Int J Mol Sci. 2021. PMID: 34299042 Free PMC article.
-
Anti-Cancer Mechanisms of Diarylpentanoid MS17 (1,5-Bis(2-hydroxyphenyl)-1,4-pentadiene-3-one) in Human Colon Cancer Cells: A Proteomics Approach.Int J Mol Sci. 2024 Mar 20;25(6):3503. doi: 10.3390/ijms25063503. Int J Mol Sci. 2024. PMID: 38542474 Free PMC article.
-
The Curcumin Analogue 1,5-Bis(2-hydroxyphenyl)-1,4-pentadiene-3-one Induces Apoptosis and Downregulates E6 and E7 Oncogene Expression in HPV16 and HPV18-Infected Cervical Cancer Cells.Molecules. 2015 Jun 29;20(7):11830-60. doi: 10.3390/molecules200711830. Molecules. 2015. PMID: 26132907 Free PMC article.
Cited by
-
Mycoplasma suis Alpha-Enolase Subunit Vaccine Induces an Immune Response in Experimental Animals.Vaccines (Basel). 2021 Dec 20;9(12):1506. doi: 10.3390/vaccines9121506. Vaccines (Basel). 2021. PMID: 34960252 Free PMC article.
-
Signaling pathways in cancer metabolism: mechanisms and therapeutic targets.Signal Transduct Target Ther. 2023 May 10;8(1):196. doi: 10.1038/s41392-023-01442-3. Signal Transduct Target Ther. 2023. PMID: 37164974 Free PMC article. Review.
-
In Vitro Anti-Proliferative and Apoptotic Effects of Hydroxytyrosyl Oleate on SH-SY5Y Human Neuroblastoma Cells.Int J Mol Sci. 2022 Oct 15;23(20):12348. doi: 10.3390/ijms232012348. Int J Mol Sci. 2022. PMID: 36293207 Free PMC article.
-
Curcuminoids as Anticancer Drugs: Pleiotropic Effects, Potential for Metabolic Reprogramming and Prospects for the Future.Pharmaceutics. 2023 May 29;15(6):1612. doi: 10.3390/pharmaceutics15061612. Pharmaceutics. 2023. PMID: 37376060 Free PMC article. Review.
-
Recent Developments in Glioblastoma-On-A-Chip for Advanced Drug Screening Applications.Small. 2025 Jan;21(1):e2405511. doi: 10.1002/smll.202405511. Epub 2024 Nov 13. Small. 2025. PMID: 39535474 Review.
References
-
- Bandino A., Geerts D., Koster J., Bachmann A. S. (2014). Deoxyhypusine synthase (DHPS) inhibitor GC7 induces p21/Rb-mediated inhibition of tumor cell growth and DHPS expression correlates with poor prognosis in neuroblastoma patients. Cell. Oncol. 37 387–398. 10.1007/s13402-014-0201-9 - DOI - PubMed
-
- Bhutia Y. D., Hung S. W., Krentz M., Patel D., Lovin D., Manoharan R., et al. (2013). Differential processing of let-7 a precursors influences RRM2 expression and chemosensitivity in pancreatic cancer: role of LIN-28 and SET oncoprotein. PLoS One 8:e53436. 10.1371/journal.pone.0053436 - DOI - PMC - PubMed
LinkOut - more resources
Full Text Sources
Other Literature Sources
Molecular Biology Databases
Research Materials
Miscellaneous